惯性聚合 高效追踪和阅读你感兴趣的博客、新闻、科技资讯
阅读原文 在惯性聚合中打开

推荐订阅源

V
Vulnerabilities – Threatpost
P
Proofpoint News Feed
The Hacker News
The Hacker News
Know Your Adversary
Know Your Adversary
Threat Intelligence Blog | Flashpoint
T
Tenable Blog
AWS News Blog
AWS News Blog
S
Securelist
T
Threatpost
C
Cybersecurity and Infrastructure Security Agency CISA
IT之家
IT之家
腾讯CDC
WordPress大学
WordPress大学
Spread Privacy
Spread Privacy
C
Check Point Blog
cs.CL updates on arXiv.org
Engineering at Meta
Engineering at Meta
Latest news
Latest news
A
About on SuperTechFans
The Register - Security
L
LINUX DO - 热门话题
T
The Exploit Database - CXSecurity.com
C
Cisco Blogs
T
Tailwind CSS Blog
Simon Willison's Weblog
阮一峰的网络日志
阮一峰的网络日志
MyScale Blog
MyScale Blog
大猫的无限游戏
大猫的无限游戏
T
Tor Project blog
L
Lohrmann on Cybersecurity
G
GRAHAM CLULEY
B
Blog RSS Feed
Scott Helme
Scott Helme
让小产品的独立变现更简单 - ezindie.com
NISL@THU
NISL@THU
P
Privacy International News Feed
Security Latest
Security Latest
Recorded Future
Recorded Future
L
LangChain Blog
Cyberwarzone
Cyberwarzone
C
Cyber Attacks, Cyber Crime and Cyber Security
C
CXSECURITY Database RSS Feed - CXSecurity.com
博客园 - 聂微东
Google DeepMind News
Last Week in AI
Last Week in AI
Apple Machine Learning Research
F
Fortinet All Blogs
O
OpenAI News
T
Threat Research - Cisco Blogs
Blog — PlanetScale
Blog — PlanetScale

Datadog | The Monitor blog

Introducing our open source AI-native SAST Instrument and monitor Boomi integration flows with OpenTelemetry and Datadog Not all index scans are equal: How we cut query latency by over 99% Platform engineering metrics: What to measure and what to ignore Integrate Recorded Future threat intelligence with Datadog Cloud SIEM CI/CD security: threat modeling using a MITRE-style threat matrix CI/CD security: How to secure your GitHub ecosystem Ingress NGINX is EOL: A practical guide for migrating to Kubernetes Gateway API Operating agentic AI with Amazon Bedrock AgentCore and Datadog LLM Observability: Lessons from NTT DATA Introducing the Datadog Code Security MCP Capture and analyze custom heatmaps in Session Replay Understand session replays faster with AI summaries and smart chapters Monitor ClickHouse query performance with Datadog Database Monitoring How we designed empathetic alert sounds for on-call engineers Search and act across Datadog to resolve issues faster with Bits Assistant Measure the business impact of every product change with Datadog Experiments Analyzing round trip query latency Configuring JavaScript caches for better performance Introducing Bits AI Dev Agent for Code Security Datadog achieves ISO 42001 certification for responsible AI Monitor Nutanix clusters, hosts, and VMs with Datadog Monitor Juniper Mist in Datadog A new Host Map for modern infrastructure Annotate traces to improve LLM quality with Datadog LLM Observability What’s new in Cloud SIEM: AI-powered investigations, enhanced threat intelligence, and scalable security operations Explore Kubernetes with native OpenTelemetry data Monitor Oracle Fusion Cloud Applications with Datadog Announcing the Datadog Terraform provider v4.0.0 Scaling Kubernetes workloads on custom metrics How to design cloud environments for AI-powered threat analysis Monitor Aruba Central in Datadog How we centralize and remediate risks with Datadog Case Management Accelerate incident response with Datadog and ServiceNow Monitor your application and network load balancer logs Understanding Karpenter architecture for Kubernetes autoscaling Tools for collecting metrics and logs from Karpenter Monitor Karpenter with Datadog What your product data is actually saying Key metrics for monitoring Karpenter Securing Datadog’s platform in the AI age: The role of observability data Four ways engineering teams use the Datadog MCP Server to power AI agents Approaching your observability migration with the right mindset Meet the new Bits AI SRE: Deeper reasoning, twice as fast Key learnings from the 2026 State of DevSecOps study Use plain English to query your multi-cloud infrastructure in Resource Catalog Simplifying troubleshooting across the user journey with Datadog Synthetic Monitoring Protect your OCI resources with Datadog Cloud Security This Month in Datadog - February 2026 Amazon EC2 security: How misconfigured and public AMIs expand your cloud attack surface Enable end-to-end visibility into your Java apps with a single command Measure and improve mobile app startup performance with Datadog RUM Evaluating our AI Guard application to improve quality and control cost Identify untested code across every level of your codebase Make use of guardrail metrics and stop babysitting your releases Monitor Versa Networks SD-WAN performance in Datadog Improve performance and reliability with APM Recommendations Remediate transitive vulnerabilities faster with Datadog Software Composition Analysis Generate audit-ready vulnerability and compliance reports with Datadog Sheets Monitor Fortinet FortiManager performance in Datadog Improve test coverage across codebases with Datadog Code Coverage Move fast, don’t break things: Consistent testing standards at scale Enrich logs with ServiceNow CMDB context before routing to any SIEM or logging tool Monitor Lustre with Datadog Make faster, better product decisions with Datadog Product Analytics Surface and remediate runtime posture issues with Workload Protection Findings Protect agentic AI applications with Datadog AI Guard How to optimize JavaScript code with CSS Trace Google Pub/Sub workloads in Cloud Run with Datadog Detect human names in logs with ML in Sensitive Data Scanner How we cut our NLQ agent debugging time from hours to minutes with LLM Observability Debug PostgreSQL query latency faster with EXPLAIN ANALYZE in Datadog Database Monitoring Datadog acquires Propolis Unify and correlate frontend and backend data with retention filters Scale compliance across global frameworks with Datadog Cloud Security Monitor Arista VeloCloud SD-WAN performance with Datadog Building reliable dashboard agents with Datadog LLM Observability Simplify log collection and aggregation for MSSPs with Datadog Observability Pipelines Mitigation for Node.js denial-of-service vulnerability affecting Datadog APM Automate flaky test fixes with the Bits AI Dev Agent and Test Optimization How we built an AI SRE agent that investigates like a team of engineers Datadog integrations 2025 recap: Observability for AI, security, and hybrid cloud Design effective executive dashboards with Datadog Implement dbt data quality checks with dbt-expectations Bring faster visibility into AWS Lambda functions with remote instrumentation Troubleshoot faster with the GitLab Source Code integration in Datadog How Cambia Health Solutions saved $30,000 monthly with Cloud Cost Management and the Datadog Resource Catalog Normalize any logs for Cloud SIEM with Datadog's OCSF processor Optimizing Datadog at scale: Cost-efficient observability at Zendesk Detect, diagnose, and resolve network issues easily with CNM Network Health Connect engineering errors to user impact in early-stage products Cilium configuration for Kubernetes operations at scale Designing feedback loops for progressive delivery Ship features faster and safer with Datadog Feature Flags Choosing the right OpenTelemetry Collector distribution Route your monitor alerts with Datadog monitor notification rules Automate Cloud SIEM investigations with Bits AI Security Analyst Cloud threat detection: How to identify risky activity across control and data planes Collecting Kafka performance metrics Monitoring Kafka with Datadog Monitoring Kafka performance metrics
Explore your data in full-screen graph mode
Miranda Kapin · 2019-06-21 · via Datadog | The Monitor blog

As you navigate through Datadog, you may find that you want to dive into a graph to explore your timeseries data more deeply, or make quick changes to a graph without permanently altering it. To make it easier to explore the data in your graphs, we’re excited to introduce a newly revamped full-screen view for our timeseries graphs. You can now quickly and easily apply functions, navigate through time to find anomalies, and save and share your work. To access this exploratory view, either double click on your graph’s header, or click on the full-screen button in the upper right-hand side of the graph.

Explore your timeseries data

Full-screen graphs enable you to apply advanced functions such as anomaly detection to your graphs, without needing to build a new graph or clone an existing one. With this new feature you can quickly click to apply smoothing, trend lines, anomaly detection, forecasting, or outlier detection. You can also visualize a cumulative sum of the data or an overlay of historical timeseries for comparison to a previous timeframe.

The new full-screen view doesn’t just allow you to transform your graphs—you can also see how the data in your graphs fits into trends over longer timeframes. The mini-map below the main graph in full-screen mode displays the recent history of the timeseries so you can see the bigger picture, click and drag to switch timeframes, and zoom in and out of your selected timeframe on the fly.

Create new visualizations

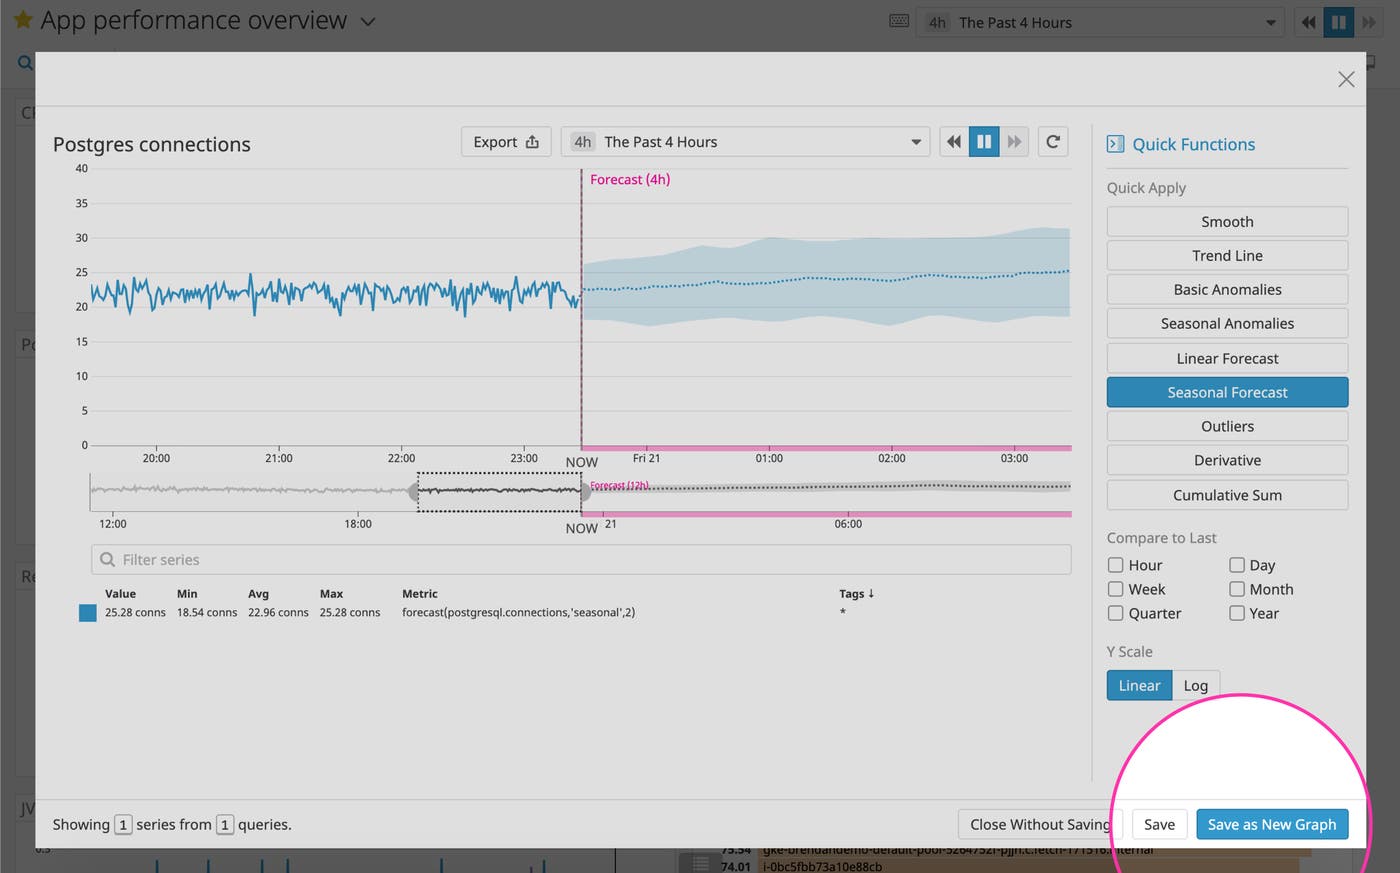
The full-screen view is a great way to explore your data without needing to create a new graph or permanently modify your existing graphs. But if you do create a visualization that you want to keep, it’s easy to save the changes to the current graph or save the visualization as a new graph.

Save your exploratory graphs to your dashboard

Try full-screen graph mode

If you’re already a Datadog customer, you can start exploring your data in full-screen mode on your existing dashboards today. If you aren’t yet using Datadog, you can sign up for a 14-day free trial and start visualizing all your data in one place.