






Ansible is an infrastructure automation solution that enables users to provision, deploy, and manage their infrastructure and applications. Ansible roles, which are similar to Puppet modules and Chef cookbooks, are shippable modules that users can download from the open source Ansible Galaxy in order to quickly accomplish important tasks, such as installing a database and configuring its service.
Datadog’s Ansible role and integration enable you to go a step beyond infrastructure as code to implementing monitoring as code. The Datadog Ansible role allows you to deploy the Datadog Agent and enable other Datadog integrations, while the callback plugin provides Ansible reporting and visibility into key metrics and events, including failed tasks, in an out-of-the-box dashboard like the one shown below.
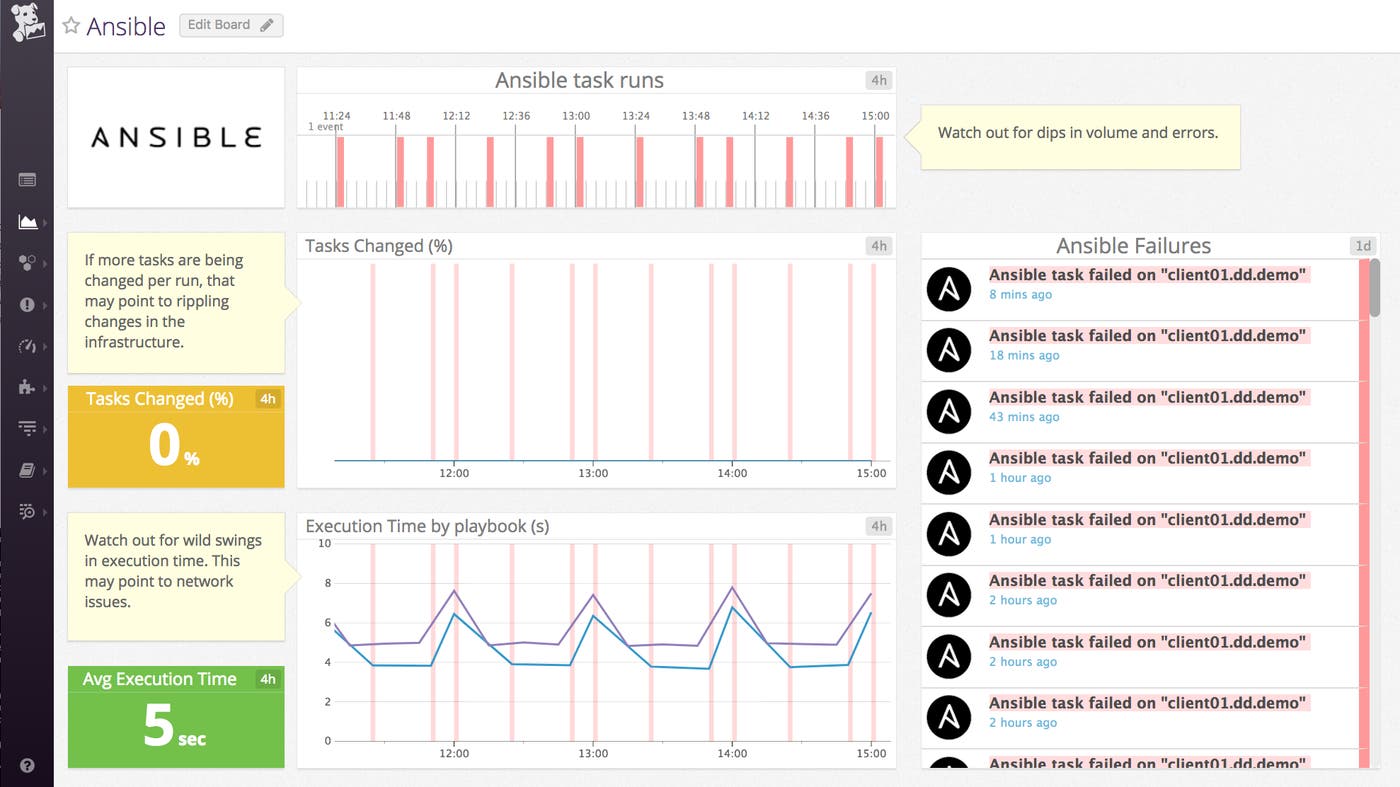
In this guide, we will show you how to use this Ansible role and callback plugin to quickly deploy the Datadog Agent on a node, and track Ansible performance metrics and events in Datadog. To follow along, you’ll need a Datadog account. (If you’re not yet a Datadog user, sign up for a free trial here.)
Unlike many other configuration management solutions, Ansible follows the push method, so you only need to install Ansible on a control machine (the system you’re going to push from)—you won’t need to install it on any of the nodes that you intend to manage. Installing Ansible is as easy as running:
You also have the option to install it via your distribution’s package manager. Next, you’ll need to clone the example repository on your control machine:
git clone https://github.com/DataDog/dd_ansible_example.git
Then navigate into the repo and install its dependencies:
pip install -r requirements.txt
Typically, you would install an Ansible role with the ansible-galaxy command, but in this case, we can skip that step because the dd_ansible_example repository already includes a copy of the Datadog role. This repository also includes a callback plugin that will send Ansible events to Datadog. (Normally, you would install that on your server by following the steps outlined here.)
Note: In this guide, all file paths and commands will be listed relative to the location of the local dd_ansible_example repository on your control machine.
In order to start using Datadog’s Ansible role and integration, we’ll need to source the setenv file to tell Ansible a few things about our environment (where the hosts file lives, where to access the Ansible configuration file, etc.).
Next, we need to tell Ansible the fully qualified domain names (FQDNs) or IPs of the nodes we want to manage. In this example, we are managing a single node (an Ubuntu 14 instance), so we only need to add that Ubuntu instance’s FQDN to the ./hosts file:
echo "yourinstance.fqdn.name" >> ./hosts
Add a valid API key (accessible in your Datadog account here) to the playbook (./playbooks/dd_agent.yml). You’ll also need to add it to the callback plugin, (./playbooks/callback_plugins/datadog_callback.yml) where indicated. This will allow the plugin to report the results of playbook runs to the Datadog event stream. Alternatively, you can also choose to set your Datadog API key in the callback by using an environment variable or hostvars, as explained in the callback documentation.
Ansible uses SSH to push changes from the control machine (wherever you installed Ansible and the example repository) to the remote system it needs to manage. Before you can execute your first Ansible command, you’ll need to set up SSH access, as outlined in the Ansible documentation. Once you’ve set up SSH access between your control machine and your remote node, go ahead and test it out by running:
ansible -m ping -i hosts mynodes
You should see something similar to the following output:
yourinstance.fqdn.name | SUCCESS => {
"changed": false,
"ping": "pong"
}
This indicates that Ansible was able to successfully contact your remote node.
Now we’re ready to actually run our Ansible playbook, which will call the Datadog role and install the Datadog Agent on your node. Switch into the playbooks directory and run the playbook:
ansible-playbook dd_agent.yml
The output of this command will give you details of the individual tasks being performed. It will also generate two events and send them to Datadog: one that marks the start of a playbook run, and another that marks its completion. If any errors occur during the run of the playbook, they will also be displayed in the event description. Navigate to your Datadog event stream to see the results of your Ansible playbook run, which should look something like this:

This tells us that Ansible successfully deployed the Datadog Agent on the node listed in our hosts file.
Let’s take a closer look behind the scenes to understand how Ansible followed our playbook (./playbooks/dd_agent.yml) to execute the Agent push.
- hosts: mynodes
remote_user: ubuntu
become: yes
roles:
- role: Datadog.datadog
vars:
datadog_api_key: <YOUR API KEY>
datadog_agent_version: 1:5.20.2-1
The hosts section defines the group of hosts we’re pushing to—in this case, the group name mynodes that was predefined in our hosts file. In a previous step, we used echo to add the FQDN of our server to the mynodes group of the hosts file.
remote_user: ubuntu refers to the SSH username that Ansible should use in order to execute this push on the remote host, and become: yes allows the specified user to elevate to sudo privileges if necessary (required for package installs and service reboots).
Over the next few lines, we call the Datadog role and pass two variables to it: our API key and the version of the Agent we want to push. Specifying a version number is optional, but highly recommended. For example, to deploy version 5.20.2 of the Agent, you would specify 1:5.20.2-1 on apt-based distributions, or 5.20.2-1 on yum-based distributions.
In less than 10 lines, we set up Ansible to deploy the Datadog Agent on a remote server. We easily could have pushed the Agent to many more systems simply by adding them to the mynodes section of our Ansible hosts file.
One key benefit of using Datadog’s Ansible integration is that you’ll automatically get access to an out-of-the-box dashboard that provides a high-level overview of Ansible performance and activity. You’ll also be able to view dashboards for any of the integrations that you enable using the Datadog Ansible role.
You can use this dashboard to track key information about Ansible performance, including the average time it takes to execute playbooks and the percentage of changes resulting from those pushes. You can also clone and modify this dashboard to get deeper insights into changes as they are deployed across your infrastructure and applications.
Because Datadog’s callback plugin provides real-time Ansible reporting, you can overlay playbook executions and failures over any timeseries graph to help troubleshoot and investigate issues across your infrastructure and applications. Below, we searched for Ansible events and overlaid them on a dashboard that tracks the performance of one of our applications.
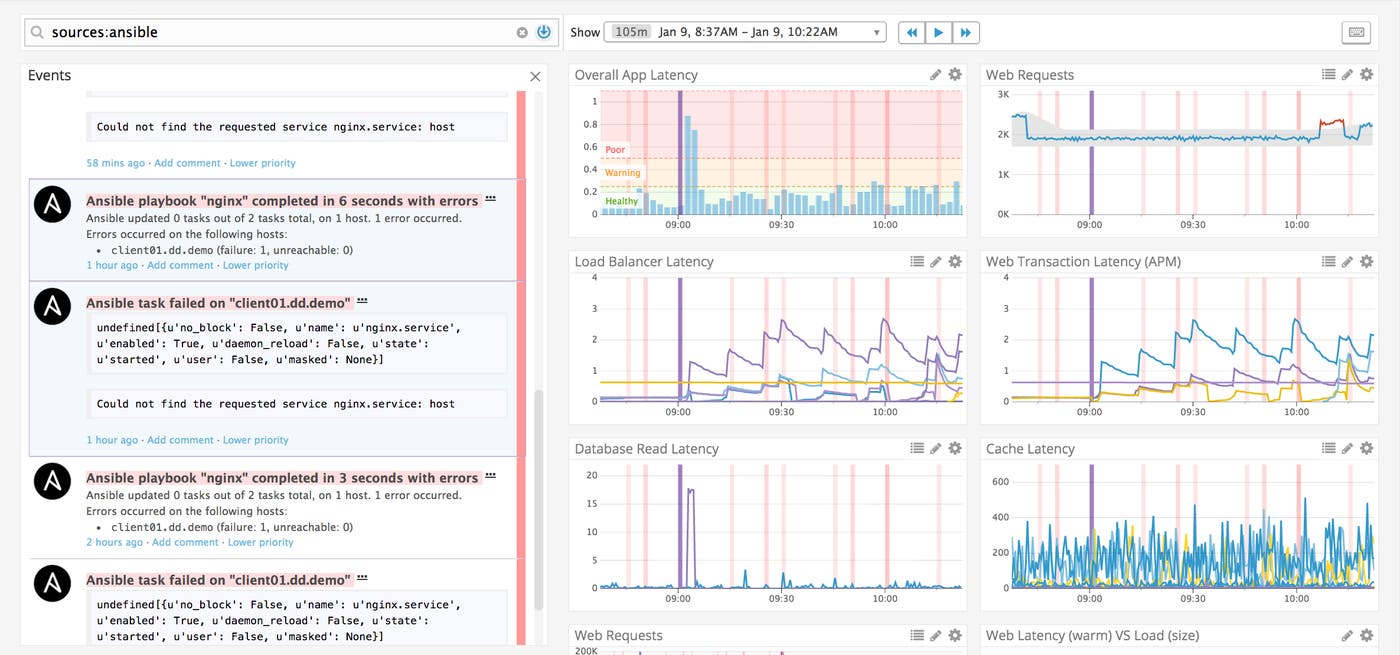
Each vertical red band represents an Ansible push event. In this case, we are hovering over two events (shown in purple on each timeseries graph), which are highlighted in the stream on the left, to investigate if a rise in application latency is correlated with the execution of an Ansible playbook. This functionality greatly reduces time to resolution when investigating an incident.
The playbook in our example repo is just a starting point—you can also create an Ansible playbook that not only installs the Agent but also enables specific Datadog integrations for the applications running on those nodes. Our example repository includes a sample playbook (./playbooks/dd_agent_nginx.yml) that you can modify to enable Datadog’s NGINX integration. To set it up, edit the playbook to match your /nginx_status configuration. (Consult our NGINX documentation for more details.) Then you’re all set to execute the playbook:
ansible-playbook dd_agent_nginx.yml
This will install and configure the Datadog Agent to collect and report NGINX metrics so that you can monitor them in Datadog.
Note that you can call multiple roles from a single Ansible playbook: for example, one role that installs and configures a database on a set of servers, and another that deploys the Datadog Agent on those nodes. You can even create a playbook that uses Datadog’s Ansible role to enable more than one Datadog integration at a time (including for that database you just deployed) by updating the datadog_checks variable with the configuration for each Agent check you want to set up. To see an example, here’s a playbook that sets up three Datadog Agent checks. As with any other infrastructure-wide change, make sure to test each playbook extensively before deploying it in a production environment.
In this guide, we walked through a basic example of using the Datadog Ansible role and callback plugin to deploy the Datadog Agent on a node and to get Ansible reporting in Datadog. The example repo is only designed to demonstrate how Datadog’s Ansible role and callback plugin work in a testing capacity. In order to run it on a larger scale, we recommend installing the Datadog role from the Ansible Galaxy and reading through the documentation. To collect Ansible performance metrics and events, and send them to Datadog, you will also need to install the callback plugin as described here.
If you’re already using Datadog and Ansible, check out our Ansible role and our callback plugin documentation to learn how you can use Ansible and Datadog together to automate your configuration management and your monitoring. If you’re new to Datadog, get started with a 14-day free trial.
此内容由惯性聚合(RSS阅读器)自动聚合整理,仅供阅读参考。 原文来自 — 版权归原作者所有。