




AI teams have invested heavily in evaluation frameworks, yet getting those frameworks beyond local experimentation remains challenging. Teams using open source libraries like DeepEval and Pydantic Evals gain flexibility and research-grounded metrics, but operationalizing those evaluations still requires brittle custom integration code that doesn’t scale. SaaS eval platforms often prioritize convenience, which can come at the cost of flexibility when teams need to port or extend their metric definitions over time. The result is that even mature teams with carefully tuned, task-specific evaluators end up with siloed artifacts: evals that work in a notebook, break in CI, and vanish entirely in production monitoring.
In this post, we explain how Datadog Agent Observability addresses this gap by letting teams run their existing DeepEval evaluations natively within Datadog Agent Observability Experiments. Datadog also supports Pydantic Evals, a code-first evaluation framework that provides its own dataset, evaluator, and LLM-as-a-judge primitives, for teams that prefer it or already use it alongside Pydantic AI. The examples in this post use DeepEval, but the same patterns also apply to Pydantic Evals. Together, these integrations give teams a single place to define, run, and monitor evaluation quality across every stage of development and deployment.
We’ll cover:
Why framework portability matters for LLM evals
How to set up experiments with Datadog Agent Observability
How to connect eval scores to production traces
How to run LLM evaluations continuously on production traffic
Evaluations are an engineering asset, not a platform feature. A team that has built a suite of DeepEval evaluations has accumulated organizational knowledge about what “good” looks like for their application. That knowledge is encoded in the rubrics, thresholds, and human validation behind every G-Eval judge, RAG faithfulness metric, and custom evaluator in the suite. Rewriting those evaluators to conform to a platform’s proprietary metric definitions means discarding that investment rather than simply porting it.
Datadog Agent Observability doesn’t replace the open source eval ecosystem but wraps around it. You define what to measure and how to measure it, using the frameworks you already trust. The platform handles operationalization. It runs those evaluations at scale across hundreds or thousands of examples and tracks results over time to surface regressions. It also monitors token usage and cost across runs, and connects offline eval scores to production traces so you can verify that improvements in your Experiments environment actually translate to better user experiences. The open source scaffolding stays intact. The platform provides infrastructure for continuous eval runs, trace-linked regression visibility, and verification that offline improvements hold in production.
Before running experiments, enable Agent Observability in your Datadog account and install the required libraries. The example below uses ddtrace 4.8 or later and works with any version of DeepEval:
pip install ddtrace deepeval pydantic
Then enable Agent Observability instrumentation in your application:
from ddtrace.llmobs import LLMObs
LLMObs.enable(
ml_app="your-llm-app",
api_key="<YOUR_DD_API_KEY>",
app_key="<YOUR_DD_APP_KEY>",
site="<YOUR_DD_SITE>",
)
A dataset is a collection of inputs and expected outputs. The inputs are passed directly to your task function, whether that is a RAG pipeline, an agent, or any other LLM application, which produces an actual output. The experiment then compares that actual output against the expected output you provide to score each example. All you need to define a dataset are a name, a version, and a list of those input and expected output pairs.
from ddtrace.llmobs import LLMObs
dataset = LLMObs.create_dataset(
dataset_name="rag-customer-support-v1",
description="Example dataset containing customer support examples",
records=[
{
"input_data": {"question": "How do I reset my password?"},
"expected_output": {"answer": "Click 'Forgot Password' on the login page..."},
"metadata": {"difficulty": "easy"}
},
{
"input_data": {"question": "What's your refund policy?"},
"expected_output": {"answer": "We offer 30-day refunds for..."},
"metadata": {"difficulty": "easy"}
},
],
)
Existing DeepEval metrics like G-Eval judges, RAG faithfulness metrics, and custom LLM-as-a-judge implementations can be used without modification.
from deepeval.metrics import GEval
from deepeval.test_case import LLMTestCaseParams
helpfulness_evaluator = GEval(
name="Helpfulness",
criteria="Determine whether the response directly answers the user's question with actionable steps.",
evaluation_steps=[
"Check whether the content of the 'actual output' contradict the content of the 'expected output'",
"You should also heavily penalize omission of detail",
"Vague language, or contradicting OPINIONS, are not OK",
"The user's question should be answered by the 'actual output'"
],
evaluation_params=[LLMTestCaseParams.INPUT, LLMTestCaseParams.ACTUAL_OUTPUT, LLMTestCaseParams.EXPECTED_OUTPUT],
async_mode=True,
)
Setting `async_mode=True` runs evaluations concurrently across the dataset. For a dataset of 100 examples, this can significantly reduce the time evaluations take to run.
The task function takes an input from your dataset and returns an output, which is typically a call to your LLM application or RAG pipeline.
from ddtrace.llmobs import LLMObs
def my_rag_task(input_data):
question = input_data["question"]
response = your_rag_pipeline(question)
return {"answer": response}
experiment = LLMObs.Experiment(
name="rag-customer-support-baseline",
dataset=dataset,
task=my_rag_task,
evaluators=[helpfulness_evaluator]
)
experiment.run()
When experiment.run() is called, Datadog executes the task function across every example in the dataset, runs the DeepEval metrics in parallel, and uploads results to the Experiments UI for analysis.
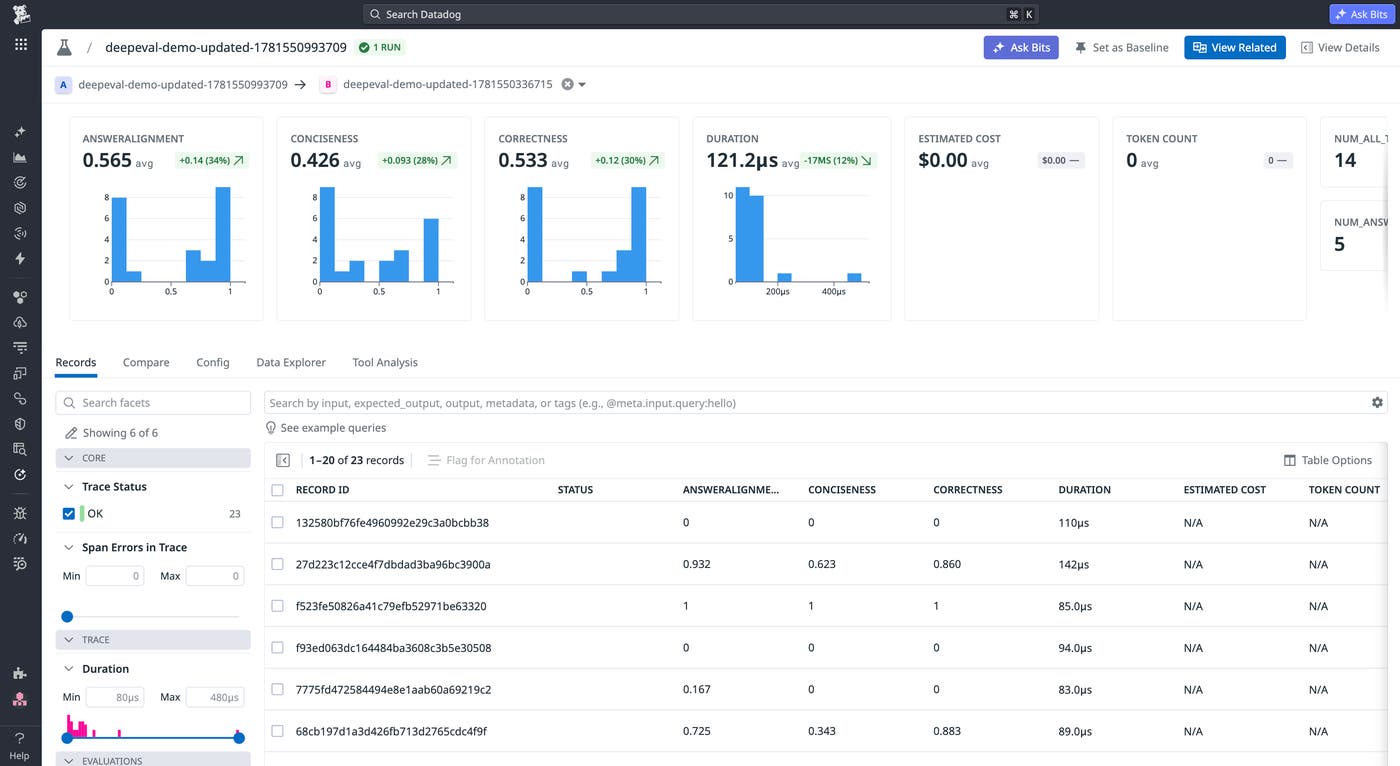
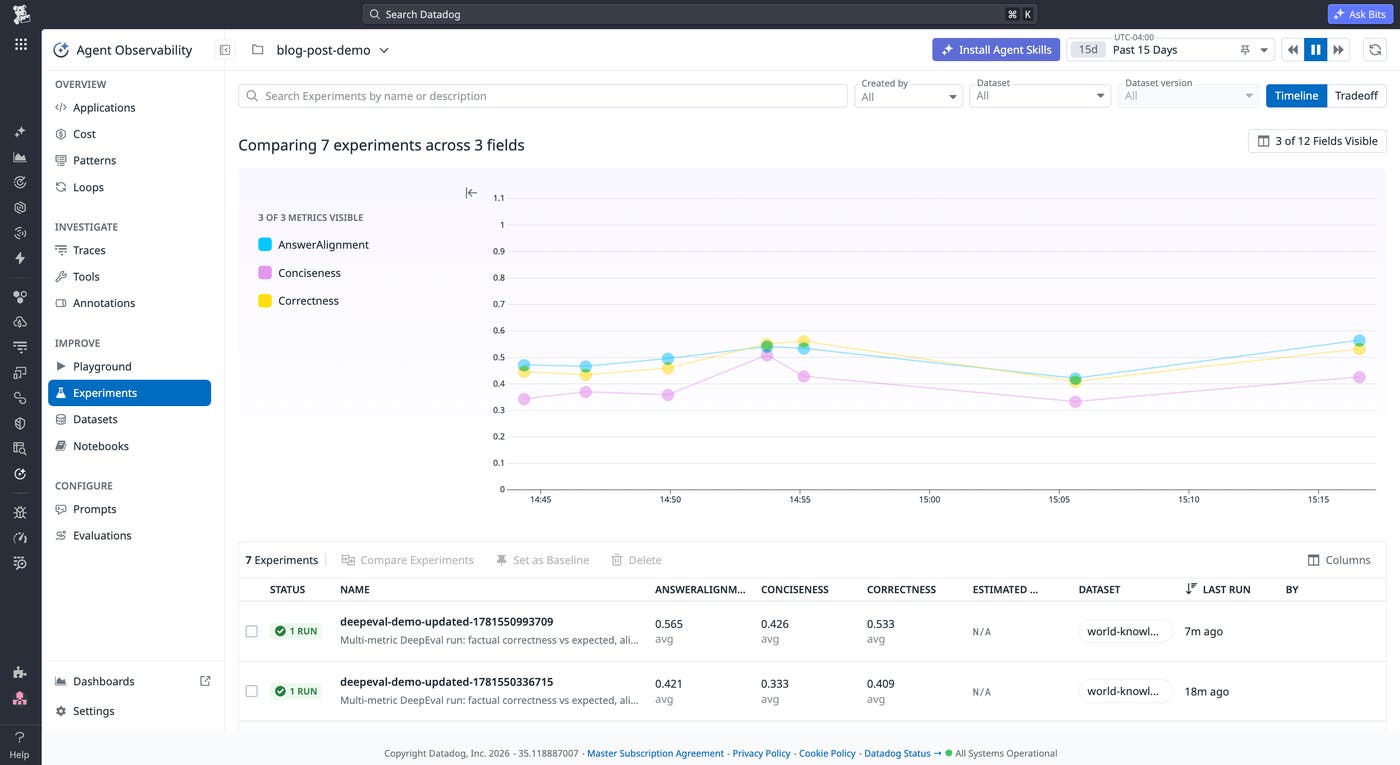
Once an experiment completes, Datadog makes results available in the Datadog Agent Observability Experiments UI. You can select any prior experiment run as a baseline and view side-by-side comparisons of eval scores, latency, token usage, and cost. If switching to a different model improved helpfulness scores by 12% but introduced a 3× latency increase, the same view shows both changes without cross-referencing separate tools.
For any low-scoring example, you can drill into the full trace to see the exact prompt sent to the model, the completion, the eval score, and evaluator reasoning. This visibility reduces the need to reproduce failures locally or reconstruct context from logs after the fact.
Eval scores in isolation have a practical ceiling. A helpfulness score that drops from 0.82 to 0.74 between runs raises questions about what caused the drop. Answering it requires knowing which examples regressed, what changed in the prompt or model output, and whether the issue originated in retrieval or generation. It also requires understanding how the regression correlates with latency or token usage.
Without observability, this means manually correlating data from an eval framework and a separate logging system. Engineers have to copy trace IDs, cross-reference timestamps, and piece together context that should already be connected.
Running DeepEval metrics with Datadog automatically links every eval score to the trace, prompt, and token count that produced it. Regressions are clickable, explorable, and reproducible within the same Datadog platform used to monitor the rest of your application.
Most teams treat evals as a pre-deployment gate where a batch job in CI that produces a pass or fail decision before a change ships. These evals can catch regressions before they reach users, but they do not surface issues that emerge in production as traffic patterns, user inputs, or upstream dependencies change over time.
With Datadog, evals can run continuously on sampled production traffic alongside offline experiment workflows. The same evaluators used during development can score live completions, and the results feed into the same dashboards and alerting infrastructure used for the rest of the application stack. Teams can catch quality regressions as they happen rather than learning about them from user feedback.
Datadog Agent Observability lets teams run DeepEval and Pydantic Evals evaluations natively within Datadog Experiments without needing to rewrite existing evaluators or adopting proprietary metric definitions. By connecting offline eval scores to production traces, teams can catch quality regressions at every stage of development and deployment, not just at the pre-deployment gate. As LLM applications grow more complex, continuous evaluation against live traffic becomes as essential as any other part of the observability stack. To learn more, check out the Agent Observability documentation.
If you don’t have a Datadog account, you can sign up for a 14-day free trial to get started with Agent Observability.
此内容由惯性聚合(RSS阅读器)自动聚合整理,仅供阅读参考。 原文来自 — 版权归原作者所有。