


Emily Chang
SLAs give concrete form to a worthy but amorphous goal: you should always be trying to improve the performance and reliability of your services. Defining and maintaining clear objectives ultimately benefits everyone, from the individuals responsible for building and operating various services, to the users of those services.
In this post we’ll walk through the process of collecting data to define reasonable SLAs, and creating dashboards and alerts to help you monitor and maintain service performance over time.
Before we go any further, let us first unpack what the term SLA means within the context of this article. Throughout this post, we will refer to the terms SLA, SLO, and SLI as they are defined in Site Reliability Engineering, a book written by members of Google’s SRE team. In brief:
SLA: Service Level Agreements are publicly stated or implied contracts with users—either external customers or other groups/teams within your organization. The agreement may also outline the economic repercussions (e.g. service credits) that will occur if the service fails to meet the objectives (SLOs) contained in the agreement.
SLO: Service Level Objectives are objectives that define targeted levels of service, typically measured by one or more Service Level Indicators (SLIs).
SLI: Service Level Indicators are metrics (such as latency, throughput, or error rate) that indicate how well a service is performing.
In the next section, we will explore the process of collecting and analyzing key SLI metrics that will help us set reasonable SLAs and SLOs.
Whether you are interested in defining external or internal SLOs, you should collect as much data as you can, analyze the data to see what standards you’re currently achieving, and set reasonable goals from there. Even if you’re not able to set your own SLOs, gathering historical performance data may help you make an argument for redefining more attainable goals. Generally, there are two types of data you’ll want to collect: performance metrics from user-facing applications (availability/uptime, request latency), and metrics from resources and subcomponents (databases, caches, and other tools) of both internal and user-facing applications.
Synthetic monitoring and APM give you two different perspectives on user-facing application performance. Both are important components of a comprehensive monitoring strategy.
Datadog Synthetics simulates the conditions that users face when they try to access various services (video load time, transaction response time, etc.). Synthetics can help establish a clear idea of what level of performance and availability you should aim to deliver, while accounting for the variance in users’ network conditions and geographical locations. Generating synthetic requests on a regular basis can also be useful for testing the efficiency and availability of services that your users may not access on a regular basis, as well as products that haven’t yet been released to the public, which helps you detect and address issues before they land in front of real users.
An application performance monitoring service like Datadog APM, on the other hand, automatically tracks everything that real users interact with and records SLIs from every subcomponent involved in that interaction. APM allows you to decompose individual requests into the various services, calls, and queries supporting those requests, so you can spot underperforming services or code-level inefficiencies. Once you have a better idea of what is and isn’t performing well, you can prioritize the fixes or improvements that will have the most impact.
In Datadog, Synthetics and APM are fully integrated, so you can preemptively discover issues before real users ever encounter them, and then immediately start troubleshooting them using APM.
Unlike user-facing SLAs, internal SLO violations do not necessarily result in external or economic repercussions. However, internal SLOs still serve an important purpose by establishing expectations between teams within the same organization (such as how long it takes to execute a query that another team’s service depends on). Setting up internal SLOs can also help you gauge whether newly developed services are production-ready.
Datadog APM automatically generates a dashboard with service level indicators (e.g. latency, throughput, and error rates) for each internal service, so you can define objectives that make sense for each subcomponent of your stack.
Whether you’re defining internal SLOs or external SLAs, it’s often not enough to simply look at the average values—you need to look at the entire distribution to gain more accurate insights. This is explained in more detail in Site Reliability Engineering: “Using percentiles for indicators allows you to consider the shape of the distribution and its differing attributes: a high-order percentile, such as the 99th or 99.9th, shows you a plausible worst-case value, while using the 50th percentile (also known as the median) emphasizes the typical case.”
Let’s say that we wanted to define an SLA that contains the following SLO: In any calendar month period, the user-facing API service will return 99 percent of requests in less than 100 milliseconds. To determine if this is a reasonable SLA, we used Datadog APM to track the distribution of API request latency over the past month, as shown in the screenshot below.
In this example, the distribution indicates that 99 percent of requests were completed in under 138 ms over the past month, so it would be difficult to meet the SLA as is. But given that the vast majority of requests are being serviced under 50 ms, you should be able to dive into the exceptionally slow requests and tune them.
In complex environments, it can be difficult to monitor the performance and availability of each internal service, while keeping track of which services act as subcomponents of other services. Datadog APM can help you automatically track the performance of each service (and how they impact other services).
The screenshot above shows a list of all of the services running in a typical production environment. Each service has its own auto-generated dashboard, which displays key SLI metrics (errors, latency, and throughput), as well as a breakdown of the total time spent accessing other services/dependencies. The example below shows the dashboard for a query service that runs on Cassandra, AWS, and Postgres, as well as a number of other internal services.
The dashboard also displays a distribution of latency values for our query service, which can quickly give you an idea of how well that service has been performing in relation to your SLOs; for example, the latency distribution graph shows us that roughly 95 percent of requests in the past week took less than 1.19 seconds. The timeframe is configurable, ranging from the past hour to the past month.
If you only want to focus on Cassandra, you can also click through to a dashboard limited to that service.
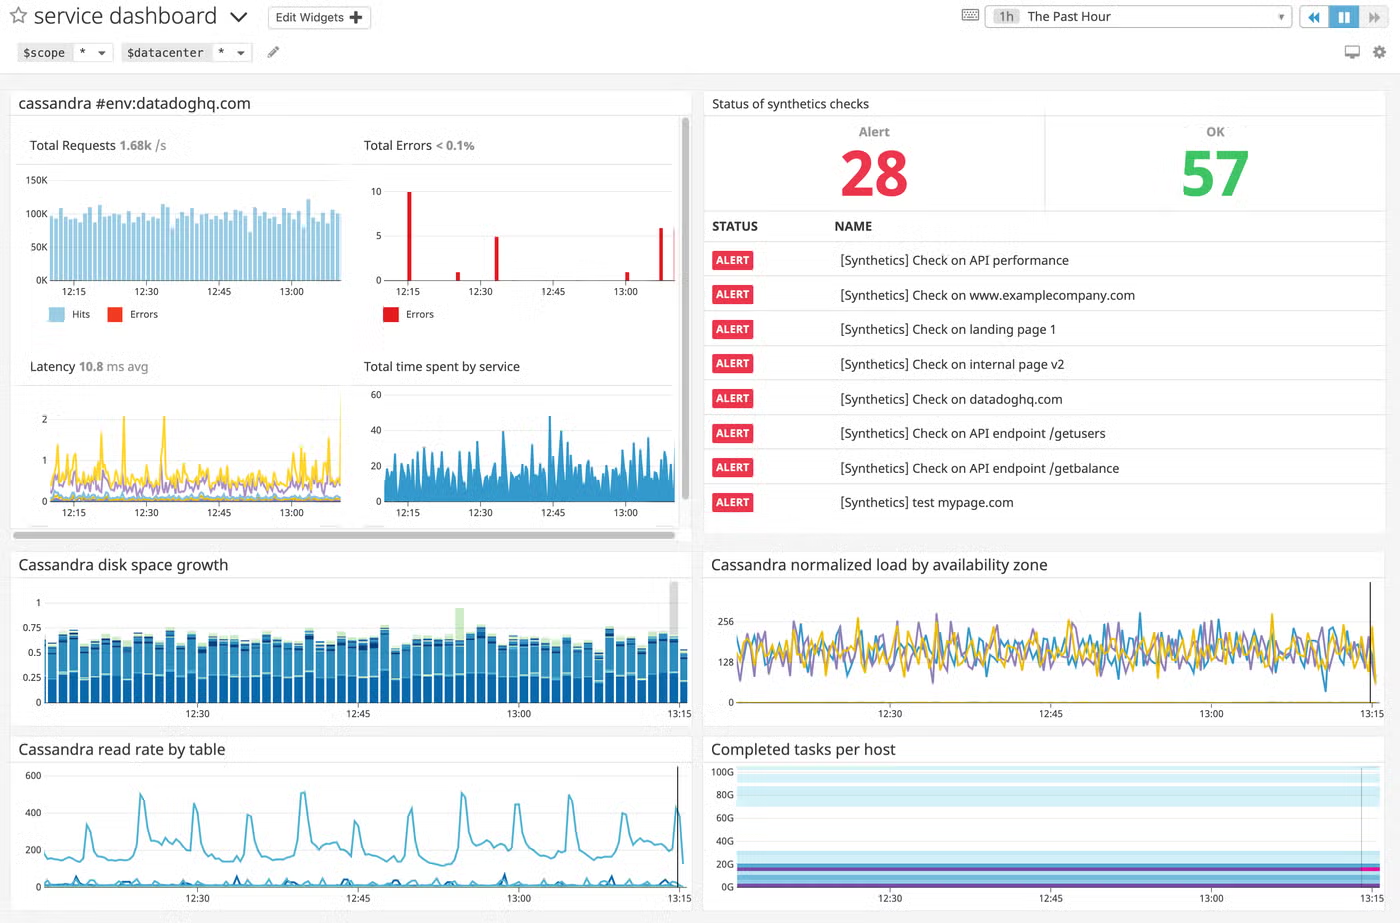
In complex environments, your SLOs often rely on multiple services, so you need to be able to customize your dashboards to view the status of those services at a glance, and also assess the health of each service’s underlying infrastructure-level components.
If you can monitor metrics from your infrastructure, like disk utilization and system load, right alongside service-level performance metrics like latency and error rates, you will be able to spot potential issues quickly. If you see something that warrants further investigation, you can then easily transition to service-level dashboards and trace individual requests in more detail. In Datadog, you can drop a service summary widget, prepopulated with SLI graphs, alongside the other graphs on your customizable dashboards. If you’re using Datadog Synthetics, you can also get a better idea of the user experience by tracking the real-time status of your Synthetics checks in your dashboards.
For many businesses, not meeting their SLAs is almost as serious a problem as downtime. So in addition to creating informative dashboards, you should set up alerts to trigger at increasing levels of severity as metrics approach internal and external SLO thresholds.
Datadog APM dashboards automatically display the recent status of any alerts you’ve set up around service-specific metrics.
To see more details about these alerts, you can click to see which ones have been triggered recently, and investigate from there. If you need to edit or create service-level monitors, you can do so directly from the dashboard.
APM monitors allow you to set alerts on any of the key SLIs (errors, latency percentiles, or hit rate) collected for your service.
Datadog’s monitor uptime widgets can help you track the real-time performance of your SLI-focused monitors over the time periods defined in your SLOs (such as the past week, month, year, or month to date). Adding these widgets to your dashboards allows you to seamlessly communicate the real-time status of your SLOs to team members as well as any external stakeholders. It also makes it easier to see how often your service has met or breached the thresholds defined in your monitors, so you can work to address any areas that have fallen short of expectations.
With APM and infrastructure monitoring, you can trace the path of a request as it hits multiple services within your environment. This makes it easier to investigate the cause of issues as they arise.
The screenshot below, taken from a Datadog APM dashboard, displays an internal application’s median, 99th percentile, and maximum response times over the past month. By graphing these metrics over a substantial window of time, we can identify patterns and trends in behavior, and use this information to assess the ongoing viability of our SLOs. In this example, it looks like the 99th percentile latency has been trending upward over the past few days.
To investigate, we can drag the cursor across the distribution graph to narrow our scope to requests between the 95th and 99th percentile (indicated by the pink area). The list of sampled traces will update to only show requests with latency values that fall in the aforementioned range. This list also displays an overview of the time each request spent executing actions across various services.
If we click to trace the path of one of these slow requests, we can find out which steps took the longest to execute.
It looks like this particular request spent roughly 90 percent of its time executing a Postgres query. The problem may be with the query itself, with an overloaded Postgres server, or even with a low-level system issue. Because Datadog’s APM and infrastructure monitoring are seamlessly integrated, you can investigate all of these scenarios in one place.
Below, we can see that two jumps in reads and writes to disk (and corresponding spikes in query latency) took place around 8 p.m. on two consecutive nights, which indicates that someone may have been running backups and restores of the database. This gives us a solid lead to investigate as we try to track down the potential cause of the slow queries we saw in our APM dashboard.
If we hadn’t noticed anything unusual in our Postgres metrics, we could have turned back to APM to investigate further—perhaps some of the slow queries could be optimized for better performance.
With an infrastructure-aware APM platform, you can investigate bottlenecks throughout every layer of your stack, and determine if the problem is transient, or if you need to implement changes to try to improve the indicators that determine the success of your SLOs.
If you don’t have a monitoring platform in place, start there. After that you’ll be ready to set up dashboards and alerts that reflect your SLAs and the key resources and services that the SLA depends on.
If you’re a Datadog user, here are some things you can do to get the ball rolling quickly:
If you’re not yet a Datadog customer, sign up for a 14-day full-featured free trial today.
Note: A modified version of this post was published on SysAdvent in December 2016.
此内容由惯性聚合(RSS阅读器)自动聚合整理,仅供阅读参考。 原文来自 — 版权归原作者所有。