


Ansible is an automation tool for provisioning, managing, and deploying infrastructure and applications. When building large-scale applications, Ansible enables users to manage and configure their infrastructure across platforms like AWS. Whether you rely on temporary or dedicated hosts, you can use Ansible to create a repeatable process for configuring them with the Datadog Agent. This process is especially useful if you need to monitor a dynamic inventory of resources (e.g., tagged EC2 instances) because Ansible can automatically manage these ephemeral resources.
In this post, you’ll learn how to:
install the Datadog Agent Ansible role
create a dynamic inventory of AWS EC2 instances in a single region
create an Ansible playbook that automatically deploys the Agent to the dynamic inventory
monitor your Ansible-managed instances with Datadog
With Ansible, you can consistently deploy and configure the Datadog Agent across your instances so you can monitor them in Datadog.
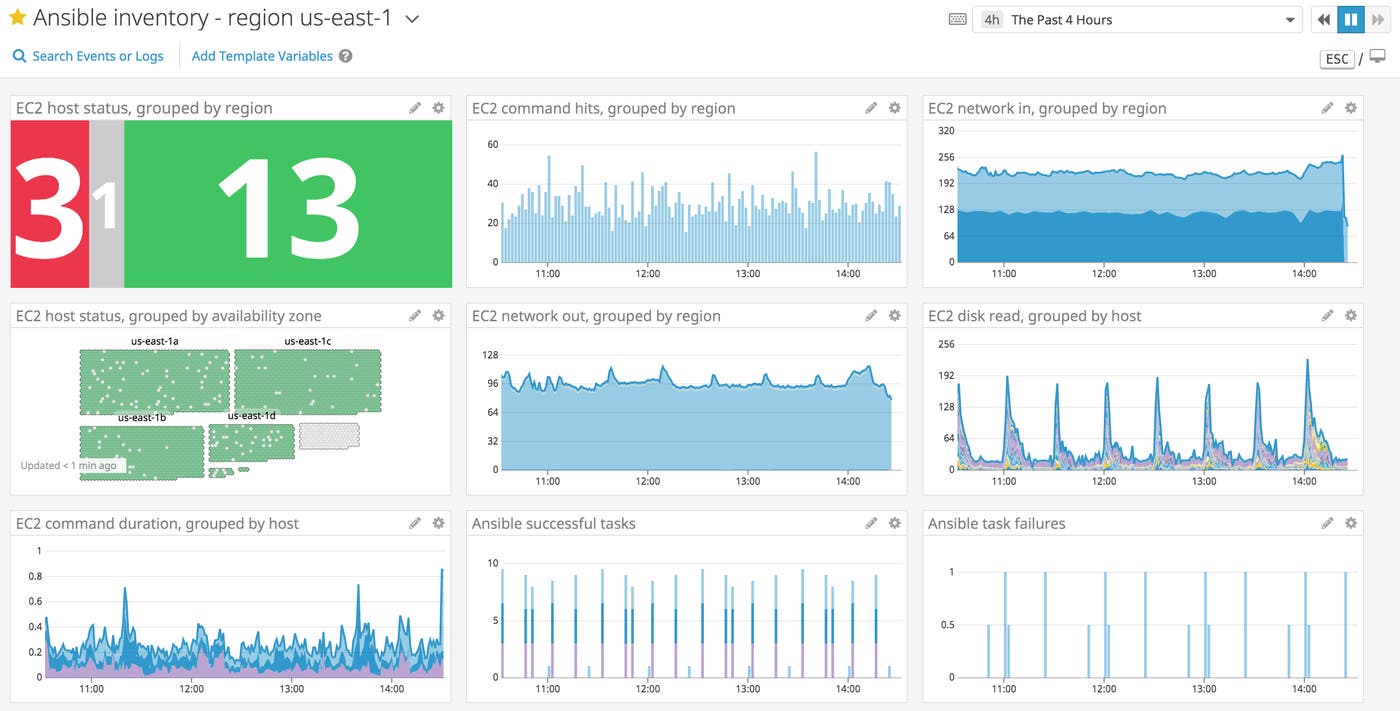
Though we focus on AWS EC2 in this guide, you can also create inventories for other platforms such as Kubernetes, Azure, and GCP. The following sample configurations serve as starting points for setting up EC2 instances with Ansible. For production-ready configurations, you can use Ansible vault with your playbooks to manage and secure all of your keys.
Ansible manages instances through playbooks and inventories. Inventory files list all hosts or groups of hosts that are available in your infrastructure. Ansible playbooks are configuration management files used to execute the steps needed to create those new instances. Playbooks are designed to be idempotent, meaning that regardless of whether you run playbooks on your instances once or multiple times, your servers always end up in the same desired state. With these configurations, you can install the Datadog Agent in order to monitor all of the hosts (e.g., EC2 instances) that make up your application’s infrastructure.
There are a few prerequisites for getting started:
an AWS IAM user with access and secret key pairs and (at least) the AmazonEC2FullAccess permission policy to interact with the AWS API
an up-to-date version (2.8 at the time of this publication) of Ansible on your host machine, where you will create the playbook and inventory file and configure the Datadog Agent
the ability to SSH into the EC2 instances you want to manage and monitor with Ansible and Datadog
You can verify your Ansible installation by checking that you have a default ansible.cfg configuration file on your host—typically located in the /etc/ansible/ directory on Linux hosts. Alternatively, you can copy the default configuration file and add it to the same directory. With Ansible installed, you can use it to download the Datadog Agent onto your host as an Ansible role. This enables you to easily install the Agent on all of your instances and automatically monitor your Ansible deployments.
You can use Ansible roles in playbooks to automatically execute the configurations needed to set up your instances. Datadog provides an Ansible role that playbooks can use to easily install the Agent on your EC2 instances. To install the role, run the following command on your host machine:
ansible-galaxy install Datadog.datadog
This will install the necessary role files in .ansible/roles of your home directory. Once installed, you can add the Datadog Agent role to your playbook and automatically install the Agent on all matching instances pulled from your dynamic inventory.
Inventory files can either be static or dynamic. A static inventory file is an INI- or YAML- formatted list of hosts, groups, and variables, while a dynamic inventory file may simply list a region (e.g., us-east-2) to pull hosts from. A dynamic inventory will query the AWS API to get the most up-to-date list of virtual machines every time you run the playbook, which is particularly useful for environments that automatically scale up and down to reflect real-time traffic. Though we are focusing on dynamic inventory in this guide, you can read more about configuring static inventory in the Ansible documentation.
By default, the Ansible binary looks for an inventory file called hosts, located in the /etc/ansible directory. This file can also be created as a subdirectory, so that you can store multiple inventory files for Ansible to concatenate into a full inventory. This gives you the flexibility to create multiple dynamic or static files for your environment.
You can also create new subdirectories in your inventory location group and categorize your configuration files (e.g., server type, region, environment). If you need to specify which inventory to use, you can override where Ansible looks for the default inventory via the command line or by editing your Ansible configuration file.
In the /etc/ansible/hosts/ directory, create a new dynamic inventory file. You can name the file anything you would like, but it does need to end with aws_ec2.yaml in order for it to be associated with the AWS dynamic inventory plugin:
plugin: aws_ec2
regions:
- YOUR_REGION
- YOUR_REGION
keyed_groups:
# Add hosts to tag_Name_Value groups for each Name/Value tag pair
- prefix: tag
key: tags
aws_access_key_id: YOUR_ACCESS_KEY
aws_secret_access_key: YOUR_SECRET_KEY
The sample configuration above uses Ansible’s built-in AWS EC2 inventory plugin and includes a few basic parameters for connecting to the AWS API. Make sure to replace the regions, aws_access_key_id, and aws_secret_access_key parameter values with your AWS region(s) (e.g., us-east-2) and keys. Ansible will use this inventory file to pull all available hosts in the region(s) you specify, apply any filtering options, and automatically group them by their tags based on the keyed_groups parameter.
You can create an Ansible playbook that utilizes your dynamic inventory and Datadog Agent role. Playbooks can be stored and organized anywhere you would like on your Ansible host, but Ansible also provides some best practices for organizing complex projects with multiple playbooks and inventories.
Create a new datadog_playbook.yaml file and include the following configuration:
- name: Install Datadog Agent on servers in AWS
hosts: tag_datadog_yes
become: yes
user: centos #Use the default login for the AWS image. Here we are using a Centos image.
roles:
- { role: Datadog.datadog, become: yes }
vars:
datadog_api_key: YOUR_API_KEY
datadog_config:
tags:
- env:dev
logs_enabled: true
process_config:
enabled: "true"
The name parameter describes the playbook’s function; you can customize it however you like. Let’s walk through each section of this playbook.
The hosts parameter determines where Ansible will install the Datadog Agent. This example snippet instructs Ansible to install the Agent on any EC2 resource tagged with datadog:yes in Amazon’s EC2 console. You can replace datadog_yes with any <KEY>_<VALUE> pair that applies to your EC2 hosts.
become: yes
user: centos #Use the default login for the AWS image. Here we are using a Centos image.
roles:
- { role: Datadog.datadog, become: yes }
The snippet above instructs Ansible to log in to your EC2 instance(s) as the centos user and elevate to “sudo” privileges (required for package installs and service reboots) with become: yes. Make sure to modify the user value to match the default user for your EC2 instance’s AMI. The roles parameter instructs Ansible to use the Datadog Agent role we installed earlier, which will install the Agent on your hosts.
datadog_api_key: YOUR_API_KEY
As seen in the example above, you will need to include your Datadog API key, which you can find in your account’s API settings.
datadog_config:
tags:
- env:dev
logs_enabled: true
process_config:
enabled: "true"
Finally, the datadog_config section specifies how to configure the Datadog Agent after it gets installed on each of your EC2 instances. With this example configuration, Ansible will apply a global env:dev tag to your Datadog configuration, enable log collection, and enable the Process Agent for each available instance pulled from your dynamic inventory. You can add any global tags (e.g., role, env, team) to your configuration to help you easily search for your EC2 hosts in Datadog.
You can also configure other Datadog integrations on your EC2 instances with the datadog_checks variable, giving you a seamless installation process for your resources.
Now that you’ve configured your dynamic inventory and playbook, you should test the inventory configuration by running the ansible-inventory command on your Ansible host:
ansible-inventory --graph
This command queries all of the known inventory files and outputs a formatted graph of your inventory. If the configuration is correct, you will see a list of available EC2 hosts, grouped by your tags:
@all:
|--@tag_datadog_yes:
| |-- c2-12-345-678-901.compute-1.amazonaws.com
| |-- c3-98-765-432-101.compute-1.amazonaws.com
| |-- c2-23-123-435-432.compute-1.amazonaws.com
In the example above, Ansible automatically pulled an EC2 instance that matched the tagging group (datadog:yes) and the region defined in the dynamic inventory configured earlier (us-east-2). With the inventory correctly reporting, you can now run the playbook with the ansible-playbook command on your Ansible host:
ansible-playbook datadog_playbook.yaml
This command will instruct Ansible to install and automatically configure the Datadog Agent on all of the EC2 instances pulled from the sample_aws_ec2.yaml dynamic inventory file you created earlier.
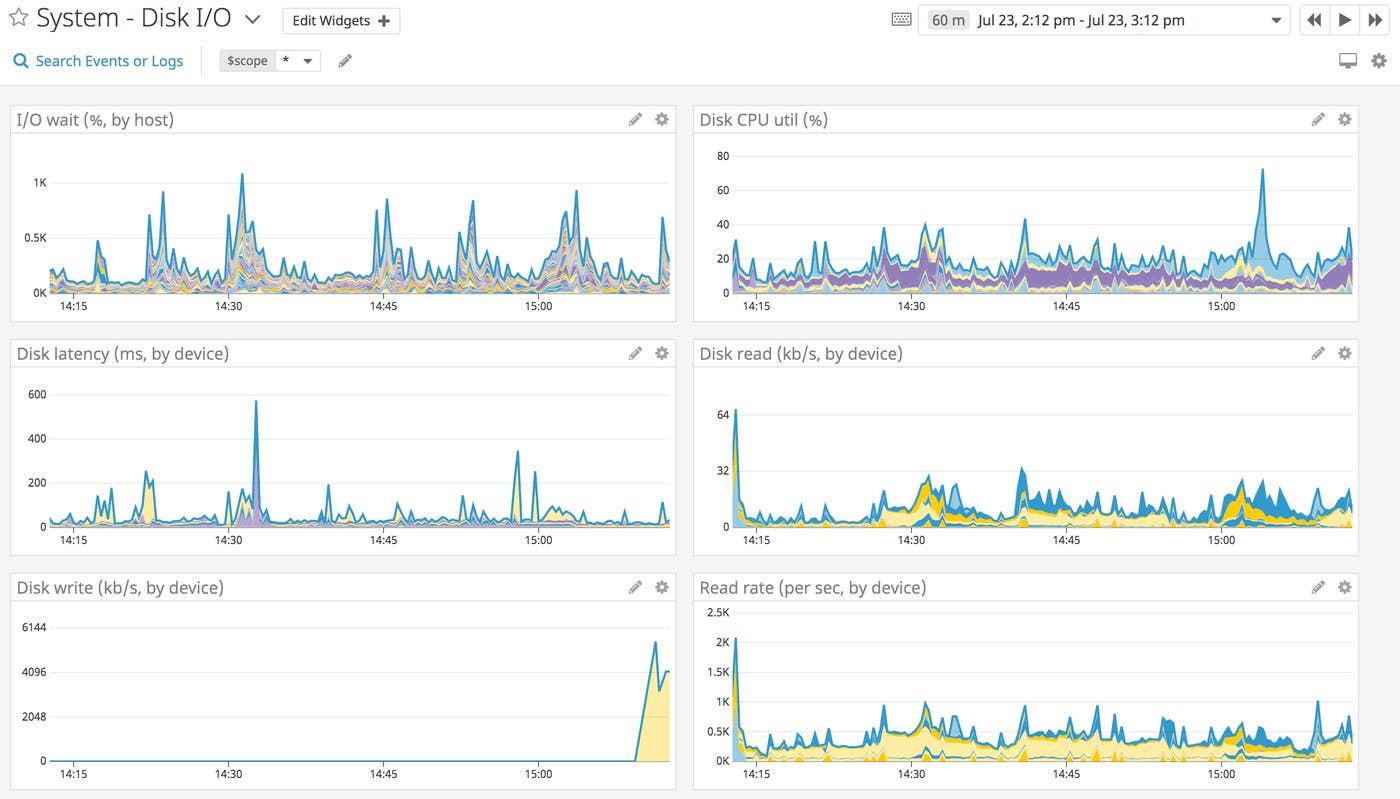
By installing the Agent on your hosts, you can immediately begin monitoring system-level metrics with Datadog’s built-in host dashboards and configure one of Datadog’s 1,000 integrations.
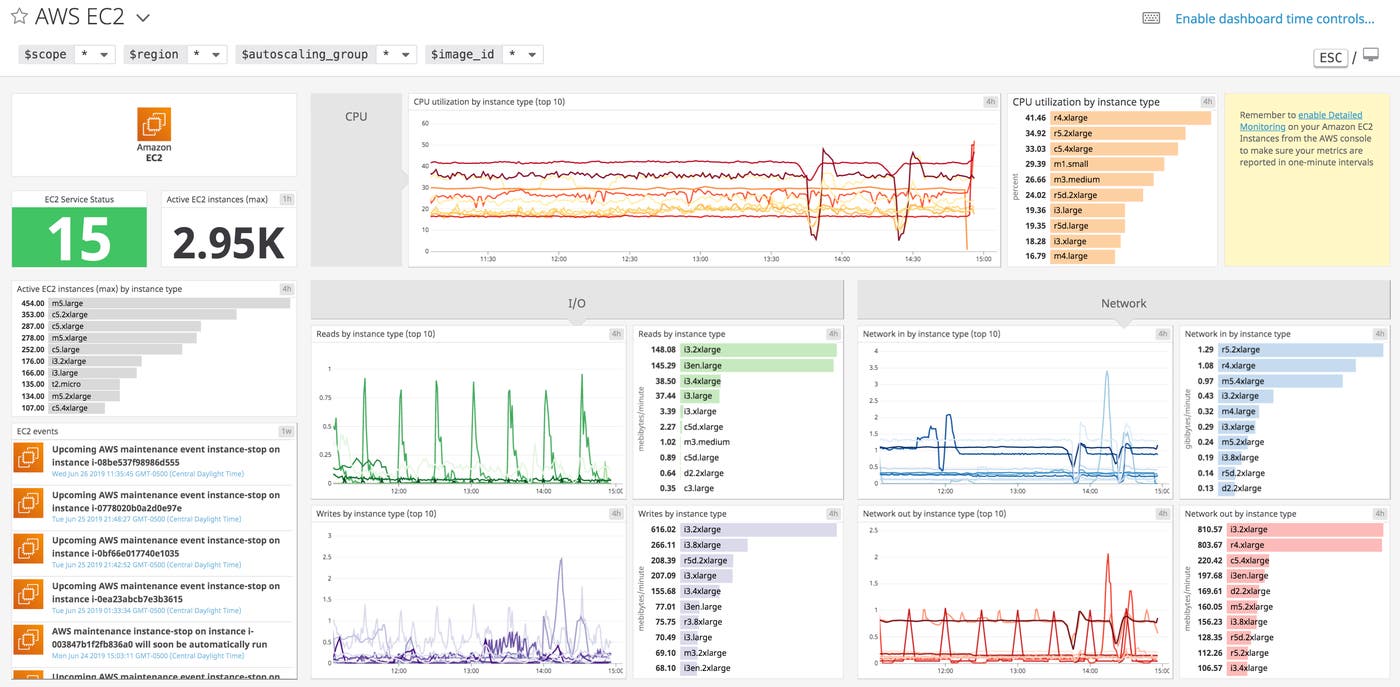
If you’ve enabled the AWS integration, you’ll also be able to monitor CloudWatch-based EC2 metrics with Datadog’s out-of-the-box integration dashboard.
You can also monitor your Ansible deployments with Datadog’s callback plugin, which enables you to get real-time reports on Ansible runs and quickly identify failed deployments.
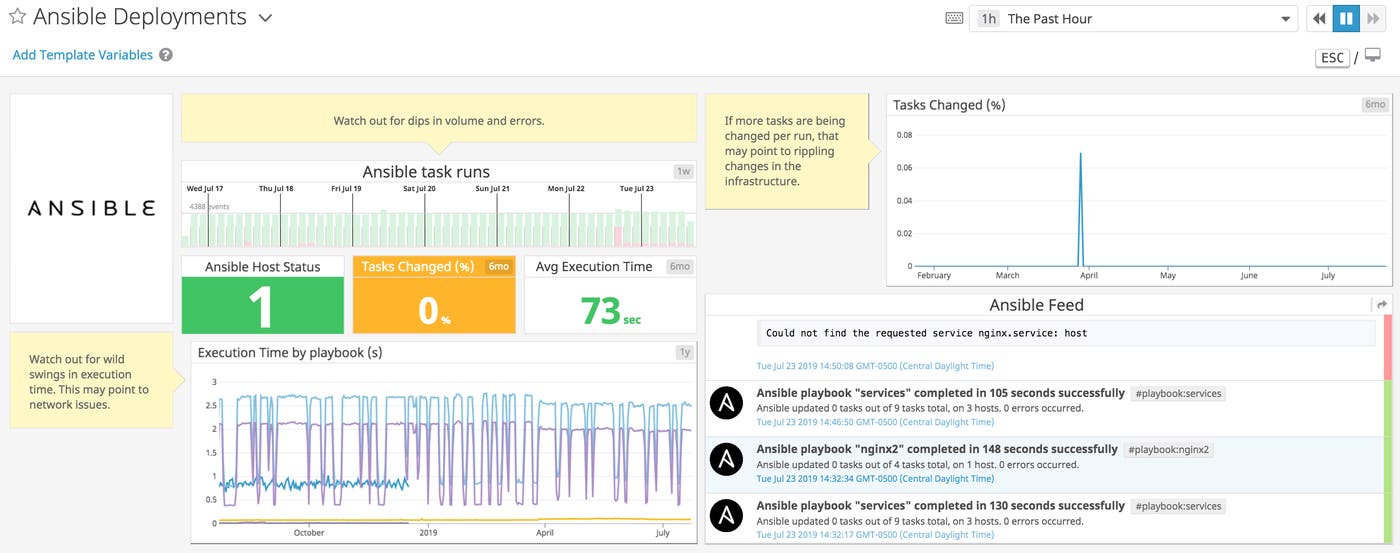
Check out our documentation for more information about setting up Datadog’s Ansible integration. Once configured, the Agent will automatically forward Ansible data to your Datadog account so you can immediately see the status of all of your deployments.
Ansible enables you to create a repeatable process for installing and configuring the Datadog Agent on your dynamic inventories (e.g., groups of EC2 instances), so you can quickly monitor new resources with Datadog. If you are already using Datadog, you can start using Ansible to automatically configure the Datadog Agent to monitor any services running on the hosts in your dynamic inventories. If you’re new to Datadog, sign up for a 14-day free trial to start monitoring your Ansible deployments and EC2 instances.
此内容由惯性聚合(RSS阅读器)自动聚合整理,仅供阅读参考。 原文来自 — 版权归原作者所有。