


Kaushik Akula

Jesse Mack
Organizations often adjust their logging strategy to meet their changing observability needs for use cases such as security, auditing, log management, and long-term storage. This process involves trialing and eventually migrating to new solutions without disrupting existing workflows.
However, configuring and maintaining multiple log pipelines can be complex. Enabling new solutions across your infrastructure and migrating everyone to a shared platform requires significant time and engineering effort. The cost and complexity of trialing and onboarding new solutions sometimes prevents teams from adopting the best solutions altogether—a situation referred to as vendor lock-in.
Datadog Observability Pipelines helps address this issue by allowing you to aggregate, process, and route your logs to multiple destinations for all your use cases. In this post, we’ll show you how Observability Pipelines helps you send the same logging data to two destinations to meet your business’s wide-ranging log management, security, and storage needs.
Organizations often use multiple logging destinations to address varying use cases across teams, including security, business analytics, and long-term storage in data lakes or warehouses for auditing and compliance.
For example, say your development and operations teams use Datadog Application Performance Monitoring (APM), and they want Datadog Log Management to correlate trace data with the relevant logs for complete context. Meanwhile, your security team is currently using a different SIEM vendor to analyze the same logs for security incidents. Sending the same logs to two different vendors can have a high operational and financial burden, as you need to manage multiple destination-specific forwarders, log collection agents, and third-party integrations.
With Datadog Observability Pipelines, routing your log data to an additional destination is as quick as configuring your source, choosing your two destinations, and deploying your pipeline via the Datadog UI. You can also configure your pipeline to pre-process your logging data with additional filters, sampling, quotas, field editing, deduplication, and sensitive data redaction before shipping.
If your team is considering switching log management vendors, you’ll want to evaluate new solutions before your current license is up. For example, say you want to trial Datadog Log Management while also supporting your existing log management vendor. You’ll need to send logs to both solutions to not disrupt existing workflows. But deploying multiple forwarders can be complex and resource-intensive, creating a burden on the teams and infrastructure supporting your most crucial services.
With Observability Pipelines, instead of removing and installing new agents or collectors, you can deploy Datadog’s Observability Pipelines Worker as a standalone service to aggregate logs coming in from your sources. Then, you can add any filters, enrichment, or transformations to your logs prior to routing them to both your existing destination and your new Datadog account.
Once your pipeline is live, metrics on the volume of your logging traffic, pipeline health, and throughput will also begin to populate in Observability Pipelines.
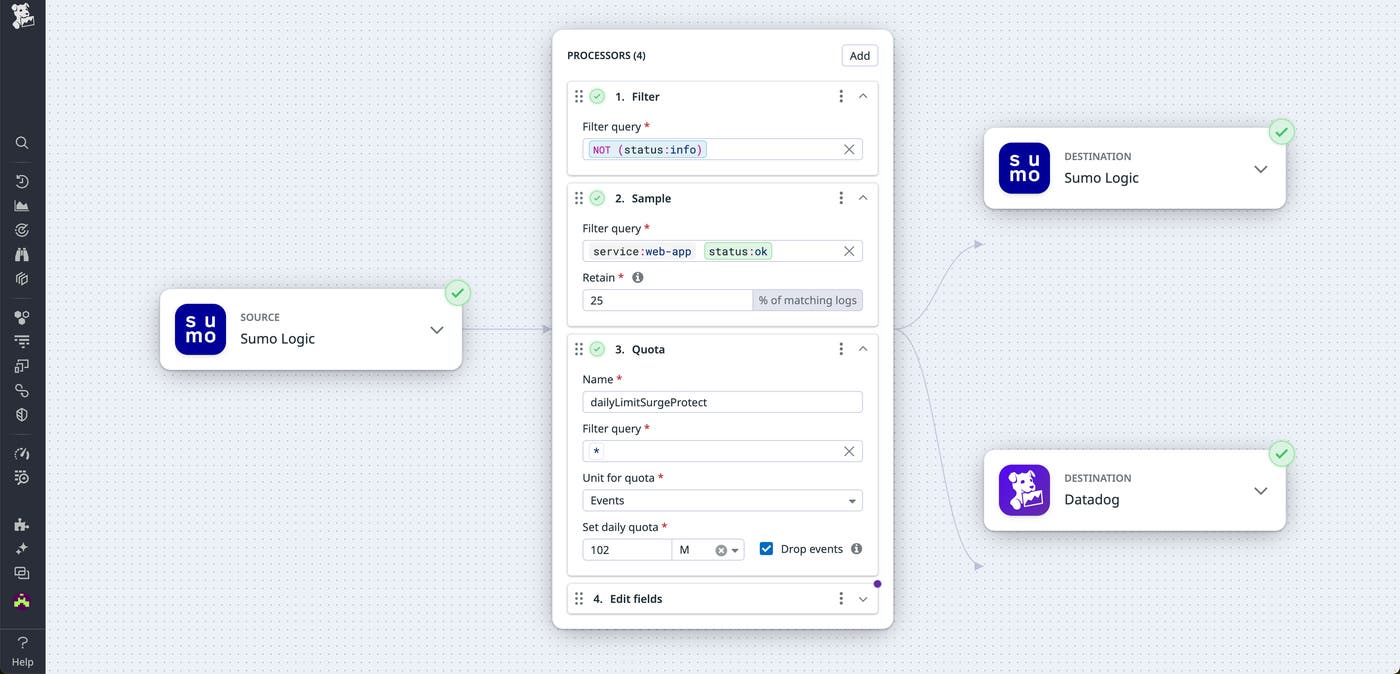
Datadog’s Observability Pipelines enables teams to quickly send the same logging data to two destinations in a few simple clicks, without excessive configuration. It also simplifies the process of trialing logging destinations, so you can find the one that best fits your business needs while minimizing operational disruption.
Observability Pipelines is available to all Datadog customers. If you’re already a customer, you can get started using our Observability Pipelines quickstart templates for dual shipping your logs. Or, if you’re not yet a Datadog customer, you can sign up for a 14-day free trial today.
此内容由惯性聚合(RSS阅读器)自动聚合整理,仅供阅读参考。 原文来自 — 版权归原作者所有。