






The proliferation of managed LLM services like OpenAI, Amazon Bedrock, and Anthropic have introduced a wealth of possibilities for generative AI applications. Application engineers are increasingly creating chain-based architectures and using prompt engineering techniques to build LLM applications for their specific use cases.
However, introducing non-deterministic LLM services into your application can increase the need for comprehensive observability, and debugging LLM chains can be challenging. Often, teams are forced to capture each chain execution step as a log for each prompt request and piece that context together manually to determine the root cause of an unexpected behavior. These logs can be cumbersome to collect, process, and store, making this approach not only time-consuming but also costly.
By tracing your LLM chains, you can examine each step across the full chain execution to more quickly spot errors and latency and troubleshoot issues. In this post, we’ll discuss how chains and their components fit into an LLM application architecture, walk through the main goals and challenges of LLM chain tracing, and show how you can use Datadog LLM Observability to instrument your chains for debugging and performance analysis.
Chains are essential for integrating LLMs into your application workflows. They help in structuring the interaction between the LLM and other components of the application, ensuring that the model’s outputs are effectively utilized and any limitations of the model are mitigated. Although LLMs naturally excel at many language processing tasks, they include a few significant limitations, such as:
Limited or outdated knowledge due to stale and/or incomplete training data
Limited ability to execute tasks not related to text generation, such as image processing, complex mathematical calculations, etc.
Limited ability to execute tasks that require specific domain knowledge or real-time data processing
Difficulty maintaining long-term context or understanding complex, multi-step reasoning processes
Chains extend LLM functionality to overcome these limitations. They combine LLM interfaces with tools that enable the application to add context to prompts or take actions. For example, chain tools might be used to retrieve prompt-enriching information from private data stores or external API resources. They might also be used for data processing, structuring the prompt, or stringing together supplemental prompts (to classify the question type, for example).
A chain can be implemented as a static pipeline that runs tools and LLM requests in response to the input, or as a dynamic sequence of tools that is selected contextually by an agent. Agents consist of a core that defines (in the form of an LLM prompt) the application’s goals, the tools the agent has access to and how it can use them, and relevant context logged from previous sessions; memory that stores that context; and a planning module that breaks down the input prompt in order to choose the task execution pipeline.
Chain tools perform myriad actions, such as:
Data preprocessing—normalizing, stemming, and cleaning input text; tokenizing the prompt into multiple units; etc.
Feature extraction—extracting named entities and keywords for further processing via semantic analysis
Retrieval—searching a database (internal or external) for RAG
Response post-processing, such as ranking multiple responses to choose the best one, localizing the response with respect to language or other attributes, or filtering out PII and expletives
Each of these steps is taken to help the application produce a more context-aware and accurate response to the initial prompt by using multiple LLM calls. For example, a chain might initially use an LLM call to classify the question before choosing further steps. In the case of a customer support app, these question categories could include refunds, shipping, pricing, or product information. The following diagram illustrates how a simple chain might function within a typical LLM application workflow:
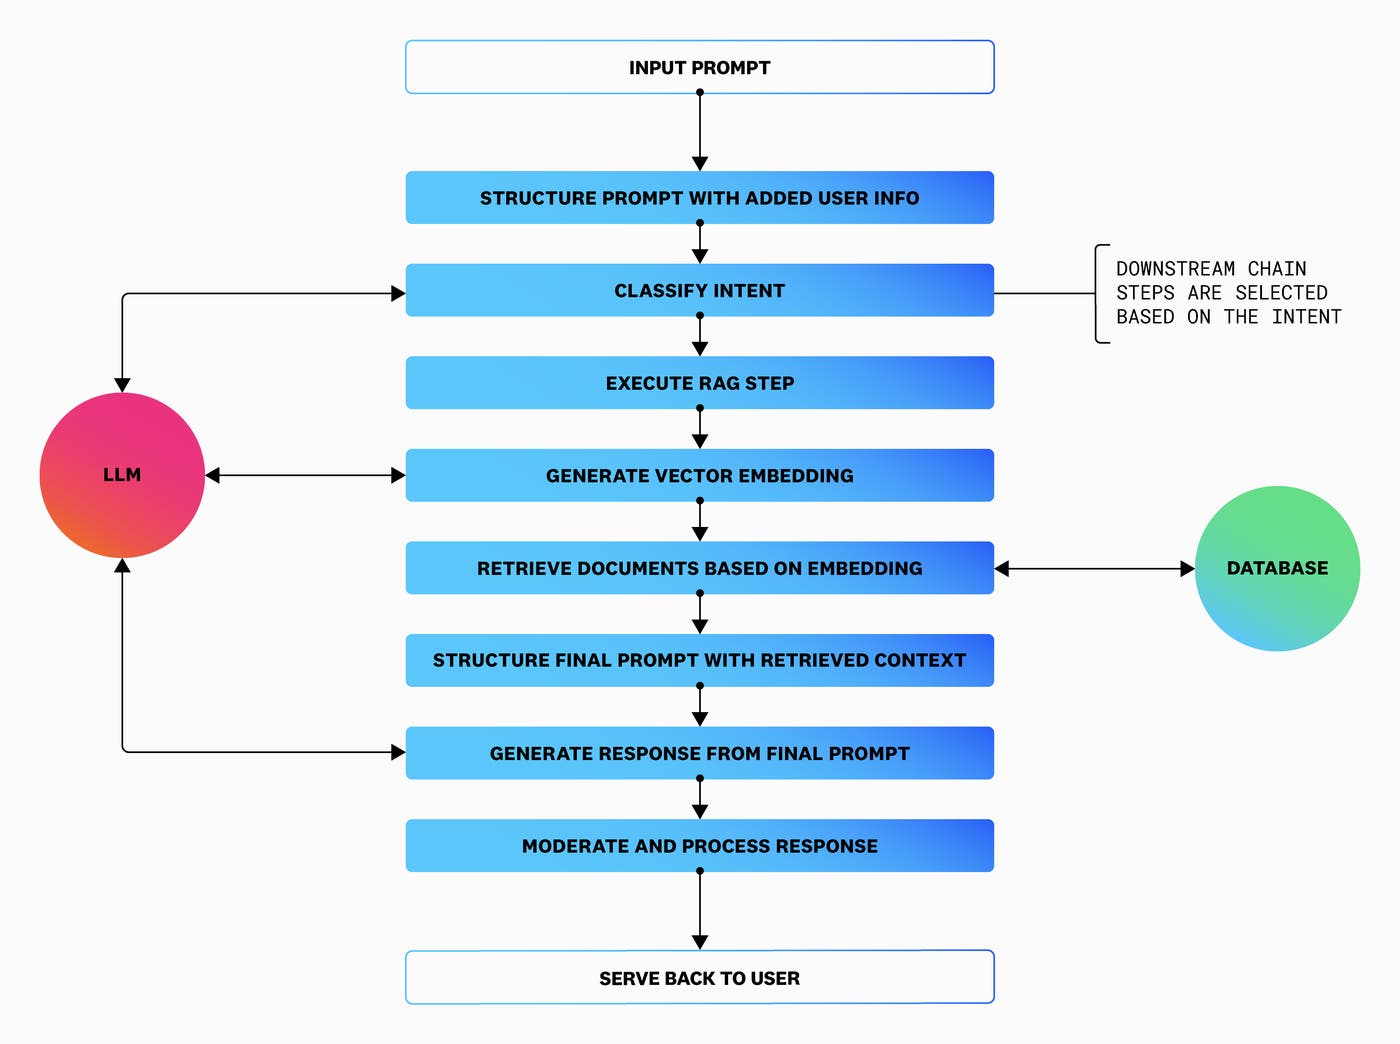
By introducing complex (and potentially dynamic) task pipelines into your LLM prompting workflow, chains present a pressing need for granular monitoring and instrumentation. Without a complete end-to-end trace of the chain execution, you might struggle to piece together the root cause of issues, and be forced to use complex logs that are difficult to parse. You need visibility into the input and output of each chain step to determine if the right tool was selected or if a response was poor due to the unavailability of a tool.
You can use chain traces to accomplish the following monitoring goals:
Tracking code and request errors
Pinpointing the execution step or function call at the root cause of an unexpected response
Identifying hallucinations or improperly structured input for downstream prompts
Identifying latency bottlenecks not only at the request level, but also down to each chain task execution
Tracking token consumption for each LLM call in your chain to help manage LLM provider costs
Instrumenting LLM chains presents several unique considerations. Chain components, which may include LLM interfaces, data processing tools, workflow managers, and in some cases, agents, often require different approaches for instrumentation. Establishing a span hierarchy makes it easier to map out different sequences within chain executions, as well as query for patterns in errors and latency that may be occuring with a certain tool or workflow. And to facilitate better debugging with your traces, each of these span types needs to be annotated with inputs, outputs, and metadata. For example, in an LLM call, you might want to annotate the span with prompt and response content alongside parameters and context like the temperature, token limit, and infrastructure tags.
Next, we’ll talk about the best way to instrument your LLM chains for monitoring with Datadog LLM Observability.
With Datadog LLM Observability, you can instrument your chains by using either the Python SDK or the LLM Observability API. In this example, we’ll use the SDK, which extends ddtrace, Datadog APM’s client library. Let’s say we are setting up tracing for an ecommerce app’s customer support chatbot, which is a service called shopist-chat. This service implements an LLM agent that uses OpenAI prompts to answer customer support questions with the following steps:
A plan workflow that submits an intent classification prompt to GPT-4, and outputs one of four possible intents along with an explanation
An execute workflow that collects user information and triggers a corresponding sub-workflow to form and execute a second GPT-4 prompt with RAG
A final moderate step that validates the final response before returning the answer to the user
To ensure that our instrumentation is complete and efficient, we’ll first declare our span hierarchy, mapping each component of the shopist-chat agent to a span type. Then, we’ll iteratively add instrumentation code to our service for each span type. We’ll move upwards through the hierarchy—starting at the bottom, with the LLM requests and chain tools, continuing with embedding and retrieval spans, and finishing with task, workflow, and agent spans.
LLM Observability’s Python SDK enables you to create trace spans within your code by adding decorators to the relevant functions. LLM Observability also features auto-instrumentation for OpenAI, Anthropic, and Amazon Bedrock LLM calls, so you don’t have to worry about annotating these parts of your code. The following code snippet shows how we can trace shopist-chat’s intent classification prompt as an LLM span.
from ddtrace.llmobs.decorators import llm
@llm(model_provider=”geminiopenai”)
def classify_intent(user_prompt):
completion = ... # user application logic to invoke LLM
return completion
As we move up the span hierarchy to add spans for all the different workflows in our chain and their sub-components, the SDK will automatically nest the child spans that execute before the completion of their outer parent spans. The following code demonstrates how this enables us to nest the classify_intent() function as an LLM span inside of an outer workflow span that represents the plan workflow.
from ddtrace.llmobs.decorators import task, workflow
@workflow
def plan(user_prompt):
classify_intent(user_prompt)
... # additional logic to compose the final intent and explanation message
return
As we continue this process, we’ll also want to add metadata and context to our spans to help with debugging and analysis, as we discussed in the previous section. The LLM Observability SDK lets us add parameters, to our spans, containing specific details for each span type. The following example shows how we can both add parameters to a decorator and also use the SDK’s LLMObs.annotate() function to create metadata for our spans.
from ddtrace.llmobs import LLMObs
from ddtrace.llmobs.decorators import workflow
@workflow
def plan(user_prompt):
response = llm_call_inline(prompt) # llm call here
LLMObs.annotate(
span=None,
input_data="prompt",
output_data="output",
tags={"host": "host_name"},
)
return response
Now that we’ve configured our application to send traces from shopist-chat to Datadog, we can use Datadog LLM Observability to monitor them from a central view. The following screenshot shows a full trace for a request from the shopist-chat agent.
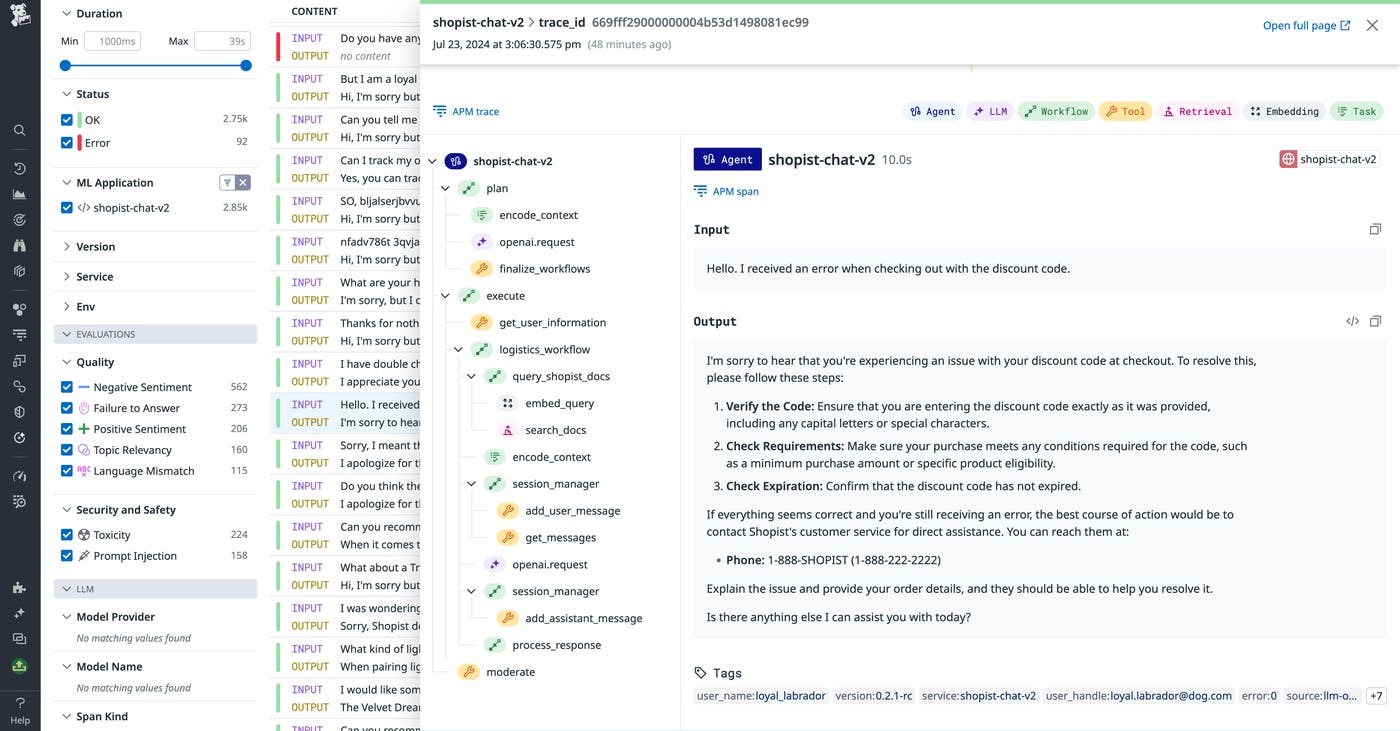
By instrumenting your LLM chains, you can trace each execution step to more quickly identify sources of errors and latency and understand the logic behind prompt responses. LLM chain observability helps your AI engineers and application teams ensure their chains are reliable and performant.
Datadog LLM Observability’s included SDK and monitoring tools make it easy to set up your LLM chain instrumentation and monitor incoming requests within Datadog’s unified app. See the notebook for a hands-on guide to help you get started with tracing your LLM apps. For more information about LLM Observability, see our announcement blog and documentation.
If you’re brand new to Datadog, sign up for a free trial.
此内容由惯性聚合(RSS阅读器)自动聚合整理,仅供阅读参考。 原文来自 — 版权归原作者所有。