


This post is part 2 of a 3-part series on monitoring MySQL on Amazon RDS. Part 1 explores the key performance metrics of RDS and MySQL, and Part 3 describes how you can use Datadog to get a full view of your MySQL instance.
As covered in Part 1 of this series, MySQL on RDS users can access RDS metrics via Amazon CloudWatch and native MySQL metrics from the database instance itself. Each metric type gives you different insights into MySQL performance; ideally both RDS and MySQL metrics should be collected for a comprehensive view. This post will explain how to collect both metric types.
Standard RDS metrics can be accessed from CloudWatch in three main ways:
Using the AWS Management Console and its web interface
Using the command line interface
Using a monitoring tool with a CloudWatch integration
Using the online management console is the simplest way to monitor RDS with CloudWatch. The AWS Console allows you to set up simple automated alerts and get a visual picture of recent changes in individual metrics.
Once you are signed in to your AWS account, you can open the CloudWatch console where you will see the metrics related to the different AWS services.
By selecting RDS from the list of services and clicking on “Per-Database Metrics,” you will see your database instances, along with the available metrics for each:
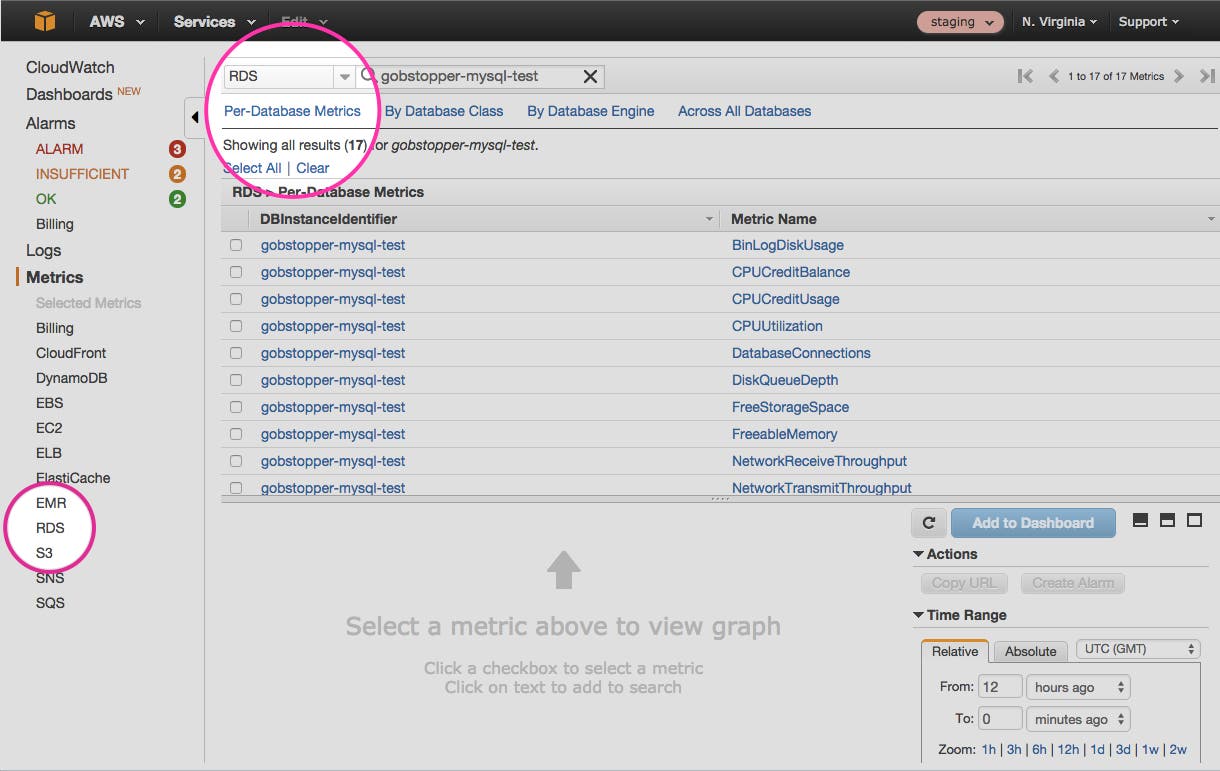
Just select the checkbox next to the metrics you want to visualize, and they will appear in the graph at the bottom of the console.
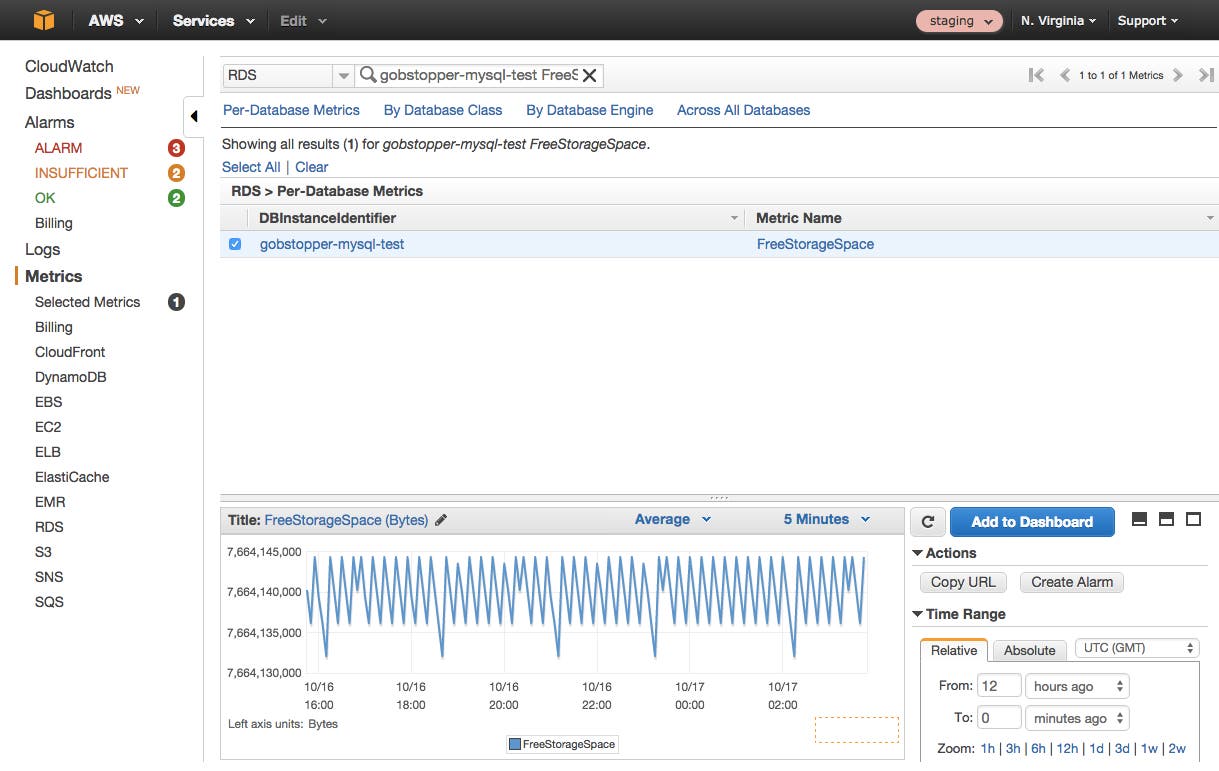
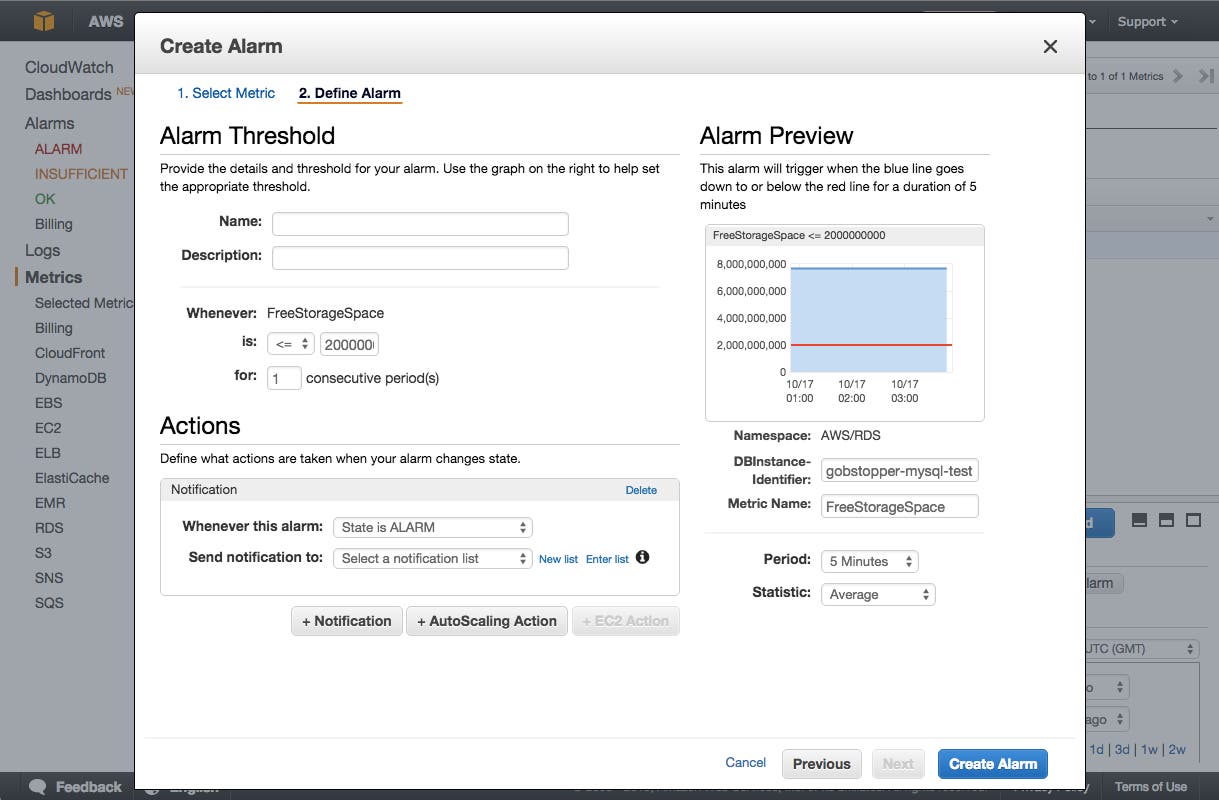
With the CloudWatch console you can also create alerts that trigger when a metric threshold is crossed.
To set up an alert, click on the “Create Alarm” button at the right of your graph and configure the alarm to notify a list of email addresses:
You can also retrieve metrics related to your database instance using the command line. Command line queries can be useful for spot checks and ad hoc investigations. To do so, you will need to install and configure the AWS command line interface. You will then be able to query for any CloudWatch metrics you want, using different filters.
For example, if you want to check the CPUUtilization metric across a five-minute window on your MySQL instance, you can run:
aws cloudwatch get-metric-statistics --namespace AWS/RDS --metric-name CPUUtilization --dimensions Name=DBInstanceIdentifier,Value=<YOUR_INSTANCE_NAME> --statistics=Maximum --start-time 2019-10-03T21:00:00 --end-time 2019-10-03T21:05:00 --period=60
Here is an example of the output returned from a get-metric-statistics query like the one above:
{
"Label": "CPUUtilization",
"Datapoints": [
{
"Timestamp": "2019-10-03T21:00:00Z",
"Maximum": 2.20338983050847,
"Unit": "Percent"
},
{
"Timestamp": "2019-10-03T21:01:00Z",
"Maximum": 1.50000000000001,
"Unit": "Percent"
},
{
"Timestamp": "2019-10-03T21:02:00Z",
"Maximum": 1.49999999999999,
"Unit": "Percent"
},
{
"Timestamp": "2019-10-03T21:03:00Z",
"Maximum": 1.50000000000001,
"Unit": "Percent"
},
{
"Timestamp": "2019-10-03T21:04:00Z",
"Maximum": 1.66666666666667,
"Unit": "Percent"
}
]
}
Full usage details for the get-metric-statistics command are available in the AWS documentation.
The third way to collect CloudWatch metrics is via your own monitoring tools, which can offer extended monitoring functionality. For instance, if you want to correlate metrics from your database with other parts of your infrastructure (including the applications that depend on that database), or you want to dynamically slice, aggregate, and filter your metrics on any attribute, or you need dynamic alerting mechanisms, you probably need a dedicated monitoring system. Monitoring tools that seamlessly integrate with the CloudWatch API can, with a single setup process, collect metrics from across your AWS infrastructure.
In Part 3 of this series, we walk through how you can easily collect, visualize, and alert on any RDS metric using Datadog.
CloudWatch offers several high-level metrics for any database engine, but to get a deeper look at MySQL performance you will need metrics from the database instance itself. Here we will focus on four methods for metric collection:
Querying server status variables
Querying the performance schema and sys schema
Using the MySQL Workbench GUI
Using a MySQL monitoring tool
With RDS you cannot directly access the machines running MySQL. So you cannot run mysql commands locally or pull CPU utilization metrics directly from the machine itself, as you could if you installed MySQL yourself on a standalone EC2 instance. That said, you can connect to your MySQL instance remotely using standard tools, provided that the security group for your MySQL instance permits connections from the device or EC2 instance you are using to initiate the connection.
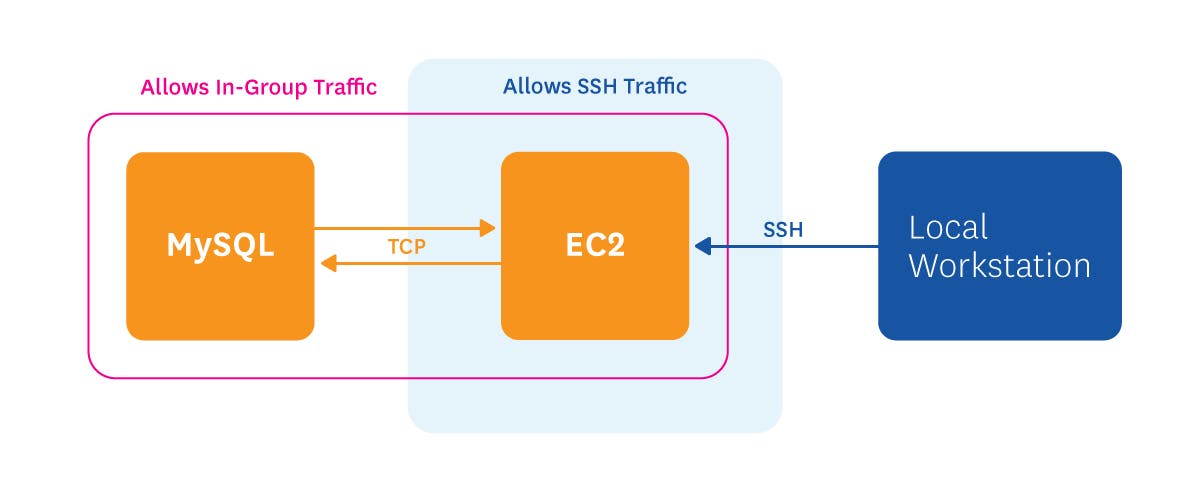
For example, if your RDS MySQL instance accepts traffic only from inside its security group, you can launch an EC2 instance in that security group, and then apply a second security group rule to the EC2 instance to accept inbound SSH traffic (see diagram above). Then you can SSH to the EC2 instance, from which you can connect to MySQL using the mysql command line tool:
mysql -h instance-name.xxxxxx.us-east-1.rds.amazonaws.com -P 3306 -u yourusername -p
The instance endpoint (ending in rds.amazonaws.com) can be found in the list of instances on the RDS console.
Once you connect to your database instance, you can query any of the hundreds of available MySQL metrics, known as server status variables. To check metrics on connection errors, for instance:
mysql> SHOW GLOBAL STATUS LIKE '%Connection_errors%';
Server status variables by and large capture high-level server activity. To collect metrics at the query level, such as query latency and query errors, you can use the MySQL performance schema, which captures detailed statistics on server events.
To enable the performance schema, you must set the performance_schema parameter to 1 in the database instance’s parameter group using the AWS console. This change requires an instance reboot.
Once it is enabled, the performance schema will collect metrics on all the statements executed by the server. Many of those metrics are summarized in the events_statements_summary_by_digest table, available in MySQL 5.6 and later. The digest normalizes all the statements, ignoring data values and standardizing whitespace, so that the following two queries would be considered the same:
SELECT * FROM orders WHERE customer_id=10 AND quantity>20
SELECT * FROM orders WHERE customer_id = 25 AND quantity > 100
The performance schema captures information about latency, errors, and query volume for each normalized statement. A sample row from the events_statements_summary_by_digest table shows an expensive query that takes multiple seconds to execute (all timer measurements are in picoseconds):
*************************** 1. row ***************************
SCHEMA_NAME: employees
DIGEST: 5f56800663c86bf3c24239c1fc1edfcb
DIGEST_TEXT: SELECT * FROM `employees` . `salaries`
COUNT_STAR: 2
SUM_TIMER_WAIT: 4841460833000
MIN_TIMER_WAIT: 1972509586000
AVG_TIMER_WAIT: 2420730416000
MAX_TIMER_WAIT: 2868951247000
SUM_LOCK_TIME: 1101000000
SUM_ERRORS: 0
SUM_WARNINGS: 0
SUM_ROWS_AFFECTED: 0
SUM_ROWS_SENT: 5688094
SUM_ROWS_EXAMINED: 5688094
SUM_CREATED_TMP_DISK_TABLES: 0
SUM_CREATED_TMP_TABLES: 0
SUM_SELECT_FULL_JOIN: 0
SUM_SELECT_FULL_RANGE_JOIN: 0
SUM_SELECT_RANGE: 0
SUM_SELECT_RANGE_CHECK: 0
SUM_SELECT_SCAN: 2
SUM_SORT_MERGE_PASSES: 0
SUM_SORT_RANGE: 0
SUM_SORT_ROWS: 0
SUM_SORT_SCAN: 0
SUM_NO_INDEX_USED: 2
SUM_NO_GOOD_INDEX_USED: 0
FIRST_SEEN: 2015-09-25 19:57:25
LAST_SEEN: 2015-09-25 19:59:39
Though the performance schema can be queried directly, it is usually easier to extract meaningful views of the data using the sys schema, which provides a number of useful tables, functions, and procedures for parsing your data.
To install the sys schema, first clone the mysql-sys GitHub repo to the machine that you use to connect to your MySQL instance (e.g., an EC2 instance in the same security group) and position yourself within the newly created directory:
git clone https://github.com/MarkLeith/mysql-sys.git
cd mysql-sys
Then, run a shell script within the mysql-sys repo that creates an RDS-compatible file for the sys schema. For MySQL version 5.6, the command and output looks like:
$ ./generate_sql_file.sh -v 56 -b -u CURRENT_USER
Wrote file: /home/ec2-user/mysql-sys/gen/sys_1.5.0_56_inline.sql
Object Definer: CURRENT_USER
sql_log_bin: disabled
Finally, you must load the newly created file into MySQL, using the filename returned in the step above:
mysql -h instance-name.xxxxxx.us-east-1.rds.amazonaws.com -P 3306 -u yourusername -p < gen/sys_1.5.0_56_inline.sql
Now, when you access your database instance using the mysql command line tool, you will have access to the sys schema and all the views within. The sys schema documentation provides information on the various tables and functions, along with a number of useful examples. For instance, to summarize all the statements executed, along with their associated latencies:
mysql> select * from sys.user_summary_by_statement_type;
+----------+--------------------+-------+---------------+-------------+--------------+-----------+---------------+---------------+------------+
| user | statement | total | total_latency | max_latency | lock_latency | rows_sent | rows_examined | rows_affected | full_scans |
+----------+--------------------+-------+---------------+-------------+--------------+-----------+---------------+---------------+------------+
| gobby | create_view | 87 | 490.62 ms | 6.74 ms | 9.78 ms | 0 | 0 | 0 | 0 |
| gobby | create_procedure | 26 | 80.58 ms | 9.16 ms | 9.06 ms | 0 | 0 | 0 | 0 |
| gobby | drop_procedure | 26 | 51.71 ms | 2.76 ms | 1.01 ms | 0 | 0 | 0 | 0 |
| gobby | create_function | 20 | 49.57 ms | 3.34 ms | 2.20 ms | 0 | 0 | 0 | 0 |
| gobby | drop_function | 20 | 38.84 ms | 2.20 ms | 889.00 us | 0 | 0 | 0 | 0 |
| gobby | create_table | 1 | 20.28 ms | 20.28 ms | 0 ps | 0 | 0 | 0 | 0 |
| gobby | create_trigger | 2 | 15.66 ms | 8.07 ms | 323.00 us | 0 | 0 | 0 | 0 |
| gobby | drop_trigger | 2 | 4.54 ms | 2.57 ms | 0 ps | 0 | 0 | 0 | 0 |
| gobby | insert | 1 | 4.29 ms | 4.29 ms | 197.00 us | 0 | 0 | 5 | 0 |
| gobby | create_db | 1 | 3.10 ms | 3.10 ms | 0 ps | 0 | 0 | 1 | 0 |
| gobby | show_databases | 3 | 841.59 us | 351.89 us | 268.00 us | 17 | 17 | 0 | 3 |
| gobby | select | 5 | 332.27 us | 92.61 us | 0 ps | 5 | 0 | 0 | 0 |
| gobby | set_option | 5 | 182.79 us | 43.50 us | 0 ps | 0 | 0 | 0 | 0 |
| gobby | Init DB | 1 | 19.82 us | 19.82 us | 0 ps | 0 | 0 | 0 | 0 |
| gobby | Quit | 2 | 15.26 us | 11.95 us | 0 ps | 0 | 0 | 0 | 0 |
+----------+--------------------+-------+---------------+-------------+--------------+-----------+---------------+---------------+------------+
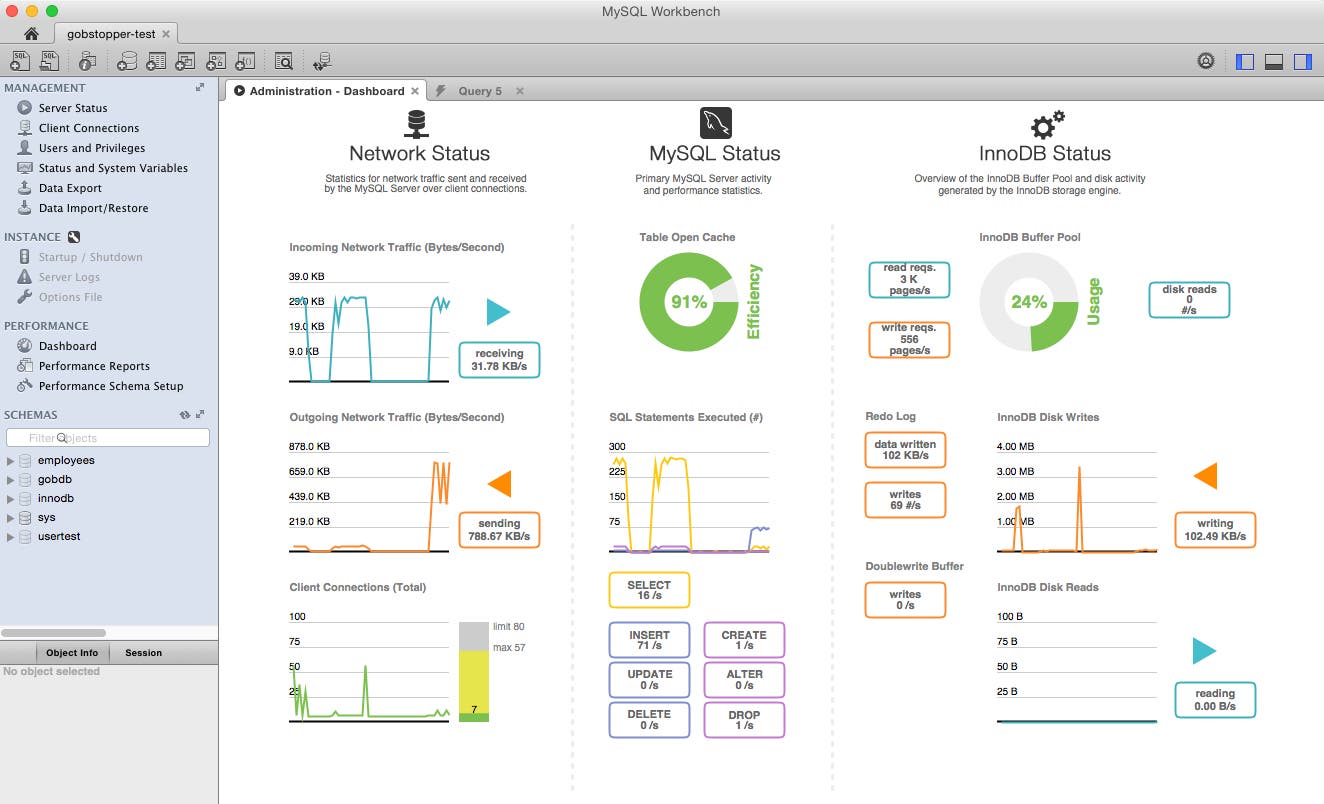
MySQL Workbench is a free application with a GUI for managing and monitoring a MySQL instance. MySQL Workbench provides a high-level performance dashboard, as well as an easy-to-use interface for browsing performance metrics (using the views provided by the sys schema).

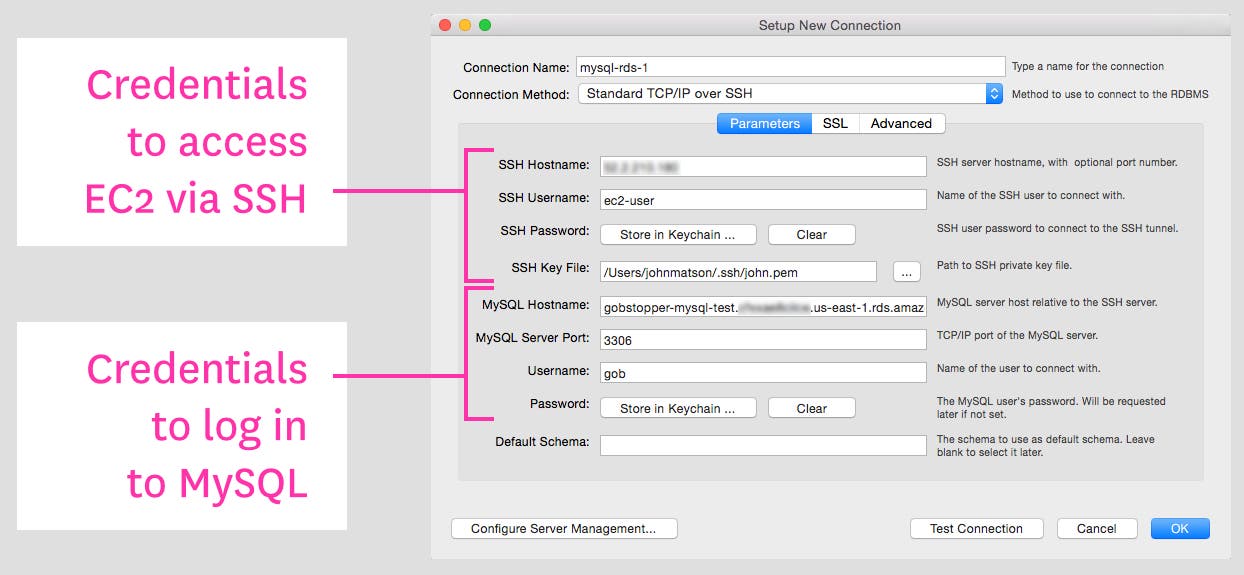
If you have configured an EC2 instance to communicate with MySQL running on RDS, you can connect MySQL Workbench to your MySQL on RDS via SSH tunneling:
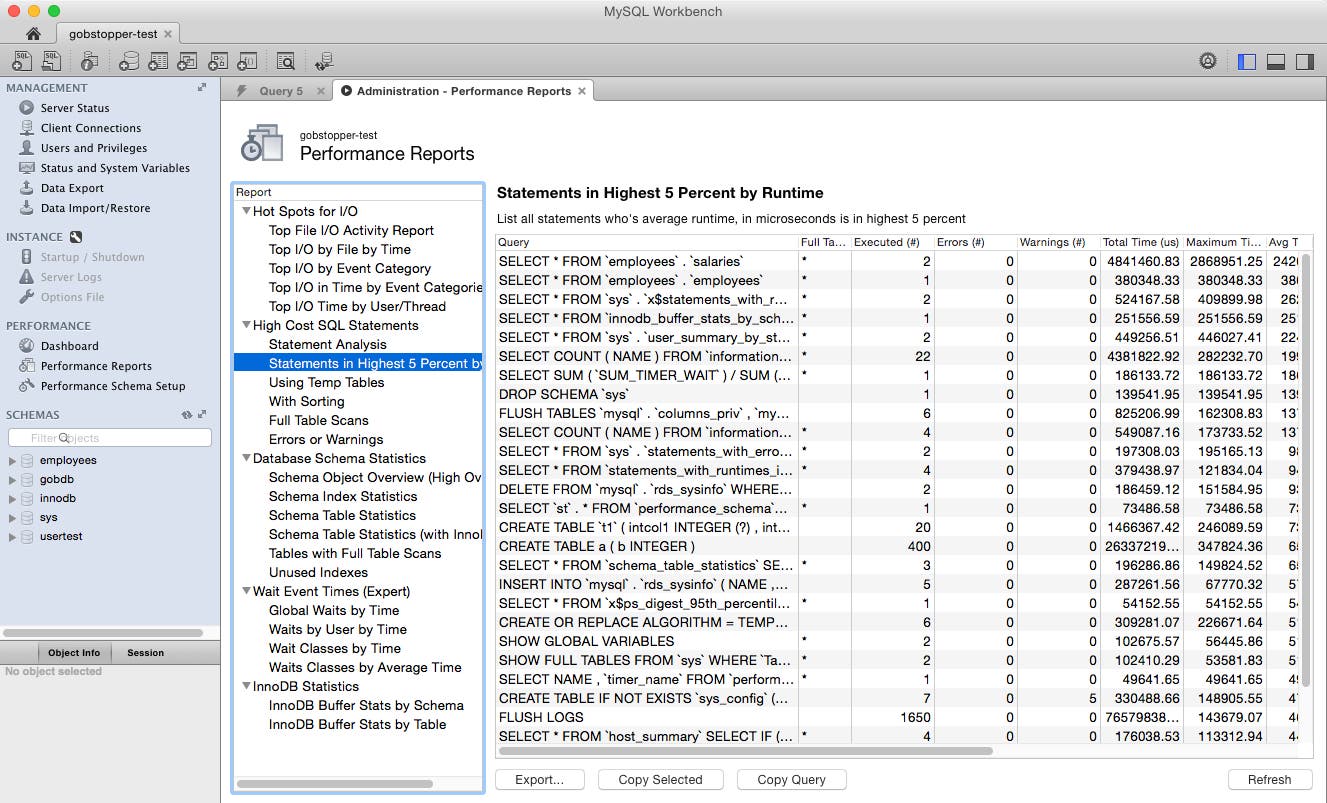
You can then view recent metrics on the performance dashboard or click through the statistics available from the sys schema:

The fourth way to access MySQL’s native metrics is to use a full-featured monitoring tool that integrates with MySQL. Such tools allow you to not only glimpse a real-time snapshot of your metrics but to visualize and analyze your metrics’ evolution over time, and to set alerts to be notified when key metrics go out of bounds. Comprehensive monitoring tools also allow you to correlate your metrics across systems, so you can quickly determine if errors from your application can be traced back to MySQL, or if increased MySQL latency is caused by system-level resource contention. Part 3 of this series demonstrates how you can set up comprehensive monitoring of MySQL on RDS with Datadog.
In this post we have walked through how to use CloudWatch to collect and visualize standard RDS metrics, and how to generate alerts when these metrics go out of bounds. We’ve also shown you how to collect more detailed metrics from MySQL itself, whether on an ad hoc or continuous basis.
In the next and final part of this series, we’ll show you how you can set up Datadog to collect, visualize, and set alerts on metrics from both RDS and MySQL.
We are grateful to have had input on this series from Baron Schwartz, whose company VividCortex provides a query-centric view of database performance.
此内容由惯性聚合(RSS阅读器)自动聚合整理,仅供阅读参考。 原文来自 — 版权归原作者所有。