George Kampitakis
A memory leak is a faulty condition where a program fails to free up memory it no longer needs. If left unaddressed, memory leaks result in ever-increasing memory usage, which in turn can lead to degraded performance, system instability, and application crashes.
Most modern programming languages include a built-in mechanism to protect against this problem, with garbage collection being the most common. Go has a garbage collector (GC) that does a very good job of managing memory. Garbage collectors such as the Go GC automatically track down memory that is no longer used and return it back to the system.
But even when the Go GC does its job well, there are still cases where Go programs can end up with memory leaks, or with analogous situations in which your system needs more and more memory to work properly. It’s crucial to detect and address these types of memory leaks, but the challenge is that engineers sometimes lack the knowledge and tools needed to do so.
In this blog post, we’ll look closely at these cases that can make a Go program “waste” memory. We’ll then cover the ways you can best identify these memory leaks, as well the most effective methods you can use to investigate them and determine their root causes.
In this section, we will investigate the conditions that can cause memory leaks. Some of those cases are specific to Go, and some others more general.
Creating resources in an unbounded way can often lead to a type of memory leak. For example, if you have a cache that only ever grows—as shown in the code snippet below—your service will eventually crash with an out of memory (OOM) error:
var cache = map[int]int{}
func main() {
// keep allocating memory indefinitely
for i:=0; ; i++ {
cache[i] = i
}
}
The solution is to restrict how many items the cache can hold. In the following example, the limit is set explicitly, but you could use other methods too, such as setting a time-to-live (TTL) value for cached items:
var cache = map[int]int{}
func main() {
for i:=0; ; i++ {
// max items cache can hold is 1_000_000
if len(cache) >= 1_000_000 {
delete(cache, i-len(cache))
}
cache[i] = i
}
}
This principle applies to many resources, including goroutines (more about this later), HTTP connections, or open files. In all of these cases, you should always be mindful to set limits on resource creation.
Repeatedly keeping references to objects that your service no longer needs can result in memory leaks. The garbage collector sees those references, so it cannot free the associated memory. Some cases where these kinds of long-lived references are unintentionally kept include:
There is also a special case in Go caused by “re-slicing a slice,” in which references to underlying memory are held unintentionally. (The same pattern also applies to strings.) As an example, let’s assume you are writing a function readFileDetails that opens a large file and stores its contents in a slice named data. If the function needs to return only a portion of the file, you might decide to “re-slice” the slice with a statement such as return data[5:10]. However, in Go, slices share the same underlying memory block as the original array. This means that, even if you are interested in only a very small subset of the data, the returned value still keeps a reference to the underlying memory containing the whole file.
The correct way to fix this is to call bytes.Clone(data[5:10]), which creates a new, independent slice containing only the desired subset of data. This way, the data from the original file is no longer referenced—thereby allowing it to be collected by the garbage collector. The original (faulty) and revised functions are shown below:
func readFileDetails(name string) []byte{
data, err := os.ReadFile(name)
if err != nil {
return err
}
return data[5:10]
}
// not holding reference to underlying memory anymore
func readFileDetails(name string) []byte{
data, err := os.ReadFile(name)
if err != nil {
return err
}
return bytes.Clone(data[5:10]))
}
Goroutines are lightweight threads that enable efficient concurrency. Though the Go runtime does a great job at spawning and managing them, each goroutine still consumes system resources, and there is a limit to how many goroutines your system can handle at once.
Additionally, goroutines can allocate or reference memory, so it’s crucial to make sure they terminate properly and release memory to avoid memory leaks.
Consider the example below. The function runJobs creates a new goroutine every second to execute a task that involves allocating a big data slice, performing some processing, and then waiting indefinitely for a cancellation signal. This code has two potential issues:
func runJobs(cancel <-chan struct{}) {
for {
go func() {
// create a 1GB slice
bigSlice := make([]byte, 1_000_000_000)
// do some work with the data
_ = bigSlice
// wait indefinitely until a cancellation signal is received
<-cancel
}()
time.Sleep(time.Second)
}
}
Deferring a large number of functions can also cause a memory leak. The most common instance of this problem occurs when you call defer inside a loop. In Go, deferred function calls are pushed into a stack and executed in last in, first out (LIFO) order at the end of the surrounding function. This feature can exhaust resources if not handled correctly.
In the following example, for instance, the function opens and then processes files in a for loop and calls .Close on defer. The problem with this code occurs if you call processManyFiles with a lot of files. Because the files close only after processing is complete, this approach could overwhelm system resources.
func processManyFiles(files []string) error {
for _, file := range files {
f, err := os.Open(file)
if err != nil {
return err
}
defer f.Close()
process(f)
}
return nil
}
func process(f *os.File) {
// do something with the file
}
The correct way to handle this situation would be to move the file opening and processing into a separate function, so that in the for loop, each file is closed before moving to the next one. This method is shown below:
func processManyFiles(files []string) error {
for _, file := range files {
err := process(file)
if err != nil {
return err
}
}
return nil
}
func process(name string) error {
f, err := os.Open(name)
if err != nil {
return err
}
defer f.Close()
// do something with the file
return nil
}
Another common source of memory leaks is the improper use of time.Ticker. As stated in the time.Ticker documentation, the resources are released only when the ticker is stopped.
The following example shows a use of time.Ticker that can lead to wasted memory:
func main() {
for {
ticker := time.NewTicker(1 * time.Second)
// do something with the ticker
_ = <-ticker.C
}
}
The correct way to handle time.Ticker is as follows:
func main() {
for {
ticker := time.NewTicker(1 * time.Second)
// do something with the ticker
_ = <-ticker.C
// stop the ticker to release associated resources
ticker.Stop()
}
}
The most straightforward way to determine whether your service is experiencing a memory leak is to monitor its memory consumption over time. Certain known memory patterns are strongly correlated with memory leaks, and spotting those patterns in your service should raise concerns.
The following image shows a graph of memory utilization per pod for a service. Memory utilization is growing gradually overall, with occasional big spikes. While memory does go down after spikes, it never reverts to a previous value. This pattern suggests that memory is being retained and not released—a key indicator of a leak. If you see a similar trend, you should investigate what exactly is consuming this memory and why, and why it isn’t being freed.
This next image shows another pattern associated with memory leaks. Specifically, it reveals an abrupt, “cliff-like” reduction in memory. The drop indicates that the service reached the system’s memory limit and crashed with an OOM error.
Keep in mind that these patterns alone are not definitive proof of a memory leak. For example, in the first image, the service could still be in the startup phase where it needs to allocate memory for initialization or cache warming. In the second image, the abrupt drop could result from having wrongly sized your service, leading to under-allocated memory and, therefore, an inevitable crash. In both cases, you should look deeper to identify the cause.
If you do suspect a memory leak, where should you look to discover the root causes behind these suspicious patterns? Today, systems are usually complex, with many external factors and interactions, and simply browsing through your code is probably not an adequate strategy to find the information you need.
Code profiling is the practice of analyzing a program’s execution to identify which parts of the code are consuming the most CPU, memory, or other resources. In Go, the pprof tool provides an effective way to collect this profiling data.
Profiling data can be gathered during testing with go test or through HTTP endpoints provided by the net/http/pprof package. Among the predefined profiles, the heap profile is the most relevant for investigating memory leaks. This profile reports memory allocation samples, which allows you to monitor both current and historical memory usage.
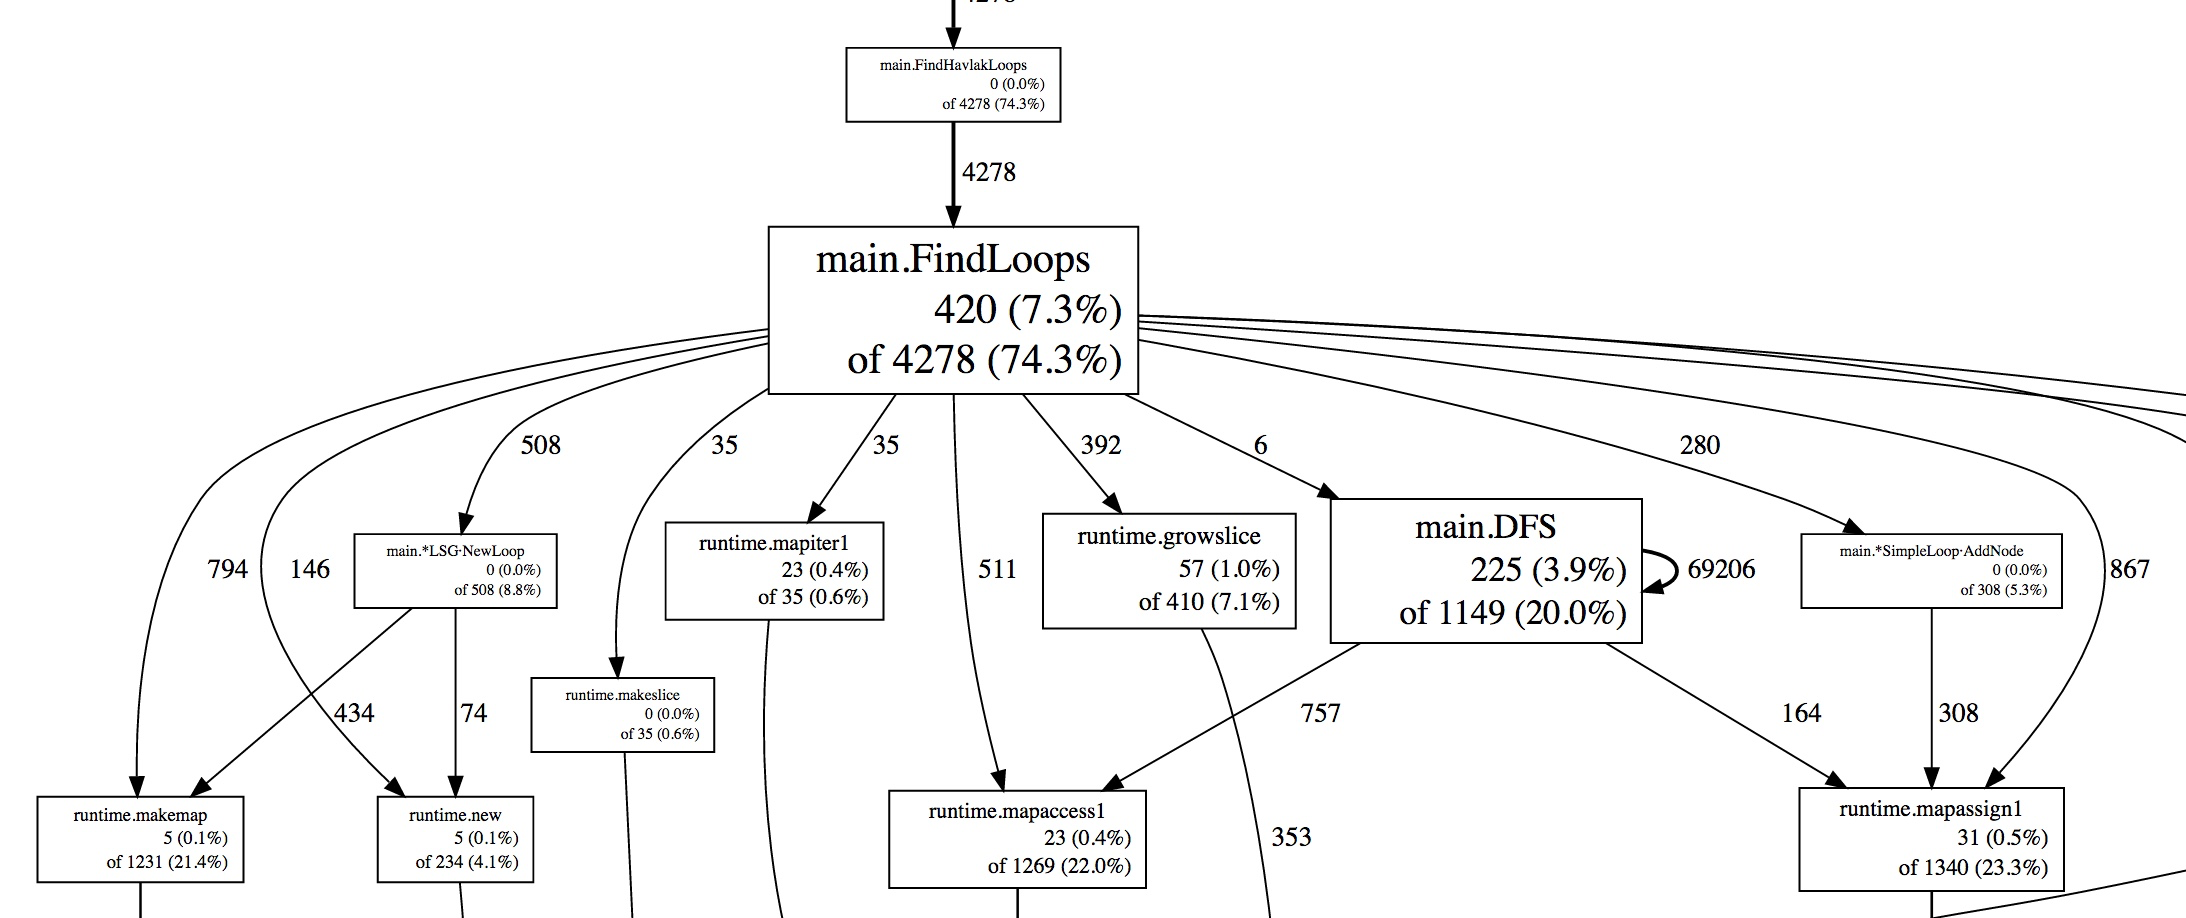
Users can also use pprof to filter, visualize, and examine the most critical or expensive code paths. It supports text, graph, and callgrind visualizations to help you evaluate the profiling data you have captured. You can see examples of these three visualizations in the Go documentation. For instance, this graph visualizes the most expensive calls within a Go program.
The following snippet shows how to begin capturing CPU and memory profiles during benchmarking and how to set up a pprof HTTP server for live analysis.
go test -cpuprofile cpu.prof -memprofile mem.prof -bench .
and
package main
import (
_ "net/http/pprof"
)
func main() {
...
http.ListenAndServe(":6060", nil)
}
Using pprof is a traditional method of profiling in Go programming, as it is a well-established, built-in tool that has been widely used for performance analysis in Go applications. However, there is a drawback to this traditional approach: it typically requires a lot of manual setup and configuration to prepare your system for profiling workloads in production, or even to collect profiling data from a program running locally.
And even after the setup is complete, capturing profiled data via pprof remains a highly manual process. To troubleshoot an issue, you need to know exactly when to capture the profiled data. But answering this question isn’t always straightforward. Under what conditions does the issue occur? At what time of the day? Is it only happening in your staging environment for a new version of your code, or is it happening in production as well? So, while pprof is powerful, its reliance on manual processes often makes it impractical for troubleshooting memory leaks in real-world environments.
This is where continuous profiling can help. With products such as Datadog Continuous Profiler, you can collect metrics and profiling data from your services without interruption, and while serving real traffic. This approach automatically addresses questions about when and where to capture data, since you’re capturing all available data about a program’s execution, and (typically) in your production environment. You therefore don’t need to worry about how to capture profiles in a way that exposes the problem you’re troubleshooting.
Continuous Profiler allows you to onboard your service in just a few steps and then drill down into the submitted data to investigate memory leaks or other performance issues. Through flame graphs and other visualizations, Continuous Profiler exposes resource usage associated with various function calls and methods within a running service. The following image, for example, visualizes CPU time:
With Continuous Profiler, you can also compare profiles between time periods (e.g., two profiles collected two hours apart), or even between different versions of the code (e.g., when testing a new feature that you suspect is causing a memory leak). Features like these help you spot differences in resource utilization, which is critical for troubleshooting.
Though the Go runtime includes a built-in garbage collector, certain conditions can still lead to memory leaks that require proactive detection and resolution. Profiling, especially continuous profiling, helps you to detect the causes of memory leaks in Go and to identify, investigate, and resolve these issues.
To find out more about how you can use Datadog Continuous Profiler to address memory leaks, see our documentation. To learn the basics, read our blog post on Go memory metrics. And if you’re not yet a Datadog customer, you can sign up for our 14-day free trial.
此内容由惯性聚合(RSS阅读器)自动聚合整理,仅供阅读参考。 原文来自 — 版权归原作者所有。