


In this post, we will show you how you can use AWS CloudFormation to automatically deploy infrastructure that is preconfigured to send metrics and logs to Datadog. To demonstrate how this works, we will use a sample CloudFormation template that creates an EC2 instance running Apache web server, then installs the Datadog Agent, configures it with your API key, and enables Datadog’s integration with Apache. If you’re not already using Datadog, you can still follow along with the steps in this post by signing up for a free 14-day trial.
CloudFormation is a configuration management service from AWS that allows you to create and update infrastructure programmatically. A CloudFormation template is a JSON or YAML file you create to describe your desired infrastructure. A template defines the properties of each resource (such as an EC2’s instance type), and the configuration CloudFormation will apply to attain the infrastructure’s desired state. Each template defines a stack—a collection of logically related AWS resources, such as EC2 instances, VPCs, Elastic Load Balancers, and IAM roles. The components of the stack are defined in the template’s Resources section. For example, to create an EC2 instance from a preconfigured Amazon Machine Image (AMI) using CloudFormation, your template would contain YAML like this:
Resources:
MyEC2Instance:
Type: "AWS::EC2::Instance"
Properties:
InstanceType: t2.small
ImageId: ami-011b6930a81cd6aaf
A CloudFormation template is infrastructure as code. Rather than code that’s imperative—defining a specific path in creating the infrastructure—the template uses declarative language to define a new stack or revisions to an existing stack. When you execute the template (using the CloudFormation console, SDK, or CLI), CloudFormation compares the state of the infrastructure to the desired state you’ve declared, then determines and executes the steps necessary to attain the desired state.
Like any code, the templates that describe your infrastructure can be versioned and reused. Each time you execute a CloudFormation template, you create a stack identical to any others based on that template. This allows you to run identical environments for different purposes (such as QA and development), and supports devops practices like blue/green deployments.
CloudFormation is similar to other configuration management software, like Chef and Ansible, which support the same goal of managing infrastructure as code.
CloudFormation can deploy infrastructure that’s readily observable. Including the configuration and deployment of the Datadog Agent in your CloudFormation template gives you visibility into your infrastructure as soon as it comes online.
The Datadog Agent is a lightweight, open source application that collects and forwards metrics, logs, and distributed request traces to your Datadog account. As soon as the Agent is running on your EC2 instances, you’ll be able to see host-level metrics beyond what’s reported by Amazon CloudWatch, and you’ll be able to visualize your logs and APM data in Datadog.
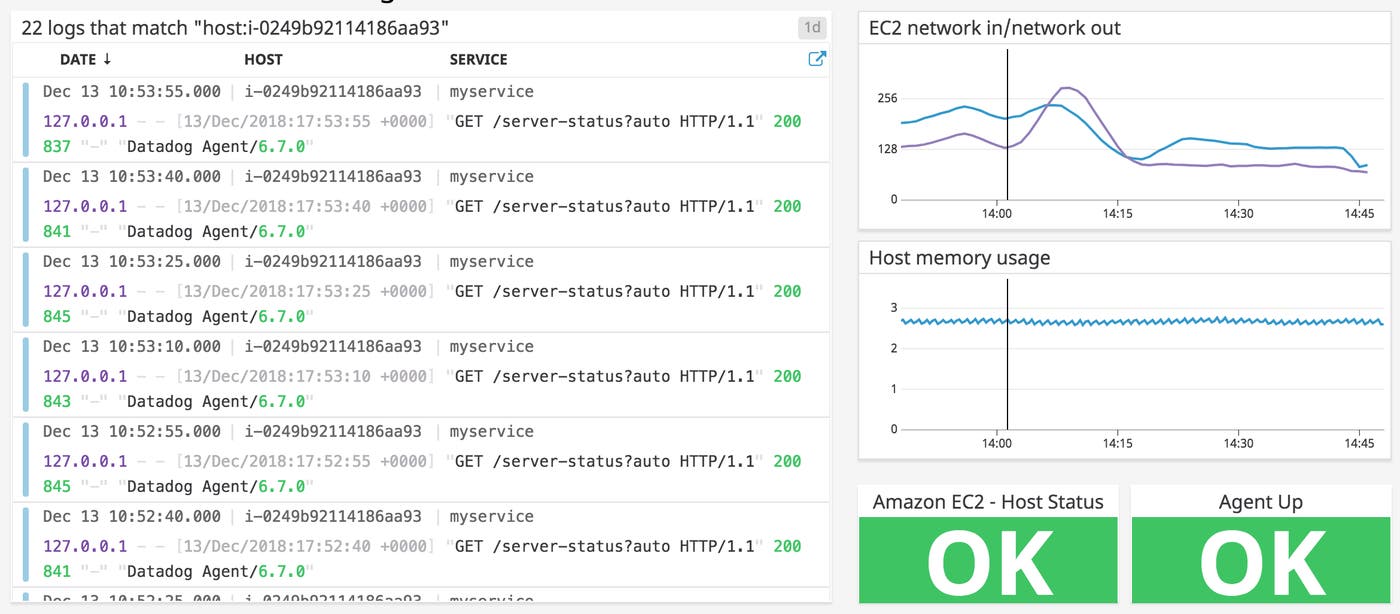
In this section, we’ll look at the anatomy of our demonstration template and highlight some of the code that defines key characteristics of the stack it creates.
Our template creates two AWS resources and a Datadog resource. (See our CloudFormation Registry blog post for information about deploying Datadog resources via CloudFormation.) The AWS resources are an EC2 instance (which the template identifies as MyWebServerInstance, since it will include the Apache server) and an associated security group (identified as MySecurityGroup), which allows traffic on the instance’s port 80. The Datadog resource (DatadogMonitorResource) is a monitor that will alert you if your EC2 instance becomes unavailable.
This template accepts two parameters:
Your Datadog API key, which is used by the Agent to automatically send metrics and logs to your Datadog account
Your application key, which—along with your API key—is used to authenticate your request to create the Datadog monitor
The template is broken down into sections, each of which fills a purpose in creating the stack:
Parameters. This section defines values to be provided when the template is executed. CloudFormation uses the parameter values passed by the user (or the parameters’ default values) to configure stack properties such as your Datadog API key or the name of your SSH key pair.
Resources. This is the only required section in a CloudFormation template. It defines the AWS resources to be created (or updated) by the template.
Outputs. This section defines the values to be returned when the template is executed. The key name of each output is defined in the template, and its value is returned when template execution is complete.
The other sections that comprise a CloudFormation template are its description, transform, metadata, conditions, and mappings. For information about these sections, see the CloudFormation user guide.
The first section of our template defines its parameters. A Parameters section is optional in a CloudFormation template, but by defining template parameters, you can require the user to provide values that will be plugged into the template to configure the requested resources. The demo template defines the APIKey and APPKey parameters.
Parameters:
APIKey:
Description: "The API key for your Datadog account"
Type: String
APPKey:
Description: "An application key from your Datadog account"
Type: String
You’ll input your Datadog API key and application key when you execute the template. CloudFormation uses the API key to configure the Agent to submit data to your Datadog account, and then uses both keys to authenticate the call to create the Datadog monitor resource.
You can use the AWS::CloudFormation::Init metadata key to specify characteristics of an EC2 instance, such as users and groups that should be present, services that should be running, and more. This gives you great flexibility in automating the configuration of your instances; see the AWS documentation to learn more about what you can do with AWS::CloudFormation::Init.
In our demonstration template, AWS::CloudFormation::Init organizes instance configuration details into three groups called configsets. Our configsets organize the instance’s configuration into three logical areas: packages to be installed, configuration details for Apache and the Agent, and instructions to restart the services to apply the updated configurations. The YAML snippet below shows the definitions of the configsets:
AWS::CloudFormation::Init:
configSets:
# List the configSets and the config keys they contain:
Install:
- "installHttpd"
- "installDatadogAgent"
Configure:
- "configureModStatus"
- "enableLogs"
- "configureLogs"
Restart:
- "restart"
Each configset contains only a list of configuration items, called config keys, which specify the configuration details. In the following sections, we’ll look at the YAML in each config key that defines the commands that will run and packages that will be installed on the instance.
When the template is executed, CloudFormation triggers a script that reads all the config keys and determines how to achieve the desired configuration. We’ll look more closely at this process in the UserData section.
The first config key in this set, installHttpd, contains directives to ensure that Apache is installed and running on the instance:
installHttpd:
packages:
yum:
httpd: []
services:
sysvinit:
httpd:
enabled: true
ensureRunning: true
The next config key, installDatadogAgent, downloads and installs the Agent using the one-step installation script, plugging in the API key that the user has provided as a parameter:
installDatadogAgent:
commands:
01_download_and_install:
env:
DD_API_KEY: !Sub "${APIKey}"
command: "bash -c \"$(curl -L https://raw.githubusercontent.com/DataDog/datadog-agent/master/cmd/agent/install_script.sh)\""
The elements in the Configure configset modify Apache’s configuration, then update the configuration of the Agent so it can collect and tag metrics and logs from Apache.
The first key in this configset, configureModStatus, enables Apache’s mod_status module. This makes the Apache status page available for the Agent to use as a source for metric data.
configureModStatus:
commands:
01_add_config:
command:
!Sub |
cat <<EOT > /etc/httpd/conf.d/server-status.conf
# Enable the /server-status page
ExtendedStatus on
<Location /server-status>
SetHandler server-status
Allow from localhost
</Location>
EOT
For more information about the mod_status module, see the Apache documentation.
The next config key, enableLogs, updates the datadog.yaml file and enables the Agent to collect logs. Then it sets an access control list (ACL) on the directory where Apache stores logs, so the Agent can access them. It also adds this ACL instruction to the host’s logrotate configuration so it’s automatically reapplied when Apache logs are rotated.
enableLogs:
commands:
01_update_datadog_yaml:
cwd: "/etc/datadog-agent/"
command: "sed -i 's/^# logs_enabled: false$/logs_enabled: true/' datadog.yaml"
02_fix_logfile_permissions:
command: "setfacl -m u:dd-agent:rx /var/log/httpd"
03_sed_logrorate:
cwd: /etc/logrotate.d
command: "sed -i 's#/bin/systemctl reload httpd.service > /dev/null 2>/dev/null || true#/bin/systemctl reload httpd.service > /dev/null 2>/dev/null || true; setfacl -m u:dd-agent:rx /var/log/httpd#' httpd"
The configureLogs key updates the Agent’s Apache configuration file so it can collect and tag access and error logs, and collect metrics from Apache’s status page.
configureLogs:
commands:
01_create_apache_conf_yaml:
cwd: "/etc/datadog-agent/conf.d/apache.d/"
command:
cp conf.yaml.example conf.yaml
02_update_apache_conf_yaml:
cwd: "/etc/datadog-agent/conf.d/apache.d/"
command:
!Sub |
cat <<EOT >> conf.yaml
logs:
- type: file
path: /var/log/httpd/access_log
source: apache
sourcecategory: http_web_access
service: myservice
tags:
- env:qa
- type: file
path: /var/log/httpd/error_log
source: apache
sourcecategory: http_web_access
service: myservice
tags:
- env:qa
EOT
The first command in this key copies the sample configuration file, conf.yaml.example to conf.yaml so the Agent can recognize and use it. The second command adds a logs element to that file, which specifies the path to Apache’s log files, and tells the Agent to tag the logs with service: myservice and env: qa. You can customize these tags to suit your needs. The source tag tells Datadog to route the incoming logs through an Apache-specific processing pipeline, and the sourcecategory tag can help you aggregate related logs across hosts and services. For more information on using these tags, see our tagging documentation.
The command in the restart key restarts Apache and the Agent to apply all configuration changes.
restart:
commands:
01_restart:
command: "systemctl restart httpd.service; systemctl stop datadog-agent.service; systemctl start datadog-agent.service"
The Properties section of the template defines the characteristics of the MyWebServerInstance being created.
When the instance comes up, it executes the bash script in the UserData section of the template. First, this script instructs the instance to update its aws-cfn-bootstrap package:
yum update -y aws-cfn-bootstrap
This package contains helper scripts CloudFormation will use to configure the instance. One of these helper scripts is cfn-init. CloudFormation calls cfn-init and references the three configsets—Install, Configure, and Restart—defined in the AWS::CloudFormation::Init section of the template:
/opt/aws/bin/cfn-init -v --stack ${AWS::StackName} --resource MyWebServerInstance --configsets Install,Configure,Restart --region ${AWS::Region}
The InstanceType value designates the class and size of the EC2 instance.
In this demo template, InstanceType is hardcoded as t2.nano. For a more flexible template, you could include InstanceType as a parameter, allowing the user to select an InstanceType value when executing the template.
The ImageId element specifies the AMI that CloudFormation will use as the basis for the instance to be created.
ImageId: ami-011b6930a81cd6aaf
This demo template specifies an Amazon Linux 2 AMI for the us-west-1 region. You can change your copy of the template to specify an image from a different region. (To find the ImageId for an AMI in a different region, visit the EC2 section of the AWS console and click Launch Instance.) A production-ready CloudFormation template will include a mapping of AMIs available in each region, and will automatically select the one appropriate for the region where the template is executed. This ensures that the template is reusable in any region. For guidance on creating a template that programmatically determines the correct AMI ID for a given region and instance type, see this document from AWS.
An AWS security group acts as a virtual firewall, governing the flow of traffic to and from your infrastructure. All EC2 instances have at least one associated security group. If you create an EC2 instance without specifying a security group, the default security group is applied. But because the default security group doesn’t allow traffic to or from port 80, the demo template creates a custom security group that exposes port 80 externally.
MySecurityGroup:
Type: "AWS::EC2::SecurityGroup"
Properties:
GroupDescription: "Allow web traffic"
SecurityGroupIngress:
- CidrIp: 0.0.0.0/0
FromPort: '80'
IpProtocol: tcp
ToPort: '80'
After creating the EC2 instance, CloudFormation returns values for the output variables defined in the template.
Outputs:
URL:
Description: "The URL of this instance's website"
Value: !Sub "http://${MyWebServerInstance.PublicIp}"
InstanceDashboard:
Description: "Link to this instances's Datadog dashboard"
Value: !Sub "https://app.datadoghq.com/dash/host_name/${MyWebServerInstance}"
Below, we’ll show how you can use the URL and InstanceDashboard output values to begin monitoring your stack in Datadog.
As outlined above, the demo template defines a small stack, including an EC2 host running an Apache server that’s configured to send metrics and logs to your Datadog account. In this section, we’ll walk you through executing the template to create the stack, then viewing your instance’s metrics and logs in Datadog.
Download the demo template to your local storage, then navigate to the CloudFormation page in the AWS console. (Make sure you’re in the us-west-1 (US West (N. California)) region for this demo, since the template specifies an AMI from that region.) Click Create Stack. Under Choose a template, click Choose File and navigate to your local copy of the template. Click Next.
In the next screen, enter a name for your stack in the Stack name field. Next, enter your Datadog API key in the APIKey field and an application key from your Datadog account in the APPKey field. (To find these keys, look in the API Keys and Application Keys sections on this page.) Click Next.
In the screen that appears next, you can optionally tag your stack using the Key and Value fields. Any tags you add here will be applied to all the resources in the stack (in this case, the EC2 instance and the security group), and to the CloudFormation stack itself. Datadog ingests these tags automatically so you can filter and aggregate all your monitoring data on the fly. To add more than one tag, click the plus sign on the right. Leave the other fields on this page empty. Scroll down and click Next.
Review the stack information you’ve provided, then click Create.
Next you’ll see a table that contains a list of your stacks. In the Status column, your new stack’s status will initially appear as CREATE_IN_PROGRESS.
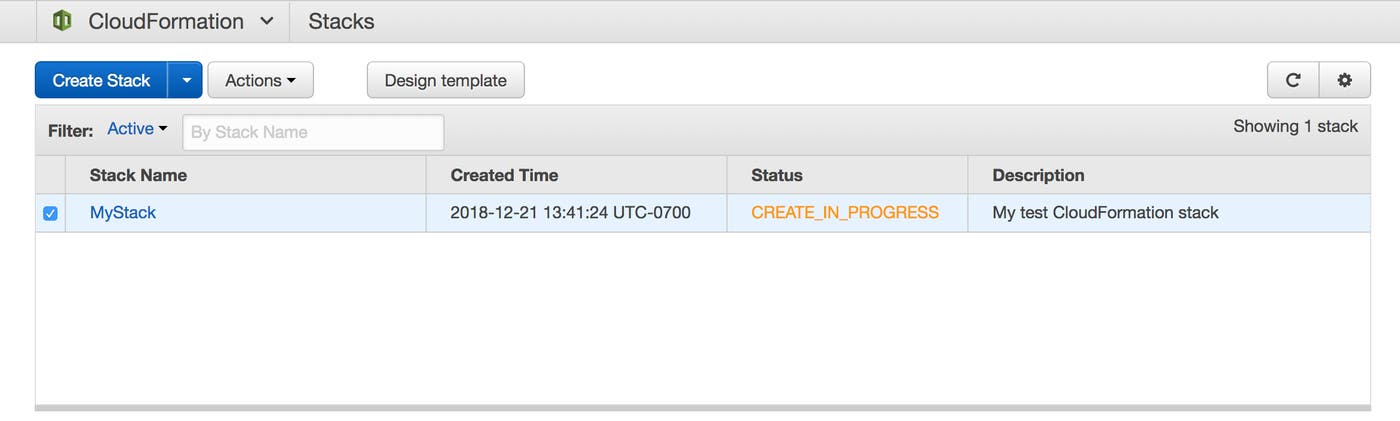
After a few minutes, it should change to CREATE_COMPLETE, and you’re ready to proceed.
When your stack creation is complete, click to highlight your stack’s row in the table, then click the Outputs tab.
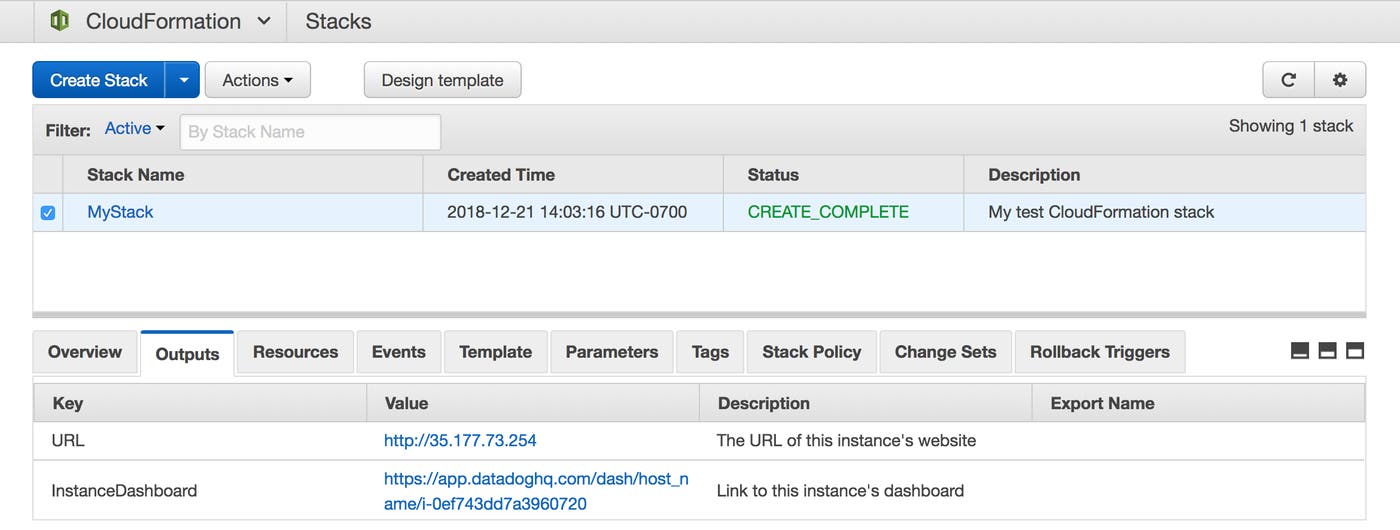
Click the value in the InstanceDashboard row to navigate to the host dashboard in your Datadog account.
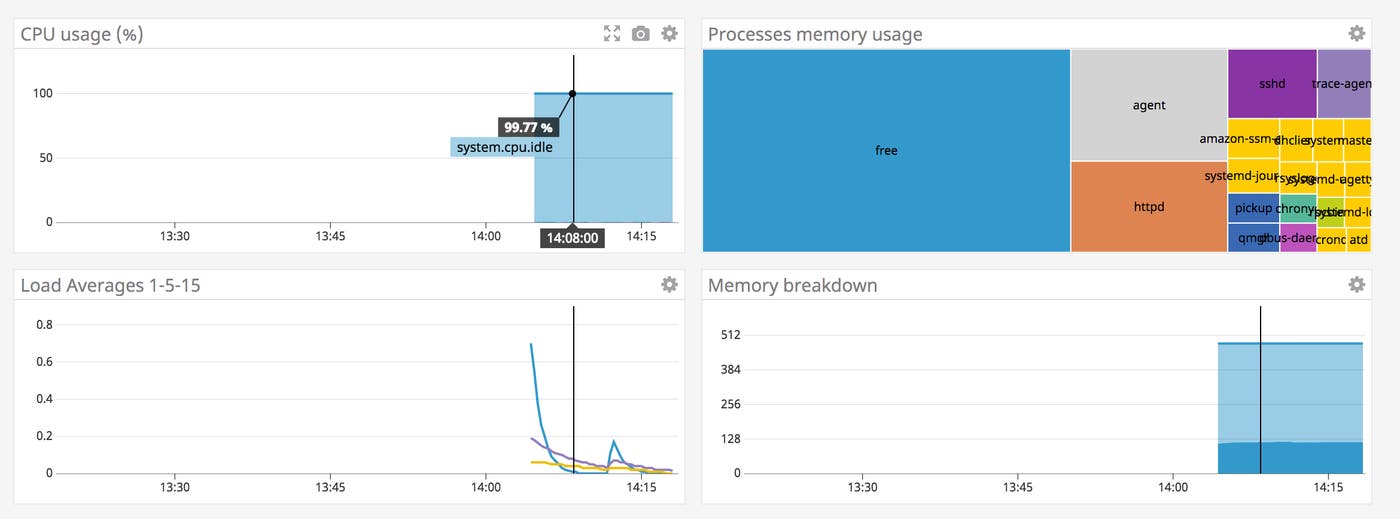
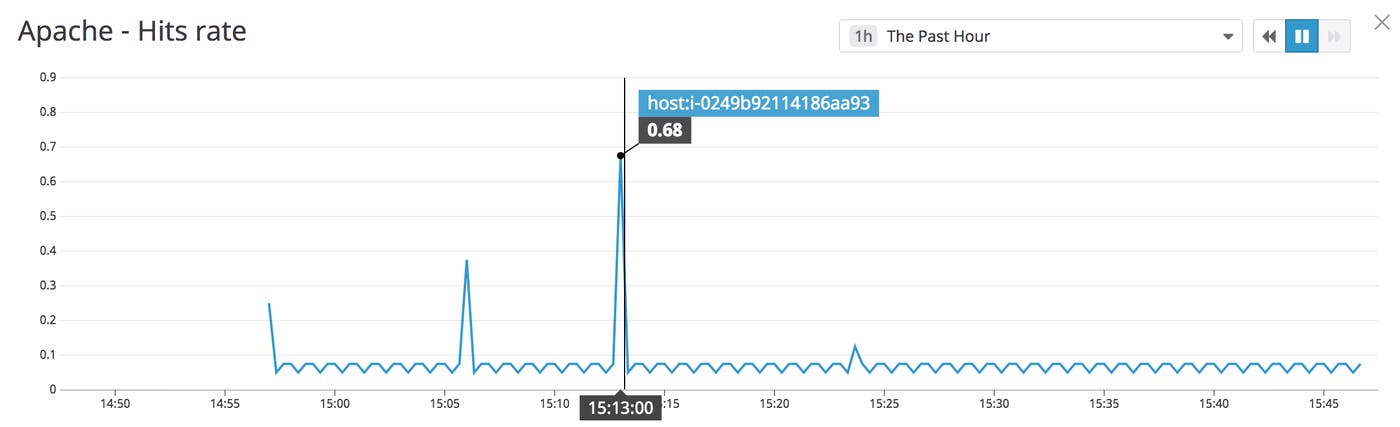
The EC2 host you created in your new stack is now sending metrics to Datadog. Back in your AWS console, click the URL value in the Outputs tab to load the instance’s website in your browser. Reload the page several times to generate traffic to your web server. Return to the host dashboard and note the Apache - Hits rate graph. The traffic you just generated in your browser should show as a spike, as in the screenshot below. You may see other requests at regular intervals on the graph, due to the Agent making regular calls to the Apache status page.
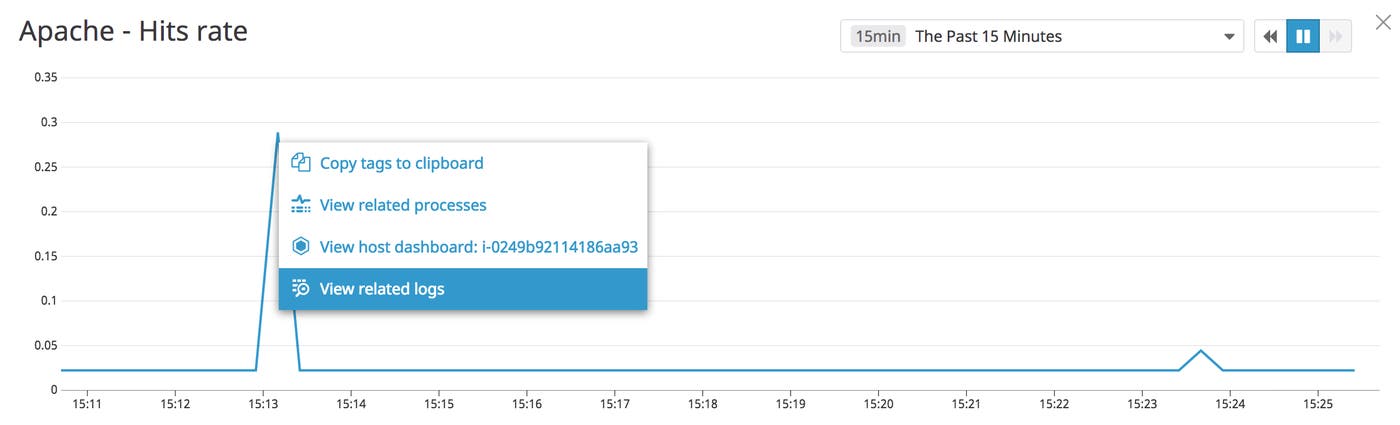
You can easily pivot from viewing your host’s metrics on the graph to browsing related logs. Click a point on the Apache - Hits rate graph, then click the View related logs option.
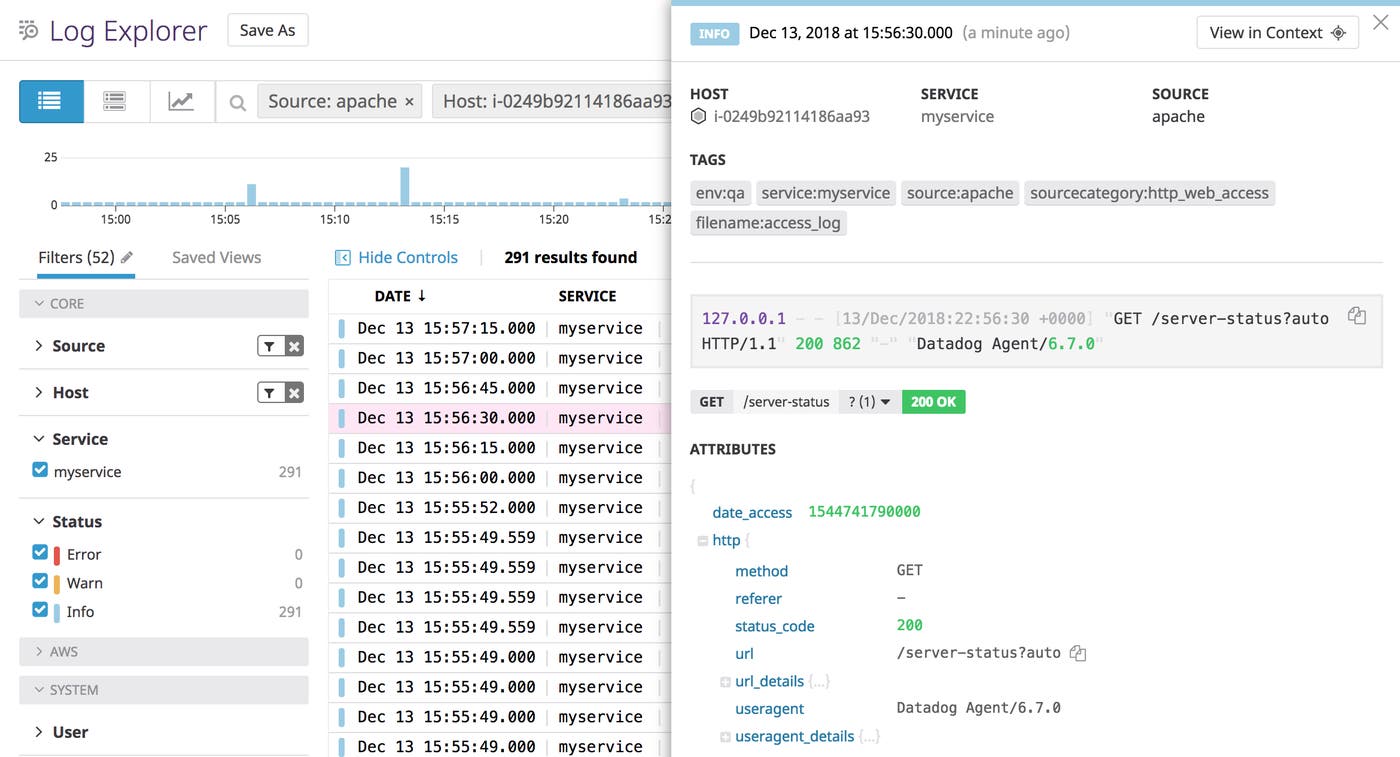
The Log Explorer will show your host’s time-correlated Apache logs, as shown in the screenshot below.
In this post we’ve shown you how to deploy an EC2 instance running Apache server, and how to install and configure the Datadog Agent to monitor Apache and the host itself. To go further with CloudFormation and Datadog, you can build on this template to configure any of Datadog’s 1,000 other integrations. If you’re not already using Datadog, you can get started with a free 14-day trial.
此内容由惯性聚合(RSS阅读器)自动聚合整理,仅供阅读参考。 原文来自 — 版权归原作者所有。