Overview
Robotic Data Cloud Structure
System Design Goals
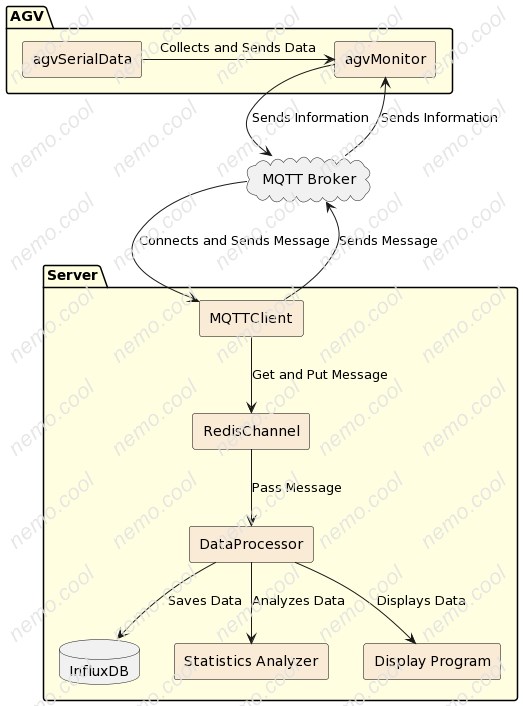
The Robotic Data Cloud is designed to get info from Robotic , send to server, store data, analyse data, alarm display and job statistics.
Widely used in AGV, automatic forklift, follow me robot and other robots. The following is an example of building Data Cloud system with AGVs.
The program in AGV called agvMonitor, it is designed to work small, fast and stable, It has the function of disconnecting local storage and resuming automatic uploading.
The system is included in the server:
- MQTTClient: Subscribe topics and get message from MQTT broker, figure the message and put it in the message queue.
- RedisChannel: Play the role as MQ, the goal for it is to make sure to give the message to another program.
- DataProcessor: The main program to process data from different topics, including data serivalise, message classification, database write, information display, etc.
Structure of the system
Information obtained from AGV
agvMonitor topics list
MQTT Topic Format
Message from AGV:
The formation of the message from AGV or sent to AGV like this format:
# Topic agv should to publish
agv/state/{agv_id} # Data got from state machine
agv/system/{agv_id} # Data got from system on Pi
agv/serial/{agv_id} # Data got from Serial Data

# Topic agv shoule to subscribe
dispatch/command/{agv_id} # some commands like reboot, deleate logs ...
The reason is that it does not need to subscribe to many MQTT topics, just use AGV to find out which AGV has published and to receive it.
MQTT Topics
agv/state/{agv_id}
These topics mean that the massages in the topic are received from the state machine, it displays the state of the AGV, like IDLE or BUSY, the status of a motivation, SUCCESS or FAILED, the battery info like percentage, voltage…, It can also recode the QR code changes from top and bottom, finally it can calculate the running time from app_shutdown_request. Also we can get the mileage.
Content of the topic:
“subtopic”:“state”
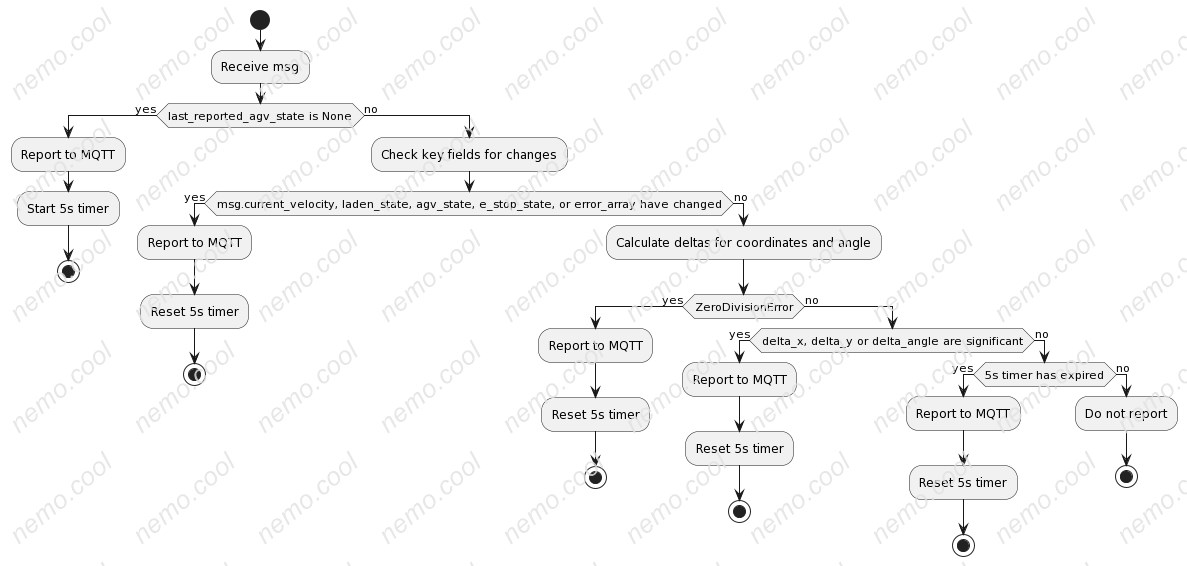
About the current state of the AGV, the sending strategy is that
{
    "agvid": "XXXXXXXXX",
    "timestamp": 1692861317.338879,
    "boot_count": 5,
    "subtopic":"state",
    "data":
    {
        ...
    }
}
“subtopic”:“action”
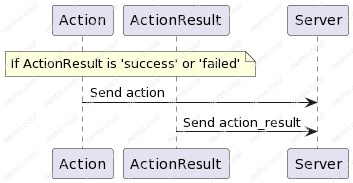
About AGV`s action content, like which one, what it is. Attention! this topic is not sent often, if action_result is in [SUCCESS, FAILED], it will be sent with result to server.
{
    "agvid": "XXXXXXXXX",
    "timestamp": 1692861317.338879,
    "boot_count": 5,
    "subtopic":"action",
    "data":
    {
        ...
    }
}
“subtopic”:“action_result”
About AGV’s action result, contains the action result and result message.
{
    "agvid": "XXXXXXXXX",
    "timestamp": 1692861317.338879,
    "boot_count": 5,
    "subtopic":"action_result",
    "data":
    {
        ...
    }
}
“subtopic”:“battery”
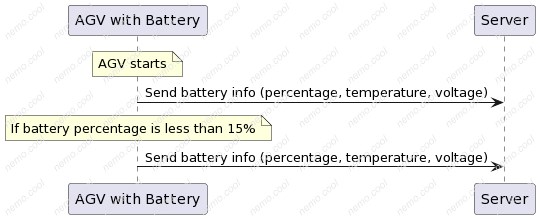
Through AGV’s battery hardware info, we can get the percentage and temperature or voltage of the battery. It will be sent every time AGV starts once, and if the percentage is less than 15%, it will also be sent.
{
    "agvid": "XXXXXXXXX",
    "timestamp": 1692861317.338879,
    "boot_count": 5,
    "subtopic":"battery",
    "data":
    {
        ...
    }
}
“subtopic”:“cam_bottom”
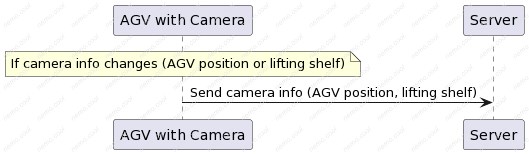
About AGV’s camera info, from this topic we can find out which point AGV is on or which shelf AGV is lifting, it is sent to server only when it changes.
{
    "agvid": "XXXXXXXXX",
    "timestamp": 1692861317.338879,
    "boot_count": 5,
    "subtopic":"cam_bottom",
    "data":
    {
         ...
    }
}
“subtopic”:“cam_top”
{
    "agvid": "XXXXXXXXX",
    "timestamp": 1692861317.338879,
    "boot_count": 5,
    "subtopic":"cam_top",
    "data":
    {
         ...
    }
}
“subtopic”:“app_shutdown_request”
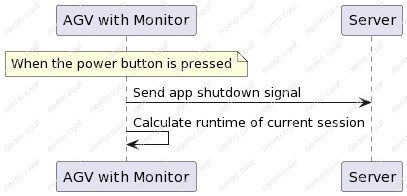
Regarding the AGV’s application shutdown signal, when the power button is pressed, the monitor receives the topic and calculates the runtime of the current session.
{
    "agvid": "XXXXXXXXX",
    "timestamp": 1692861317.338879,
    "boot_count": 5,
    "subtopic":"app_shutdown_request",
    "data":
    {
         ...
    }
}
agv/system/{agv_id}
These topics mean that the messages received from the computer in AGV, we can know the usage of the system to avoid the full used in space or memory, also include the CPU`s temperature to make sure the stabilised of the system.
“subtopic”:“system_usage”
This topic contains the system usage such as disk space, memory, cpu. It would be sent when the system starts or the temperature is over 70℃, we can find the top 5 program by cpu usage.
{
    "agvid": "XXXXXXXXX",
    "timestamp": 1692861317.338879,
    "boot_count": 5,
    "subtopic":"system_usage",
    "data":
    {
        ...
    }
}
agv/serial/{agv_id}
These topics mean that got from serial port, contain the underlying hardware data, plays a very important role in the diagnosis and prediction of equipment failures.
“subtopic”:“serial_error”
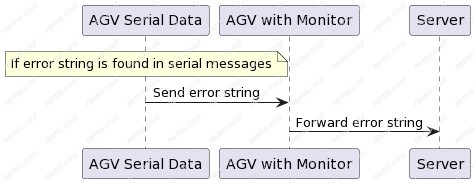
If the error string is found in serial messages, the agvSerialData will send it to the monitor, then to the server.
{
    "agvid": "XXXXXXXXX",
    "timestamp": 1692861317.338879,
    "boot_count": 5,
    "subtopic":"serial_error",
    "data":
    {
       ...
    }
}
Annotation
boot_count
boot_count is the number of times Ubuntu is booted on Pi. Then we can find out which topics belong to which runtimes in InfluxDB. It is very easy to discuss the AGV working situation in one time.
"boot_count": 1~+, # normal
"boot_count": -1, # file read error
Structure of the Database
agvMonitor Datebase
Select database
As for the kinds of data from AGV include : State Machine data, Hardware health date, the content of these date MQTT structure like that:
"topic":"state"
“subtopic”:“state”
{
    "agvid": "XXXXXXXXX",
    "timestamp": 1692861317.338879,
    "boot_count": 5,
    "subtopic":"state",
    "data":
    {
        ...
    }
}
It contains the ID of AGV, timestamp of the message send, boot_count means the PI starts times, subtopic means the more info to find out which topic.
It is easy to find out that these messages are time serial data just like generating by running of AGV. For store it easier and fast find or polymerize, we need the database can store these message by timestamp.
InfluxDB can meet all of these needs.
Structure of the Database
Because of the nature of InfluxDB:
Database
|
|--- Measurement (such as Table)
      |
      |--- Tags (such as Indexed Columns)
      |
      |--- Fields (such as Non-indexed Columns)
      |
      |--- Time
To track the entire lifecycle of an AGV, we set the ID of the AGV as the measurement, set tags include:
- level:
- normal
- error
- fatal
- topic:
- state
- subtopic:
- state
- boot_count:
- 2
Then the structure of the AGV Data Cloud is :
AGV Data Cloud
|
|--- Measurement: AGV_ID_1
|     |
|     |--- Tags
|     |     |
|     |     |--- level
|     |     |
|     |     |--- topic
|     |     |
|     |     |--- subtopic
|     |     |
|     |     |--- boot_count
|     |
|     |--- Fields
|     |     |
|     |     |--- [data fields here]
|     |
|     |--- Time
|
|--- Measurement: AGV_ID_2
|     |
|     |--- Tags
|     |     |
|     |     |--- level
|     |     |
|     |     |--- topic
|     |     |
|     |     |--- subtopic
|     |     |
|     |     |--- boot_count
|     |
|     |--- Fields
|     |     |
|     |     |--- [data fields here]
|     |
|     |--- Time
|
... (and so on for each AGV)
Over time, the data points are inserted on the database in the following way as illustrated in the figure below, if the connection between the robot and the server is interrupted during the data sending of DP2,DP3 and the data cannot be sent, when the connection is restored, these two data points will still be inserted between DP1 and DP4 instead of the nearest place.
Time (timeline): T1 -----> T2 -----> T3 -----> T4 -----> T5 -----> ... -----> Tn
Data points   :  DP1      DP2       DP3       DP4       DP5                DPn
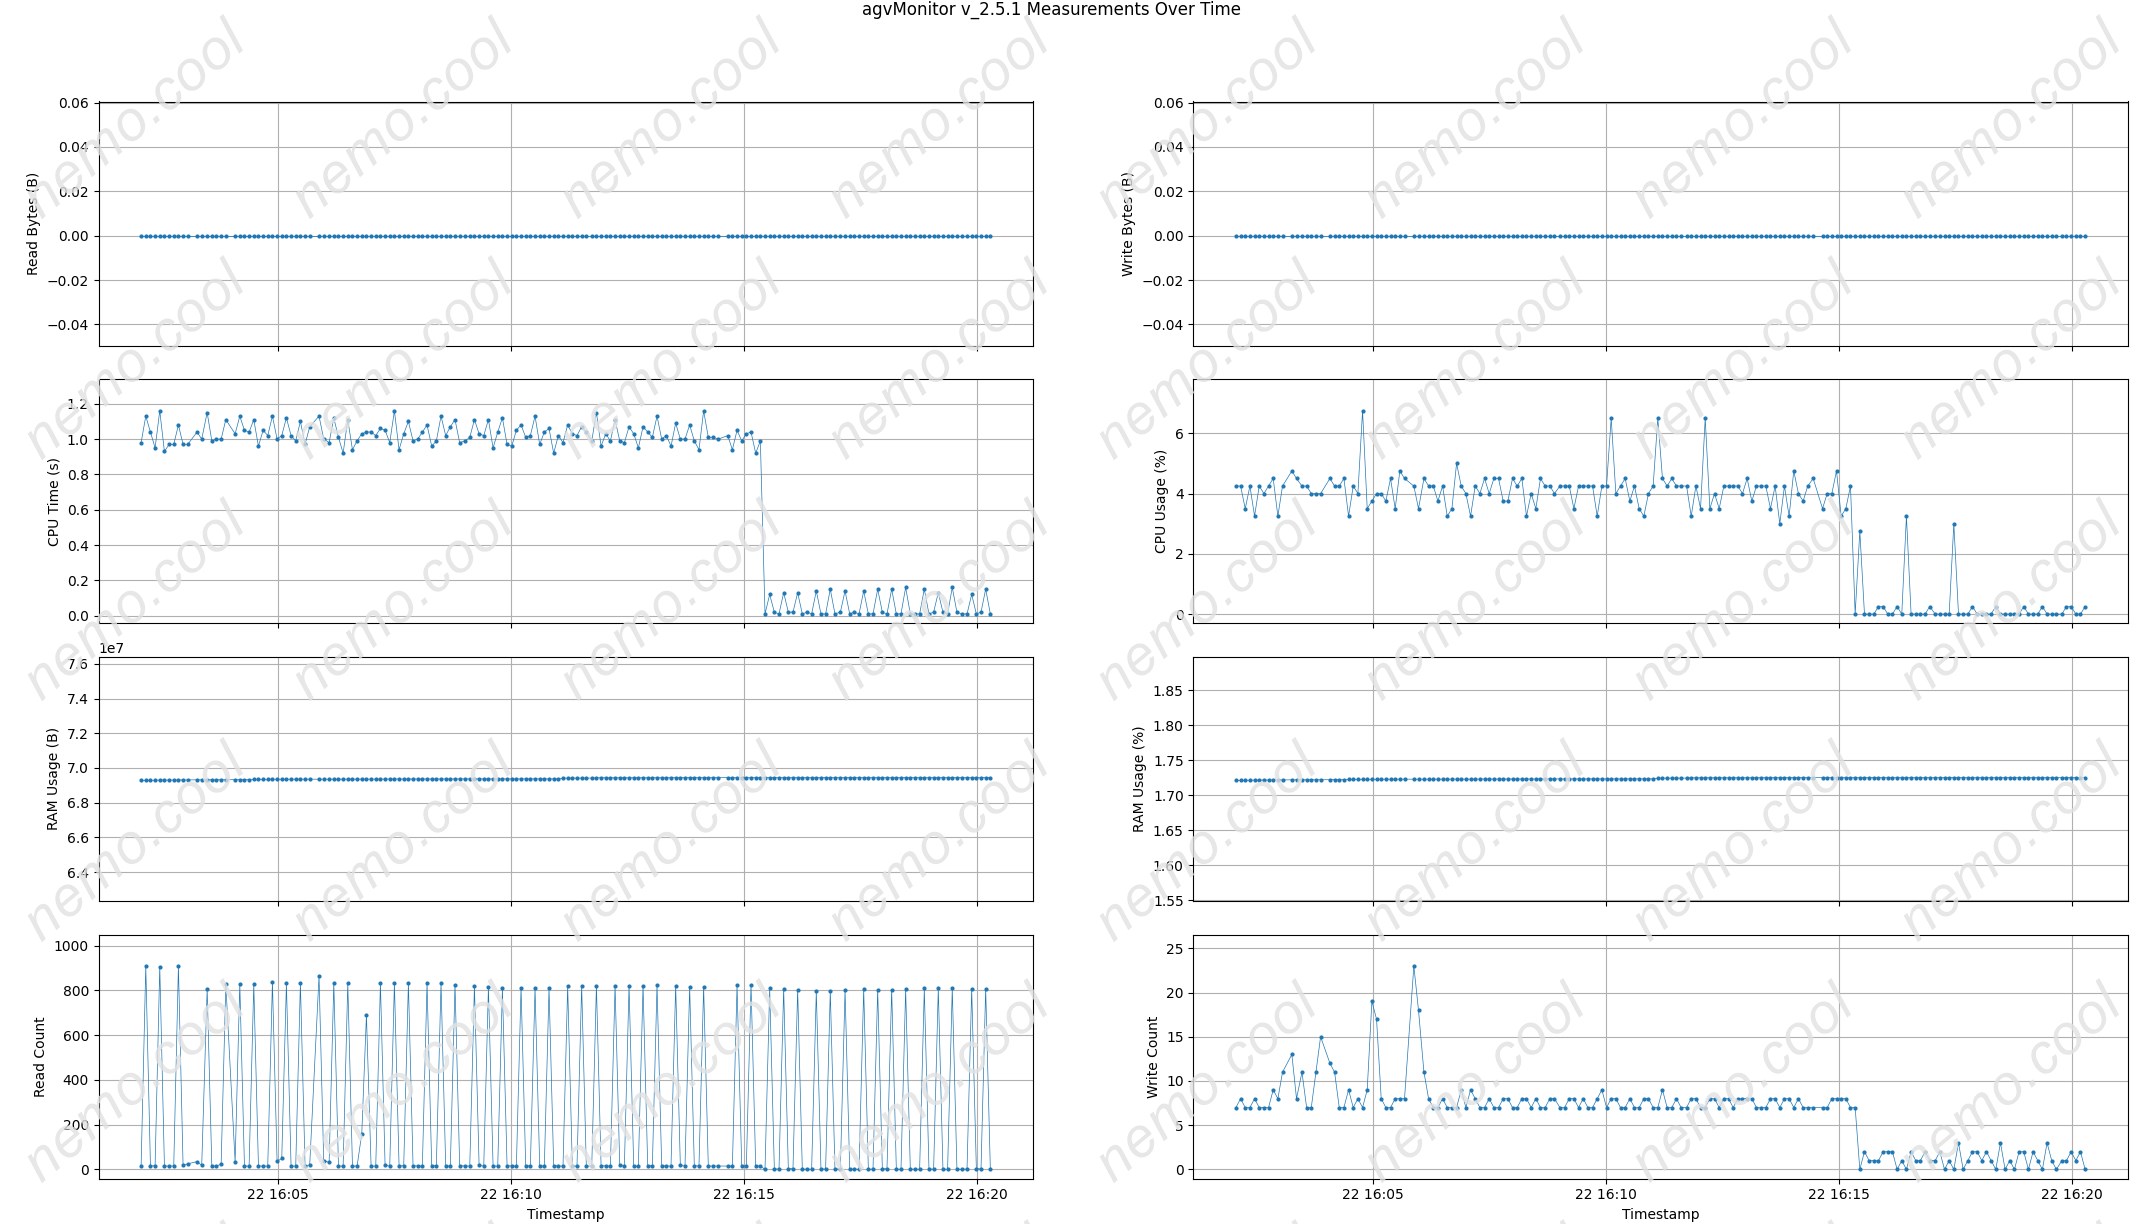
Programme resource usage
agvMonitor