惯性聚合 高效追踪和阅读你感兴趣的博客、新闻、科技资讯
阅读原文 在惯性聚合中打开

推荐订阅源

cs.CL updates on arXiv.org
cs.AI updates on arXiv.org
Hacker News - Newest:
Hacker News - Newest: "LLM"
S
Security Affairs
PCI Perspectives
PCI Perspectives
Google Online Security Blog
W
WeLiveSecurity
www.infosecurity-magazine.com
Recent Commits to openclaw:main
P
Privacy & Cybersecurity Law Blog
Threat Intelligence Blog | Flashpoint
S
Security @ Cisco Blogs
Security Archives - TechRepublic
Cyberwarzone
Cyberwarzone
L
Lohrmann on Cybersecurity
TaoSecurity Blog
TaoSecurity Blog
V
Visual Studio Blog
博客园 - 聂微东
Scott Helme
Scott Helme
博客园 - 【当耐特】
K
Kaspersky official blog
Security Latest
Security Latest
K
KPMG report finds enterprise disconnect between AI and its ROI | CIO
MyScale Blog
MyScale Blog
Schneier on Security
WordPress大学
WordPress大学
博客园 - 叶小钗
C
Check Point Blog
V2EX - 技术
V2EX - 技术
钛媒体:引领未来商业与生活新知
钛媒体:引领未来商业与生活新知
博客园 - Franky
T
Tor Project blog
Apple Machine Learning Research
让小产品的独立变现更简单 - ezindie.com
腾讯CDC
雷峰网
雷峰网
博客园_首页
美团技术团队
Y
Y Combinator Blog
C
CERT Recently Published Vulnerability Notes
AWS News Blog
AWS News Blog
月光博客
月光博客
N
Netflix TechBlog - Medium
Last Week in AI
Last Week in AI
Recent Announcements
Google DeepMind News
Help Net Security
Help Net Security
P
Proofpoint News Feed
MongoDB | Blog
MongoDB | Blog
C
Cybersecurity and Infrastructure Security Agency CISA

Ivan on Containers, Kubernetes, and Server-Side

A grounded take on agentic coding for production environments Server-Side Playgrounds Reimagined: Build, Boot, and Network Your Own Virtual Labs [not a] Kubernetes 101 - Pods, Deployments, and Services As an Attempt To Automate Age-Old Infra Patterns JavaScript or TypeScript? How To Benefit From the Dichotomy On Software Design... and Good Writing Building a Firecracker-Powered Course Platform To Learn Docker and Kubernetes How To Publish a Port of a Running Container What Actually Happens When You Publish a Container Port A Visual Guide to SSH Tunnels: Local and Remote Port Forwarding Debugging Containers Like a Pro Docker: How To Debug Distroless And Slim Containers How To Extract Container Image Filesystem Using Docker | iximiuz Labs In Pursuit of Better Container Images: Alpine, Distroless, Apko, Chisel, DockerSlim, oh my! How To Start Programming In Go: Advice For Fellow DevOps Engineers Kubernetes Ephemeral Containers and kubectl debug Command How To Develop Kubernetes CLIs Like a Pro Docker Container Commands Explained: Understand, Don't Memorize | iximiuz Labs Learning Docker with Docker - Toying With DinD For Fun And Profit How To Extend Kubernetes API - Kubernetes vs. Django The Influence of Plumbing on Programming How To Call Kubernetes API from Go - Types and Common Machinery How To Call Kubernetes API using Simple HTTP Client Kubernetes API Basics - Resources, Kinds, and Objects OpenFaaS - Run Containerized Functions On Your Own Terms Learning Containers From The Bottom Up Docker Containers vs. Kubernetes Pods - Taking a Deeper Look | iximiuz Labs Learn-by-Doing Platforms for Dev, DevOps, and SRE Folks How HTTP Keep-Alive can cause TCP race condition How to Work with Container Images Using ctr | iximiuz Labs Multiple Containers, Same Port, no Reverse Proxy... Exploring Go net/http Package - On How Not To Set Socket Options Disposable Local Development Environments with Vagrant, Docker, and Arkade DevOps, SRE, and Platform Engineering My Choice of Programming Languages Prometheus Is Not a TSDB How to learn PromQL with Prometheus Playground Rust - Writing Parsers With nom Parser Combinator Framework pq - parse and query log files as time series Prometheus Cheat Sheet - Moving Average, Max, Min, etc (Aggregation Over Time) Prometheus Cheat Sheet - How to Join Multiple Metrics (Vector Matching) The Need For Slimmer Containers Understanding Rust Privacy and Visibility Model Bridge vs. Switch: Takeaways from a Real Data Center Tour | iximiuz Labs From LAN to VXLAN: Networking Basics for Non-Network Engineers | iximiuz Labs KiND - How I Wasted a Day Loading Local Docker Images Go, HTTP handlers, panic, and deadlocks Exploring Kubernetes Operator Pattern Making Sense Out Of Cloud Native Buzz Service Discovery in Kubernetes: Combining the Best of Two Worlds API Developers Never REST How Container Networking Works: Building a Bridge Network From Scratch | iximiuz Labs Traefik: canary deployments with weighted load balancing Service Proxy, Pod, Sidecar, oh my! You Need Containers To Build Images You Don't Need an Image To Run a Container Not Every Container Has an Operating System Inside Working with container images in Go Master Go While Learning Containers Implementing Container Runtime Shim: Interactive Containers How to use Flask with gevent (uWSGI and Gunicorn editions) My 10 Years of Programming Experience Implementing Container Runtime Shim: First Code Implementing Container Runtime Shim: runc Kubernetes Repository On Flame Dealing with process termination in Linux (with Rust examples) conman - [the] Container Manager: Inception Journey From Containerization To Orchestration And Beyond Linux PTY - How docker attach and docker exec Commands Work Inside Illustrated introduction to Linux iptables From Docker Container to Bootable Linux Disk Image Пишем свой веб-сервер на Python: протокол HTTP 9001 способ создать веб-сервер на Python Explaining async/await in 200 lines of code Explaining event loop in 100 lines of code Save the day with gevent Пишем свой веб-сервер на Python: процессы, потоки и асинхронный I/O Truly optional scalar types in protobuf3 (with Go examples) Node.js Writable streams distilled Node.js Readable streams distilled How to on starting processes (mostly in Linux) Дайджест интересных ссылок – Июль 2016 Пишем свой веб-сервер на Python: сокеты Наследование в JavaScript Мастерить!
Prometheus Cheat Sheet - Basics (Metrics, Labels, Time Series, Scraping)
Ivan Velichko · 2021-07-24 · via Ivan on Containers, Kubernetes, and Server-Side

Here we focus on the most basic Prometheus concepts - metrics, labels, scrapes, and time series.

What is a metric?

In Prometheus, everything revolves around metrics. A metric is a feature (i.e., a characteristic) of a system that is being measured. Typical examples of metrics are:

  • http_requests_total
  • http_request_size_bytes
  • system_memory_used_bytes
  • node_network_receive_bytes_total

Prometheus metrics

What is a label?

The idea of a metric seems fairly simple. However, there is a problem with such simplicity. On the diagram above, Prometheus monitors several application servers simultaneously. Each of these servers reports mem_used_bytes metric. At any given time, how should Prometheus store multiple samples behind a single metric name?

The first option is aggregation. Prometheus could sum up all the bytes and store the total memory usage of the whole fleet. Or compute an average memory usage and store it. Or min/max memory usage. Or compute and store all of those together. However, there is always a problem with storing only aggregated metrics - we wouldn't be able to pin down a particular server with a bizarre memory usage pattern based on such data.

Luckily, Prometheus uses another approach - it can differentiate samples with the same metric name by labeling them. A label is a certain attribute of a metric. Generally, labels are populated by metric producers (servers in the example above). However, in Prometheus, it's possible to enrich a metric with some static labels based on the producer's identity while recording it on the Prometheus node's side. In the wild, it's common for a Prometheus metric to carry multiple labels.

Typical examples of labels are:

  • instance - an instance (a server or cronjob process) of a job being monitored in the <host>:<port> form
  • job - a name of a logical group of instances sharing the same purpose
  • endpoint - name of an HTTP API endpoint
  • method - HTTP method
  • status_code - HTTP status code

Prometheus labels

What is scraping?

There are two principally different approaches to collect metrics. A monitoring system can have a passive or active collector component. In the case of a passive collector, samples are constantly pushed by active instances to the collector. In contrast, an active collector periodically pulls samples from instances that passively expose them.

Prometheus uses a pull model, and the metric collection process is called scraping.

In a system with a passive collector, there is no need to register monitored instances upfront. Instead, you need to communicate the address of the collector endpoint to the instances, so they could start pushing data. However, in the case of an active collector, one should supply the list of instances to be scraped beforehand. Or teach the monitoring system how to build such a list dynamically using one of the supported service discovery mechanisms.

In Prometheus, scraping is configured via providing a static list of <host>:<port> scraping targets. It's also possible to configure a service-discovery-specific (consul, docker, kubernetes, ec2, etc.) endpoint to fetch such a list at runtime. You also need to specify a scrape interval - a delay between any two consecutive scrapes. Surprisingly or not, it's common for such an interval to be several seconds or even tens of seconds long.

For a monitoring system, the design choice to use a pull model and relatively long scrape intervals have some interesting repercussions...

What is a time series in Prometheus?

Side note 1: Despite being born in the age of distributed systems, every Prometheus server node is autonomous. I.e., there is no distributed metric storage in the default Prometheus setup, and every node acts as a self-sufficient monitoring server with local metric storage. It simplifies a lot of things, including the following explanation, because we don't need to think of how to merge overlapping series from different Prometheus nodes 😉

Prometheus series

In general, a stream of timestamped values is called a time series. In the above example, there are four different time series. But only two metric names. I.e., a time series in Prometheus is defined by a combination of a metric name and a particular set of key-value labels.

Side note 2: Values are always floating-point numbers; timestamps are integers storing the number of milliseconds since the Unix epoch.

Every such time series is stored separately on the Prometheus node in the form of an append-only file. Since a series is defined by the label value(s), one needs to be careful with labels that might have high cardinality.

The terms time series, series, and metric are often used interchangeably. However, in Prometheus, a metric technically means a group of [time] series.

Downsides of active scraping

Since it's a single node scraping multiple distributed endpoints with potentially different performance and network conditions, the exact sample timestamps will (although most of the time just slightly) vary for every scrape. Because of that and of the potential loss of some scrapes, the interval between two samples in a given time series is neither constant nor multiplication of the scrape interval. Remember the repercussions I mentioned above?

Missing scrapes illustration

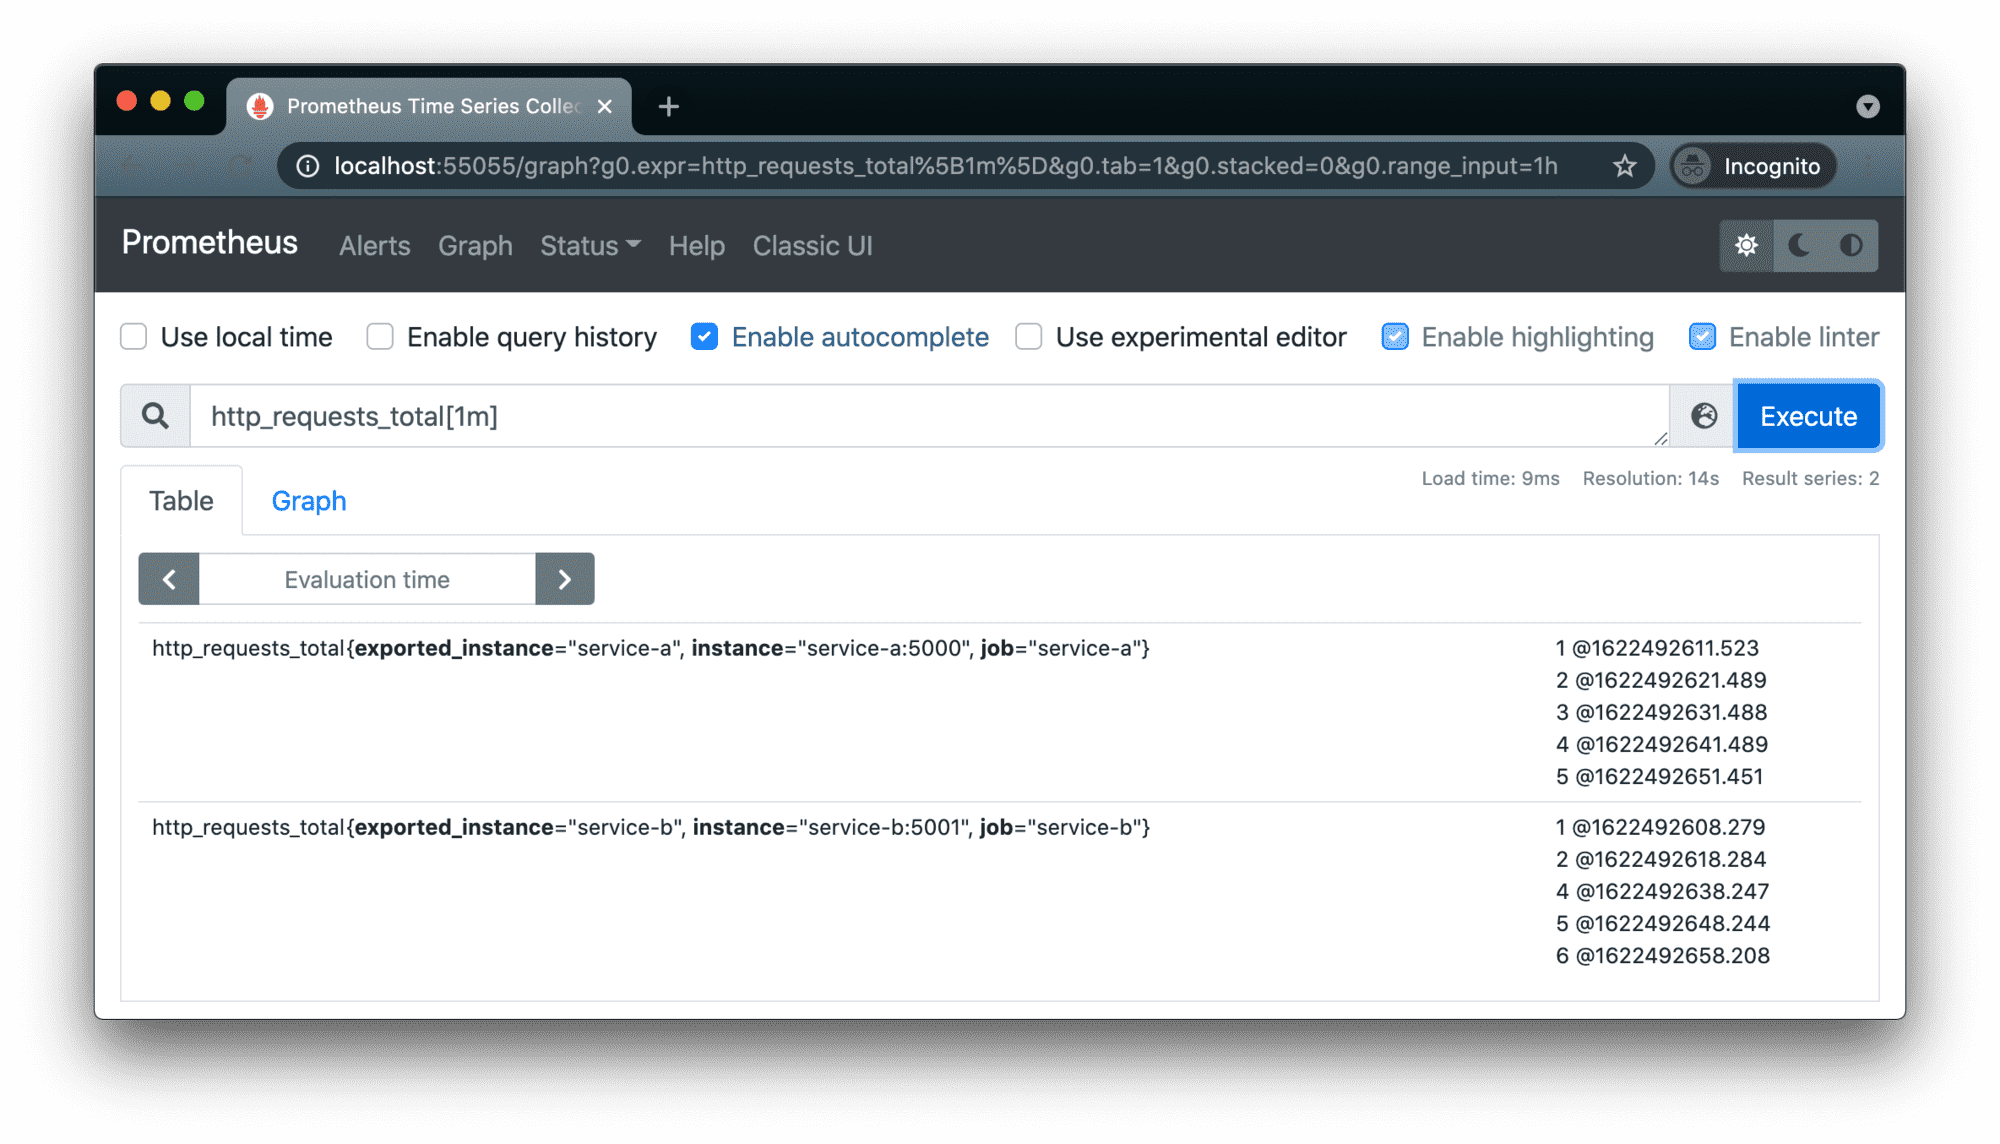
Prometheus node scraping two services every 10 seconds - actual samples aren't ideally aligned in time.

There is another interesting, more important pitfall to be aware of. If a target reports a gauge (i.e., instant measurement) metric that changes more frequently than it's scraped, the intermediate values will never be seen by the Prometheus node. Thus, it may cause blindness of the monitoring system to some bizarre patterns:

Obviously, counter (i.e., monotonically incrementing measurement) metrics don't have such a problem.