



惯性聚合 高效追踪和阅读你感兴趣的博客、新闻、科技资讯
阅读原文 在惯性聚合中打开

推荐订阅源

T
Tenable Blog
K
Kaspersky official blog
cs.AI updates on arXiv.org
T
The Exploit Database - CXSecurity.com
Cisco Talos Blog
Cisco Talos Blog
P
Palo Alto Networks Blog
Latest news
Latest news
cs.CL updates on arXiv.org
C
CXSECURITY Database RSS Feed - CXSecurity.com
P
Privacy International News Feed
The Hacker News
The Hacker News
T
Tor Project blog
www.infosecurity-magazine.com
C
Cisco Blogs
阮一峰的网络日志
阮一峰的网络日志
Recent Commits to openclaw:main
博客园_首页
N
News and Events Feed by Topic
W
WeLiveSecurity
罗磊的独立博客
GbyAI
GbyAI
T
Troy Hunt's Blog
Y
Y Combinator Blog
Recorded Future
Recorded Future
The Cloudflare Blog
TaoSecurity Blog
TaoSecurity Blog
爱范儿
爱范儿
美团技术团队
Attack and Defense Labs
C
Check Point Blog
Engineering at Meta
Engineering at Meta
Cyberwarzone
Cyberwarzone
Cyber Security Advisories - MS-ISAC
F
Fortinet All Blogs
The GitHub Blog
The GitHub Blog
奇客Solidot–传递最新科技情报
奇客Solidot–传递最新科技情报
Apple Machine Learning Research
Know Your Adversary
Know Your Adversary
AWS News Blog
AWS News Blog
D
DataBreaches.Net
Recent Announcements
K
KPMG report finds enterprise disconnect between AI and its ROI | CIO
M
MIT News - Artificial intelligence
Webroot Blog
Webroot Blog
Security Latest
Security Latest
T
Tailwind CSS Blog
V2EX - 技术
V2EX - 技术
aimingoo的专栏
aimingoo的专栏
S
Security @ Cisco Blogs
Exploit-DB.com RSS Feed

Ivan on Containers, Kubernetes, and Server-Side

A grounded take on agentic coding for production environments Server-Side Playgrounds Reimagined: Build, Boot, and Network Your Own Virtual Labs [not a] Kubernetes 101 - Pods, Deployments, and Services As an Attempt To Automate Age-Old Infra Patterns JavaScript or TypeScript? How To Benefit From the Dichotomy On Software Design... and Good Writing Building a Firecracker-Powered Course Platform To Learn Docker and Kubernetes How To Publish a Port of a Running Container What Actually Happens When You Publish a Container Port A Visual Guide to SSH Tunnels: Local and Remote Port Forwarding Debugging Containers Like a Pro Docker: How To Debug Distroless And Slim Containers How To Extract Container Image Filesystem Using Docker | iximiuz Labs In Pursuit of Better Container Images: Alpine, Distroless, Apko, Chisel, DockerSlim, oh my! How To Start Programming In Go: Advice For Fellow DevOps Engineers Kubernetes Ephemeral Containers and kubectl debug Command How To Develop Kubernetes CLIs Like a Pro Docker Container Commands Explained: Understand, Don't Memorize | iximiuz Labs Learning Docker with Docker - Toying With DinD For Fun And Profit How To Extend Kubernetes API - Kubernetes vs. Django The Influence of Plumbing on Programming How To Call Kubernetes API from Go - Types and Common Machinery How To Call Kubernetes API using Simple HTTP Client Kubernetes API Basics - Resources, Kinds, and Objects OpenFaaS - Run Containerized Functions On Your Own Terms Learning Containers From The Bottom Up Docker Containers vs. Kubernetes Pods - Taking a Deeper Look | iximiuz Labs Learn-by-Doing Platforms for Dev, DevOps, and SRE Folks How HTTP Keep-Alive can cause TCP race condition How to Work with Container Images Using ctr | iximiuz Labs Multiple Containers, Same Port, no Reverse Proxy... Exploring Go net/http Package - On How Not To Set Socket Options Disposable Local Development Environments with Vagrant, Docker, and Arkade DevOps, SRE, and Platform Engineering My Choice of Programming Languages Prometheus Is Not a TSDB How to learn PromQL with Prometheus Playground Prometheus Cheat Sheet - Basics (Metrics, Labels, Time Series, Scraping) Rust - Writing Parsers With nom Parser Combinator Framework pq - parse and query log files as time series Prometheus Cheat Sheet - How to Join Multiple Metrics (Vector Matching) The Need For Slimmer Containers Understanding Rust Privacy and Visibility Model Bridge vs. Switch: Takeaways from a Real Data Center Tour | iximiuz Labs From LAN to VXLAN: Networking Basics for Non-Network Engineers | iximiuz Labs KiND - How I Wasted a Day Loading Local Docker Images Go, HTTP handlers, panic, and deadlocks Exploring Kubernetes Operator Pattern Making Sense Out Of Cloud Native Buzz Service Discovery in Kubernetes: Combining the Best of Two Worlds API Developers Never REST How Container Networking Works: Building a Bridge Network From Scratch | iximiuz Labs Traefik: canary deployments with weighted load balancing Service Proxy, Pod, Sidecar, oh my! You Need Containers To Build Images You Don't Need an Image To Run a Container Not Every Container Has an Operating System Inside Working with container images in Go Master Go While Learning Containers Implementing Container Runtime Shim: Interactive Containers How to use Flask with gevent (uWSGI and Gunicorn editions) My 10 Years of Programming Experience Implementing Container Runtime Shim: First Code Implementing Container Runtime Shim: runc Kubernetes Repository On Flame Dealing with process termination in Linux (with Rust examples) conman - [the] Container Manager: Inception Journey From Containerization To Orchestration And Beyond Linux PTY - How docker attach and docker exec Commands Work Inside Illustrated introduction to Linux iptables From Docker Container to Bootable Linux Disk Image Пишем свой веб-сервер на Python: протокол HTTP 9001 способ создать веб-сервер на Python Explaining async/await in 200 lines of code Explaining event loop in 100 lines of code Save the day with gevent Пишем свой веб-сервер на Python: процессы, потоки и асинхронный I/O Truly optional scalar types in protobuf3 (with Go examples) Node.js Writable streams distilled Node.js Readable streams distilled How to on starting processes (mostly in Linux) Дайджест интересных ссылок – Июль 2016 Пишем свой веб-сервер на Python: сокеты Наследование в JavaScript Мастерить!
Prometheus Cheat Sheet - Moving Average, Max, Min, etc (Aggregation Over Time)
Ivan Velichko · 2021-06-28 · via Ivan on Containers, Kubernetes, and Server-Side

When you have a long series of numbers, such as server memory consumption scraped 10-secondly, it's a natural desire to derive another, probably more meaningful series from it, by applying a moving window function. For instance, moving average or moving quantile can give you much more readable results by smoothing some spikes.

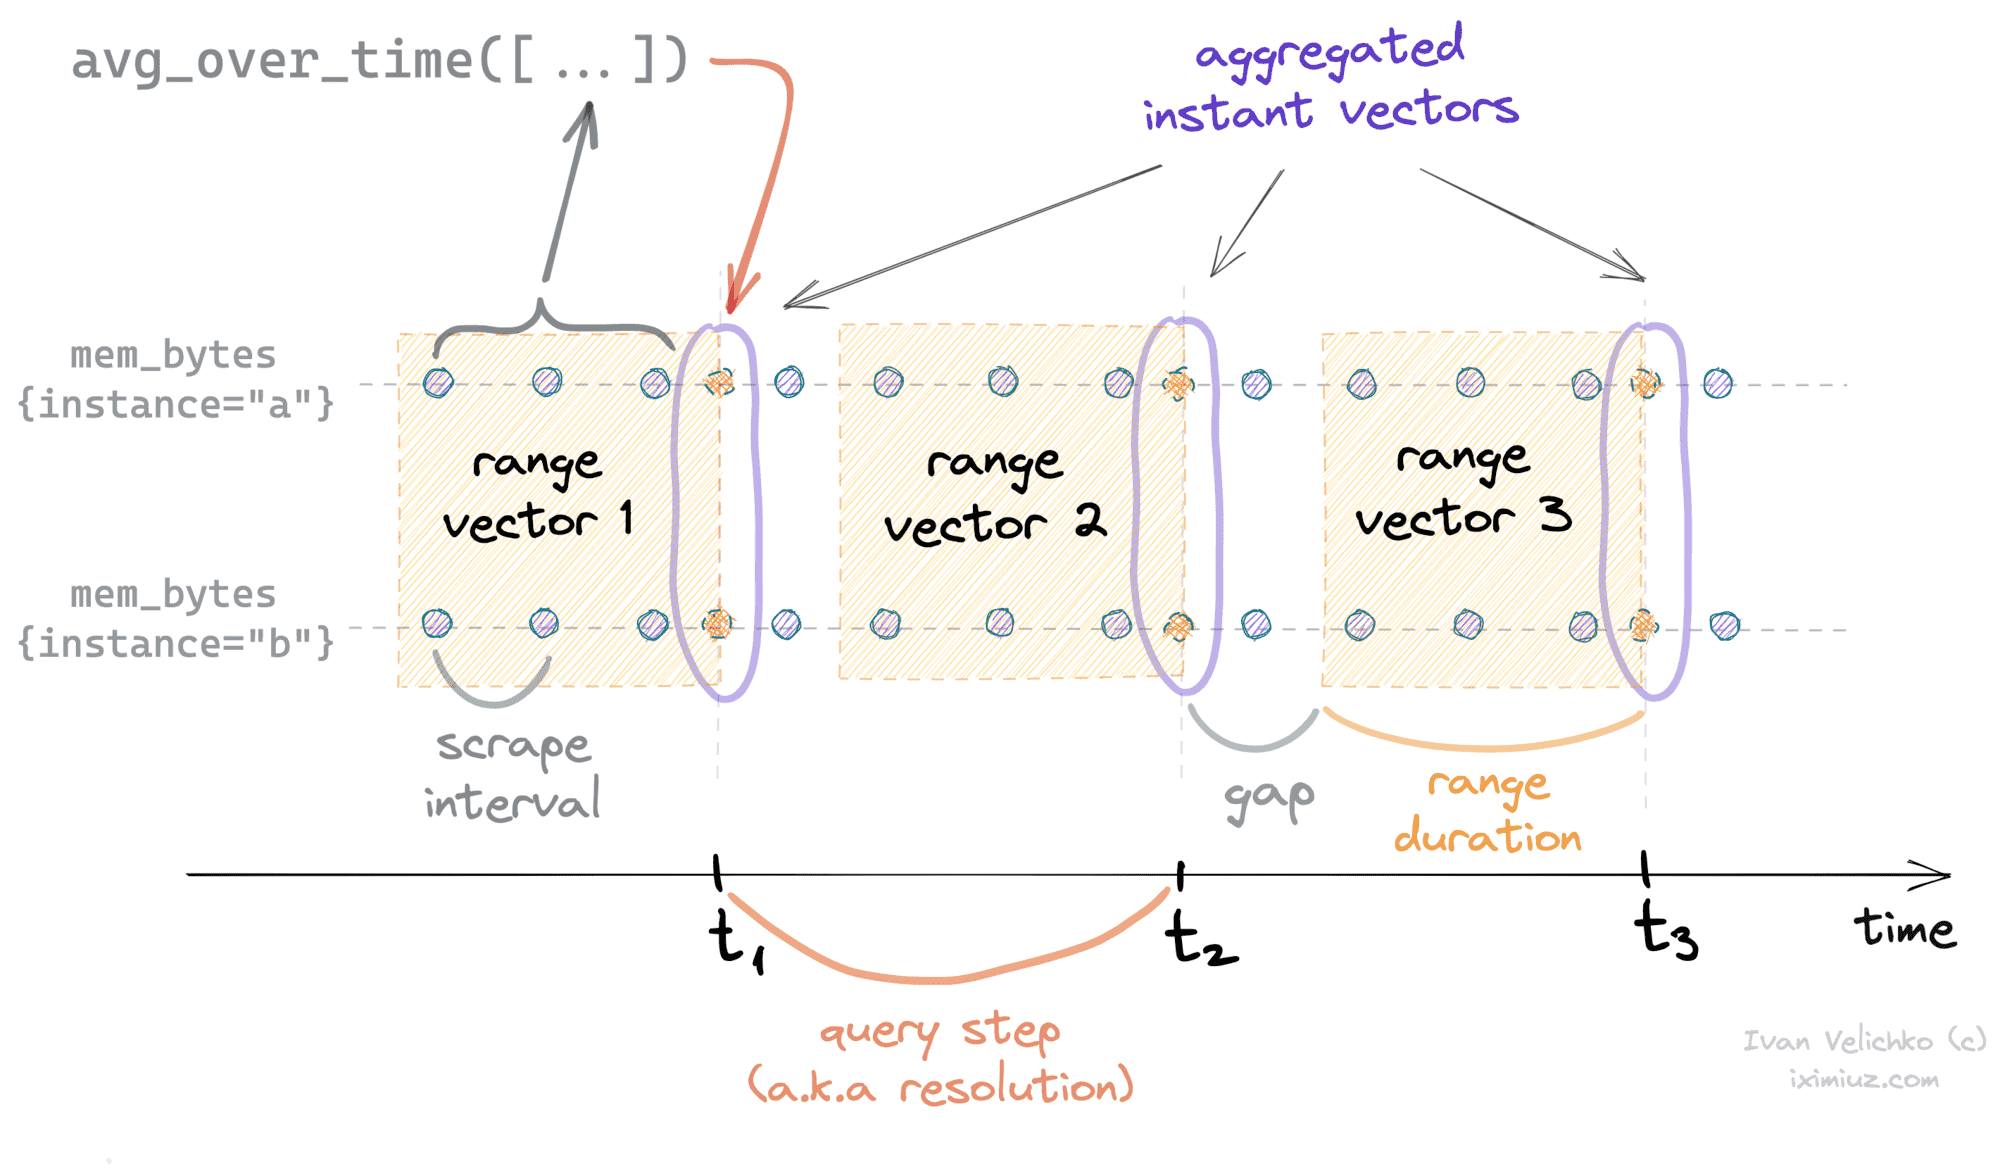
Prometheus has a bunch of functions called <smth>_over_time(). They can be applied only to range vectors. It essentially makes them window aggregation functions. Every such function takes in a range vector and produces an instant vector with elements being per-series aggregations.

For people like me who normally grasp code faster than text, here is some pseudocode of the aggregation logic:

# Input vector example.
range_vector = [
    ({"lab1": "val1", "lab2": "val2"}, [(12, 1624722138), (11, 1624722148), (17, 1624722158)]),
    ({"lab1": "val1", "lab2": "val2"}, [(14, 1624722138), (10, 1624722148), (13, 1624722158)]),
    ({"lab1": "val1", "lab2": "val2"}, [(16, 1624722138), (12, 1624722148), (15, 1624722158)]),
    ({"lab1": "val1", "lab2": "val2"}, [(12, 1624722138), (17, 1624722148), (18, 1624722158)]),
]

# agg_func examples: `sum`, `min`, `max`, `avg`, `last`, etc.

def agg_over_time(range_vector, agg_func, timestamp):
    # The future instant vector.
    instant_vector = {"timestamp": timestamp, "elements": []}

    for (labels, samples) in range_vector:
        # Every instant vector element is 
        # an aggregation of multiple samples.
        sample = agg_func(samples)
        instant_vector["elements"].append((labels, sample))

    # Notice, that the timestamp of the resulting instant vector 
    # is the timestamp of the query execution. I.e., it may not 
    # match any of the timestamps in the input range vector.
    return instant_vector

Almost all the functions in the aggregation family accept just a single parameter - a range vector. It means that the over time part, i.e., the duration of the aggregation period, comes from the range vector definition itself.

The only way to construct a range vector in PromQL is by appending a bracketed duration to a vector selector. E.g. http_requests_total[5m]. Therefore, an <agg>_over_time() function can be applied only to a vector selector, meaning the aggregation will always be done using raw scrapes.

Another motivation for aggregating metrics over time comes from the fact that instant vectors of raw scrapes often are just glimpses of the actual state of your system. To facilitate graph plotting, Prometheus offers range API queries. Logically, a response of a range API query consists of a series of instant vectors, where each vector is one resolution step away from another. Depending on how lucky you are, you can miss important insights hidden in between any two consecutive vectors.

Unlike scalar elements of an instant vector, each element of the range vector is actually an array. Elements of such an array are scrape values falling into the corresponding time bucket. By applying an <agg>_over_time function to these buckets, we achieve a moving window effect that potentially can incorporate all data points without leaving any gaps. If the window duration is at least one resolution step long, none of the available data points will be discarded.
PromQL Functions - aggregation over time

Grafana tip: use $__interval built-in variable for your range vector durations.

min, max, avg, sum, stddev, stdvar over time

The naming makes the purpose of these functions quite obvious. For instance, avg_over_time() is what you may use to compute a moving average of some metric. Similarly, stddev_over_time() can be used to produce a moving standard deviation.

However, there is always a caveat. Prometheus supports different logical types of metrics - gauges, counters, histograms, and summaries. Surprisingly or not, physically, there is no difference between these types. All of them are just stored as series of float numbers. PromQL doesn't really distinguish between the logical types of metrics either. What only matters for PromQL is an expression type. I.e., it wouldn't allow you to call a function that expects an instant vector with a range vector argument. However, a range vector of gauges is physically indistinguishable from a range vector of counters. And here we go...

functions min_over_time(), max_over_time(), avg_over_time(), sum_over_time(), stddev_over_time(), and stdvar_over_time() makes sense to use only with gauge metrics.

Just think of it for a second. If you call, say, min_over_time() on a range vector of counters, it'd always return the left-most sample.

quantile_over_time()

quantile_over_time(scalar, range-vector) - this is the only one that takes two parameters: a scalar defining the quantile to compute and a range vector.

last_over_time()

last_over_time(http_requests_total[5m]) is pretty much the same as just http_requests_total. If we take the very last sample from every element of a range vector, the resulting vector will be identical to a regular instant vector query. The only usage that comes to mind is to be able to manipulate the lookback window on the fly.

While constructing an instant vector, Prometheus looks up to 5 minutes back from the queried timestamp. For every metric, the very last sample falling into the [t - 5m, t] time range is then added to the resulting vector. The 5m delta is a heuristical value that can be changed by providing --query.lookback-delta command-line parameter. However, changing it would require a server restart. Via using last_over_time(<vector_selector>[<duration>]) we can control the lookback delta duration at runtime.

count_over_time()

count_over_time() counts the number of samples for each element of the range vector. The actual values of the samples are disregarded. Thus, the resulting instant vector will just represent the number of scrapes per series falling into the requested time frame.