
惯性聚合 高效追踪和阅读你感兴趣的博客、新闻、科技资讯
阅读原文 在惯性聚合中打开

推荐订阅源

奇客Solidot–传递最新科技情报
奇客Solidot–传递最新科技情报
L
LINUX DO - 最新话题
Recorded Future
Recorded Future
月光博客
月光博客
博客园 - 【当耐特】
博客园 - 叶小钗
宝玉的分享
宝玉的分享
量子位
雷峰网
雷峰网
博客园 - 三生石上(FineUI控件)
The Cloudflare Blog
Vercel News
Vercel News
L
LangChain Blog
B
Blog
Y
Y Combinator Blog
爱范儿
爱范儿
GbyAI
GbyAI
S
Security @ Cisco Blogs
T
The Blog of Author Tim Ferriss
A
About on SuperTechFans
博客园 - Franky
P
Palo Alto Networks Blog
Threat Intelligence Blog | Flashpoint
云风的 BLOG
云风的 BLOG
C
Cisco Blogs
Scott Helme
Scott Helme
I
Intezer
T
The Exploit Database - CXSecurity.com
MyScale Blog
MyScale Blog
T
Tor Project blog
D
Darknet – Hacking Tools, Hacker News & Cyber Security
T
Troy Hunt's Blog
N
News and Events Feed by Topic
大猫的无限游戏
大猫的无限游戏
F
Fortinet All Blogs
www.infosecurity-magazine.com
Application and Cybersecurity Blog
Cyber Security Advisories - MS-ISAC
S
Security Affairs
Cyberwarzone
Cyberwarzone
PCI Perspectives
PCI Perspectives
小众软件
小众软件
D
DataBreaches.Net
Exploit-DB.com RSS Feed
Know Your Adversary
Know Your Adversary
Forbes - Security
Forbes - Security
S
Securelist
cs.CV updates on arXiv.org
C
Cyber Attacks, Cyber Crime and Cyber Security
The Last Watchdog
The Last Watchdog

Ivan on Containers, Kubernetes, and Server-Side

A grounded take on agentic coding for production environments Server-Side Playgrounds Reimagined: Build, Boot, and Network Your Own Virtual Labs [not a] Kubernetes 101 - Pods, Deployments, and Services As an Attempt To Automate Age-Old Infra Patterns JavaScript or TypeScript? How To Benefit From the Dichotomy On Software Design... and Good Writing Building a Firecracker-Powered Course Platform To Learn Docker and Kubernetes How To Publish a Port of a Running Container What Actually Happens When You Publish a Container Port A Visual Guide to SSH Tunnels: Local and Remote Port Forwarding Debugging Containers Like a Pro Docker: How To Debug Distroless And Slim Containers How To Extract Container Image Filesystem Using Docker | iximiuz Labs In Pursuit of Better Container Images: Alpine, Distroless, Apko, Chisel, DockerSlim, oh my! How To Start Programming In Go: Advice For Fellow DevOps Engineers Kubernetes Ephemeral Containers and kubectl debug Command How To Develop Kubernetes CLIs Like a Pro Docker Container Commands Explained: Understand, Don't Memorize | iximiuz Labs Learning Docker with Docker - Toying With DinD For Fun And Profit How To Extend Kubernetes API - Kubernetes vs. Django The Influence of Plumbing on Programming How To Call Kubernetes API from Go - Types and Common Machinery How To Call Kubernetes API using Simple HTTP Client Kubernetes API Basics - Resources, Kinds, and Objects OpenFaaS - Run Containerized Functions On Your Own Terms Learning Containers From The Bottom Up Docker Containers vs. Kubernetes Pods - Taking a Deeper Look | iximiuz Labs Learn-by-Doing Platforms for Dev, DevOps, and SRE Folks How HTTP Keep-Alive can cause TCP race condition How to Work with Container Images Using ctr | iximiuz Labs Multiple Containers, Same Port, no Reverse Proxy... Exploring Go net/http Package - On How Not To Set Socket Options Disposable Local Development Environments with Vagrant, Docker, and Arkade DevOps, SRE, and Platform Engineering My Choice of Programming Languages Prometheus Is Not a TSDB Prometheus Cheat Sheet - Basics (Metrics, Labels, Time Series, Scraping) Rust - Writing Parsers With nom Parser Combinator Framework pq - parse and query log files as time series Prometheus Cheat Sheet - Moving Average, Max, Min, etc (Aggregation Over Time) Prometheus Cheat Sheet - How to Join Multiple Metrics (Vector Matching) The Need For Slimmer Containers Understanding Rust Privacy and Visibility Model Bridge vs. Switch: Takeaways from a Real Data Center Tour | iximiuz Labs From LAN to VXLAN: Networking Basics for Non-Network Engineers | iximiuz Labs KiND - How I Wasted a Day Loading Local Docker Images Go, HTTP handlers, panic, and deadlocks Exploring Kubernetes Operator Pattern Making Sense Out Of Cloud Native Buzz Service Discovery in Kubernetes: Combining the Best of Two Worlds API Developers Never REST How Container Networking Works: Building a Bridge Network From Scratch | iximiuz Labs Traefik: canary deployments with weighted load balancing Service Proxy, Pod, Sidecar, oh my! You Need Containers To Build Images You Don't Need an Image To Run a Container Not Every Container Has an Operating System Inside Working with container images in Go Master Go While Learning Containers Implementing Container Runtime Shim: Interactive Containers How to use Flask with gevent (uWSGI and Gunicorn editions) My 10 Years of Programming Experience Implementing Container Runtime Shim: First Code Implementing Container Runtime Shim: runc Kubernetes Repository On Flame Dealing with process termination in Linux (with Rust examples) conman - [the] Container Manager: Inception Journey From Containerization To Orchestration And Beyond Linux PTY - How docker attach and docker exec Commands Work Inside Illustrated introduction to Linux iptables From Docker Container to Bootable Linux Disk Image Пишем свой веб-сервер на Python: протокол HTTP 9001 способ создать веб-сервер на Python Explaining async/await in 200 lines of code Explaining event loop in 100 lines of code Save the day with gevent Пишем свой веб-сервер на Python: процессы, потоки и асинхронный I/O Truly optional scalar types in protobuf3 (with Go examples) Node.js Writable streams distilled Node.js Readable streams distilled How to on starting processes (mostly in Linux) Дайджест интересных ссылок – Июль 2016 Пишем свой веб-сервер на Python: сокеты Наследование в JavaScript Мастерить!
How to learn PromQL with Prometheus Playground
Ivan Velichko · 2021-07-24 · via Ivan on Containers, Kubernetes, and Server-Side

Working with real metrics is hard. Metrics are needed to give you an understanding of how your service behaves. That is, by definition, you have some uncertainty about the said behavior. Therefore, you have to be hell certain about your observability part. Otherwise, all sorts of metric misinterpretations and false conclusions will follow.

Here are the things I'm always trying to get confident about as soon as possible:

  • How metric collection works - push vs. pull model, aggregation on the client- or server-side?
  • How metrics are stored - raw samples or aggregated data, rollup and retention strategies?
  • How to query metrics - is my mental model aligned with the actual query execution model?
  • How to plot query results - what approximation errors may be induced by the graphing tools?

And even if I have a solid understanding of all of the above stuff, there will be one thing I'm never entirely sure about - the correctness of my query logic. But this one becomes testable once other parts are known.

Recently, I've been through another round of this journey - I was making an acquaintance with Prometheus. Since it was already a third of fourth monitoring system I had to work with, at first, I thought I could skip all the said steps and jump into writing queries to production metrics and reading graphs... The hope was on the knowledge extrapolation. But nope, it didn't work out well. So, I gave up on the idea of cutting corners quickly. That's how I found myself setting up a Prometheus playground, feeding it with some known inputs, observing the outputs, and trying to draw some meaningful conclusion.

Setting up Prometheus playground

A shallow Internet search showed that there are some playgrounds already (1, 2, 3, 4). However, none of them suited my needs well. It was either an attempt to demo all the Prometheus capabilities in one place (alertmanager integration, federation, basic auth, etc) or a certain staged setup prepopulated with some obscure data (so I would need to learn the dataset first).

Instead, I needed a scratch Prometheus instance where I'd have full control over the server configs. And an ability to feed it with synthetic datasets so I could answer the following questions with certainty:

  • How to join metrics - what are the vector matching rules?
  • What does instant vector really mean?
  • How the instant vector is different from the range vector?
  • How Prometheus deals with missing scrapes?
  • What is a lookback delta?
  • Et cetera, et cetera...

Prometheus doesn't support bulk imports yet. Or maybe it does, but I just couldn't find a simple way to preload a Prometheus instance with some historical data. And since the scraping behavior was also one of the gray areas for me, I ended up with the following approach:
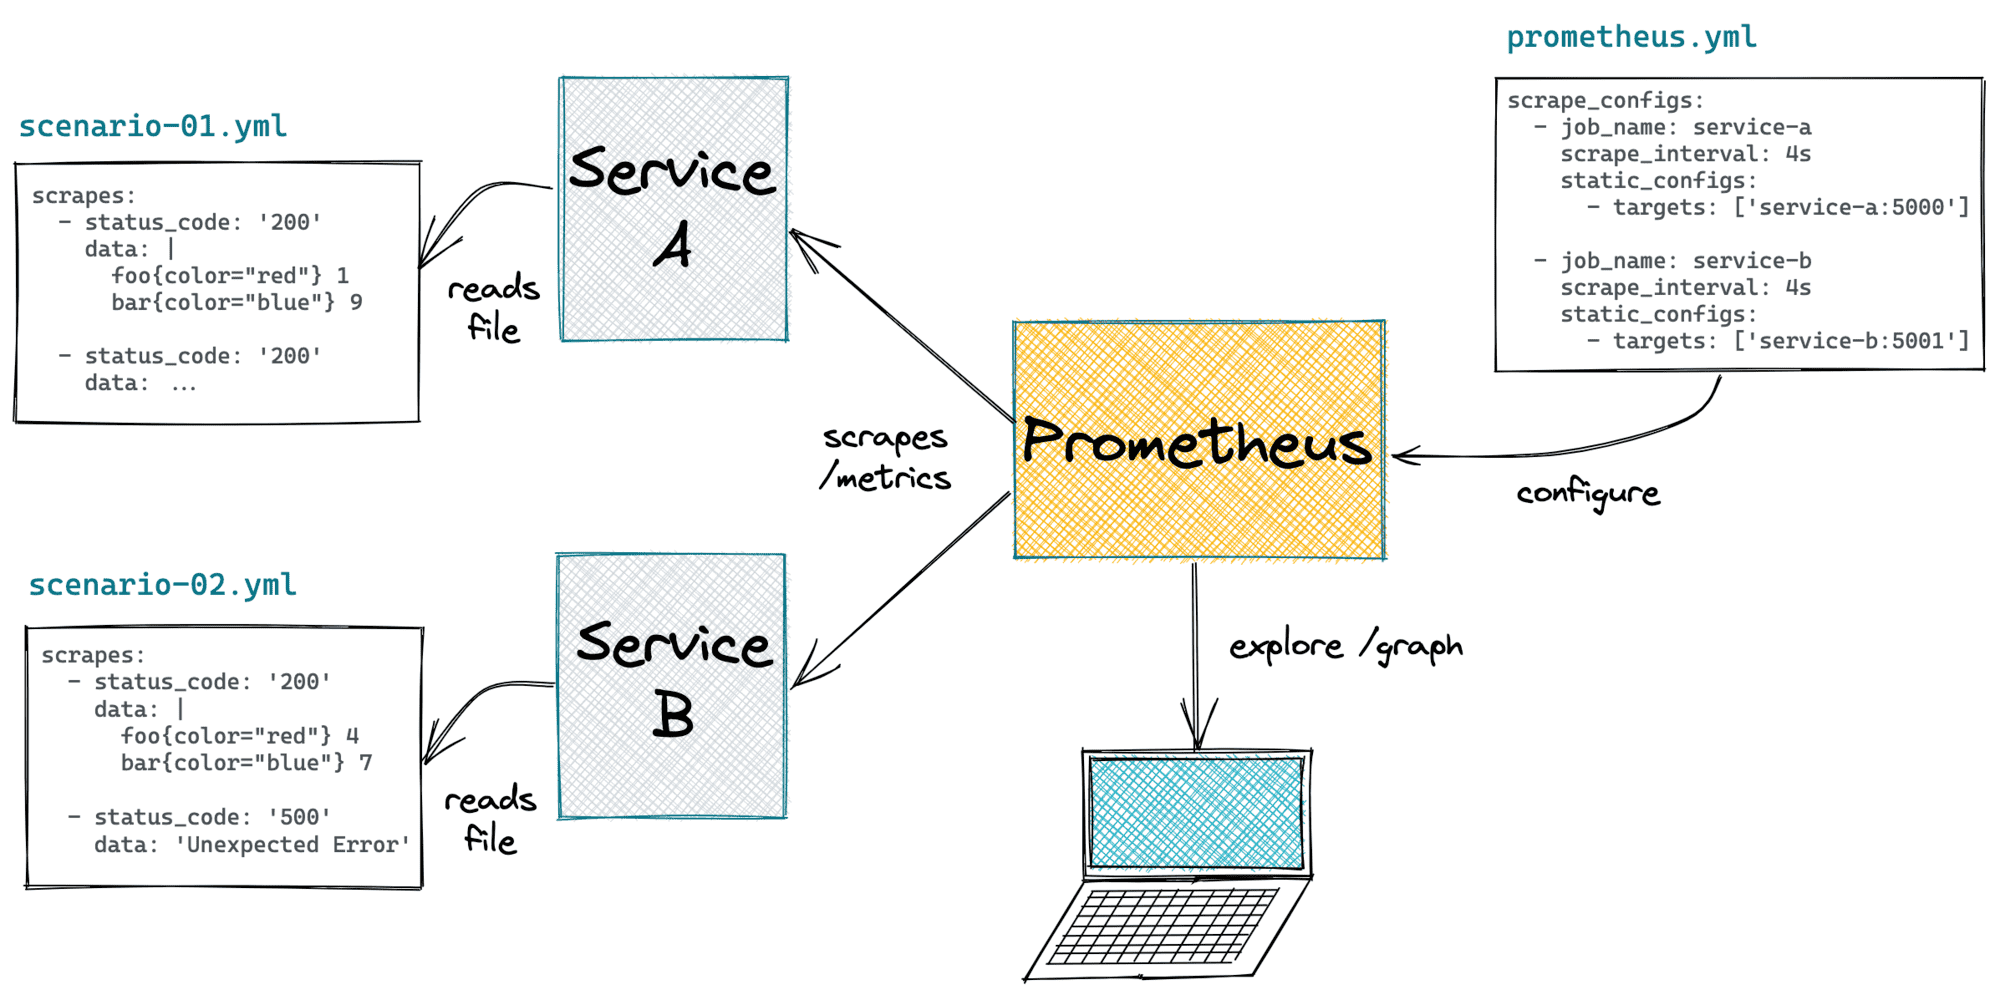
Prometheus playground

  1. Create a fake service exposing /metrics endpoint. It'd simulate a web service instrumented with the Prometheus client. The only purpose of this service is to reproduce a certain scenario written as a YAML file:
# scenario-01/service-a.yaml (tape)
---
scrapes:
  - status_code: '200'
    data: |
      foo{color="red",size="small"} 4
      foo{color="green",size="small"} 8
      bar{color="green",size="xlarge"} 2
      bar{color="blue",size="large"} 7

  - status_code: '500'
    data: 'Unexpected Error'

  - status_code: '200'
    data: |
      foo{color="blue",size="small"} 16
      foo{color="red",size="large"} 5
      bar{color="red",size="small"} 5
  1. Run one or many such services and a properly-configured Prometheus instance as a docker-compose environment:
# scenario-01/docker-compose.yaml
---
version: "3.9"
services:
  service-a:
    build: ../service
    hostname: service-a
    environment:
      FLASK_RUN_PORT: "5000"
      SCRAPE_TAPE: '/var/lib/scrapes.yaml'
    volumes:
      - ./service-a.yaml:/var/lib/scrapes.yaml
  service-b:
    build: ../service
    hostname: service-b
    environment:
      FLASK_RUN_PORT: "5001"
      SCRAPE_TAPE: '/var/lib/scrapes.yaml'
    volumes:
      - ./service-b.yaml:/var/lib/scrapes.yaml
  prometheus:
    image: prom/prometheus:latest
    entrypoint:
      - "/bin/prometheus"
      - "--config.file=/opt/prometheus/prometheus.yml"
      - "--query.lookback-delta=15s"  # <-- setting shorter lookback duration
    ports:
      - "55055:9090"
    volumes:
      - ./prometheus.yml:/opt/prometheus/prometheus.yml
  1. Open the graph explorer on localhost:55055 and run some PromQL queries.

Check out the full playground code on GitHub.

The simplicity of this setup allowed me to experiment really quickly. Yes, I may need to wait until a few scrapes happen. However, short scrapes intervals and custom lookback-delta usually reduce the waiting time to under one minute. And as a result, I got lots of interesting insights about PromQL and Prometheus behavior!