


Working with real metrics is hard. Metrics are needed to give you an understanding of how your service behaves. That is, by definition, you have some uncertainty about the said behavior. Therefore, you have to be hell certain about your observability part. Otherwise, all sorts of metric misinterpretations and false conclusions will follow.
Here are the things I'm always trying to get confident about as soon as possible:
And even if I have a solid understanding of all of the above stuff, there will be one thing I'm never entirely sure about - the correctness of my query logic. But this one becomes testable once other parts are known.
Recently, I've been through another round of this journey - I was making an acquaintance with Prometheus. Since it was already a third of fourth monitoring system I had to work with, at first, I thought I could skip all the said steps and jump into writing queries to production metrics and reading graphs... The hope was on the knowledge extrapolation. But nope, it didn't work out well. So, I gave up on the idea of cutting corners quickly. That's how I found myself setting up a Prometheus playground, feeding it with some known inputs, observing the outputs, and trying to draw some meaningful conclusion.
A shallow Internet search showed that there are some playgrounds already (1, 2, 3, 4). However, none of them suited my needs well. It was either an attempt to demo all the Prometheus capabilities in one place (alertmanager integration, federation, basic auth, etc) or a certain staged setup prepopulated with some obscure data (so I would need to learn the dataset first).
Instead, I needed a scratch Prometheus instance where I'd have full control over the server configs. And an ability to feed it with synthetic datasets so I could answer the following questions with certainty:
Prometheus doesn't support bulk imports yet. Or maybe it does, but I just couldn't find a simple way to preload a Prometheus instance with some historical data. And since the scraping behavior was also one of the gray areas for me, I ended up with the following approach:
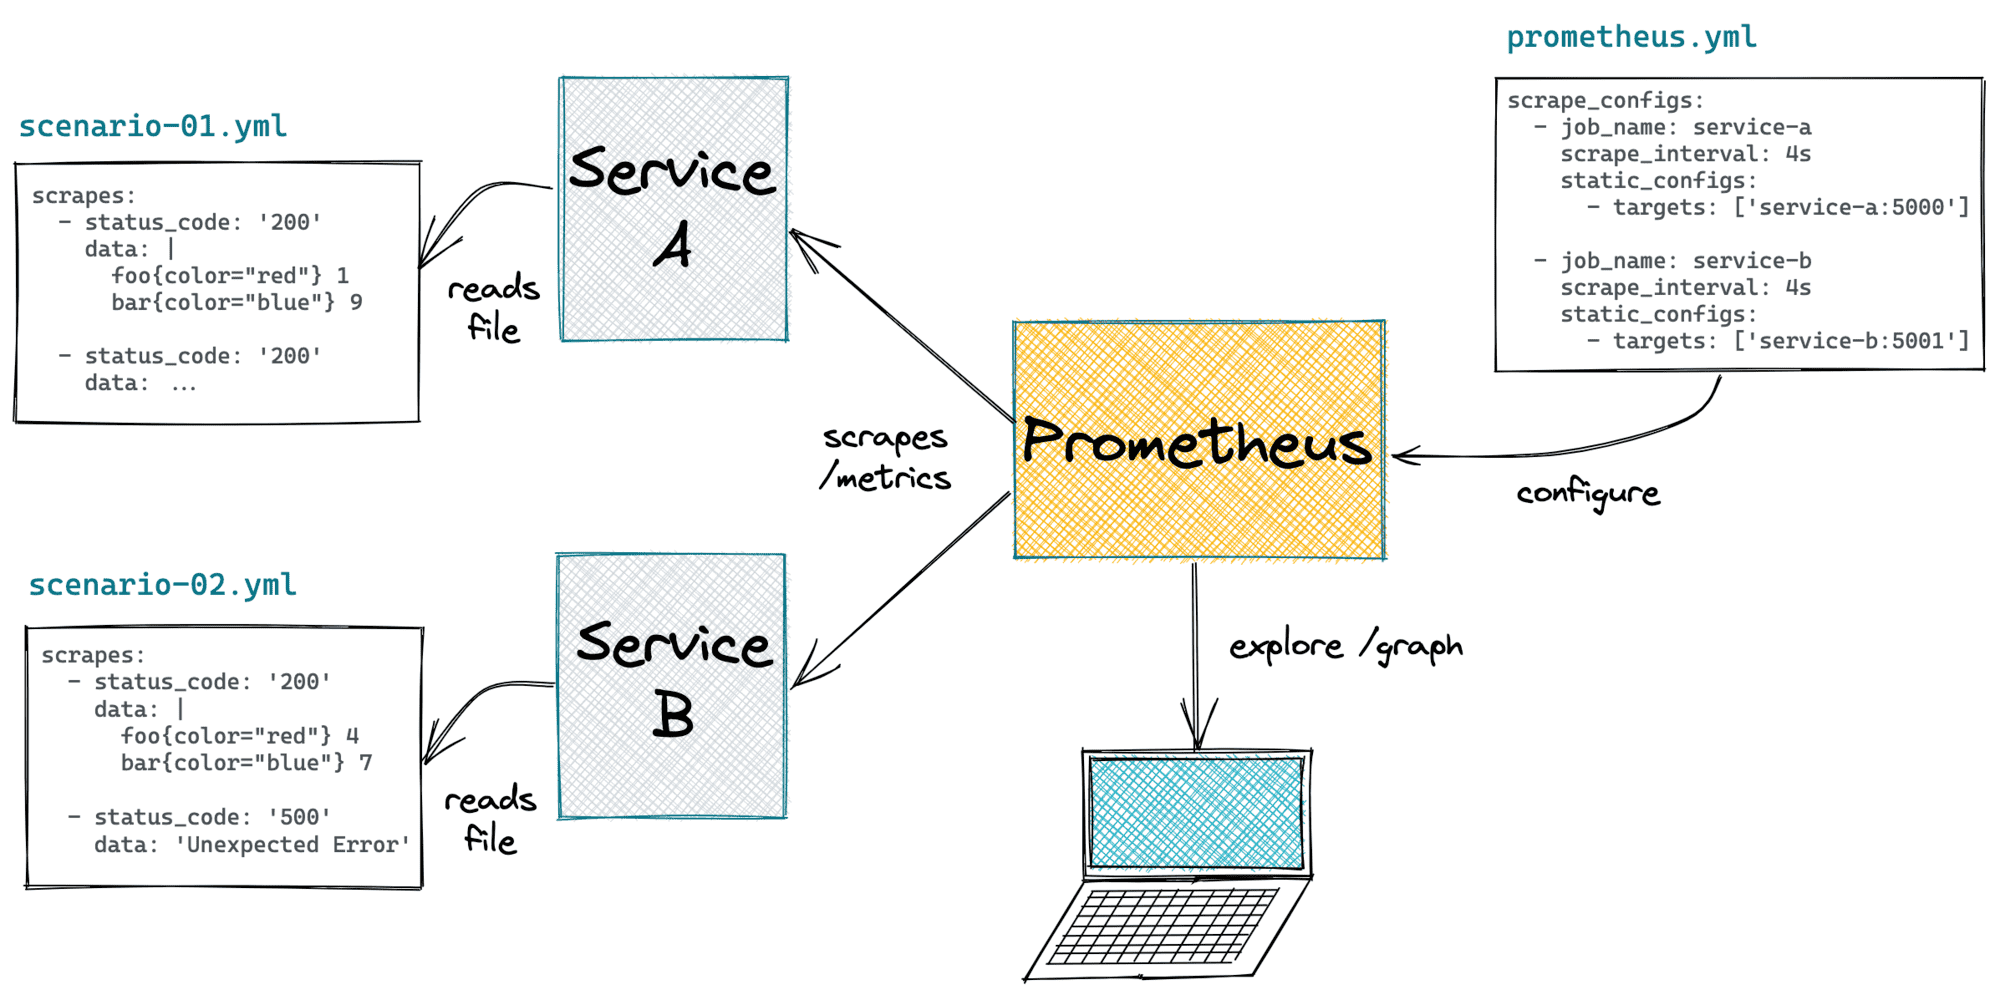
/metrics endpoint. It'd simulate a web service instrumented with the Prometheus client. The only purpose of this service is to reproduce a certain scenario written as a YAML file:# scenario-01/service-a.yaml (tape)
---
scrapes:
- status_code: '200'
data: |
foo{color="red",size="small"} 4
foo{color="green",size="small"} 8
bar{color="green",size="xlarge"} 2
bar{color="blue",size="large"} 7
- status_code: '500'
data: 'Unexpected Error'
- status_code: '200'
data: |
foo{color="blue",size="small"} 16
foo{color="red",size="large"} 5
bar{color="red",size="small"} 5
docker-compose environment:# scenario-01/docker-compose.yaml
---
version: "3.9"
services:
service-a:
build: ../service
hostname: service-a
environment:
FLASK_RUN_PORT: "5000"
SCRAPE_TAPE: '/var/lib/scrapes.yaml'
volumes:
- ./service-a.yaml:/var/lib/scrapes.yaml
service-b:
build: ../service
hostname: service-b
environment:
FLASK_RUN_PORT: "5001"
SCRAPE_TAPE: '/var/lib/scrapes.yaml'
volumes:
- ./service-b.yaml:/var/lib/scrapes.yaml
prometheus:
image: prom/prometheus:latest
entrypoint:
- "/bin/prometheus"
- "--config.file=/opt/prometheus/prometheus.yml"
- "--query.lookback-delta=15s" # <-- setting shorter lookback duration
ports:
- "55055:9090"
volumes:
- ./prometheus.yml:/opt/prometheus/prometheus.yml
localhost:55055 and run some PromQL queries.Check out the full playground code on GitHub.
The simplicity of this setup allowed me to experiment really quickly. Yes, I may need to wait until a few scrapes happen. However, short scrapes intervals and custom lookback-delta usually reduce the waiting time to under one minute. And as a result, I got lots of interesting insights about PromQL and Prometheus behavior!
此内容由惯性聚合(RSS阅读器)自动聚合整理,仅供阅读参考。 原文来自 — 版权归原作者所有。