I was working on benchmarking some new code on a Raspberry Pi Pico today and needed to debug it. This proved to be more difficult than it should be, so I figured I would document how I did it.
The Pi Pico has a readily available Debug Probe that uses a SWD connection to the Pico. I happen to have one that I bought years ago, unfortunately it was DoA when I bought it years ago, there is a dead buffer in it that I need to replace one day. I didn’t find this out until it was far too late to return it.
As an alternative, another Pi Pico can be used as a debugger, similar to the Debug Probe. Unfortunately, I didn’t have an RP2040 board with spare GPIO handy to do this. Time for an alternative method.
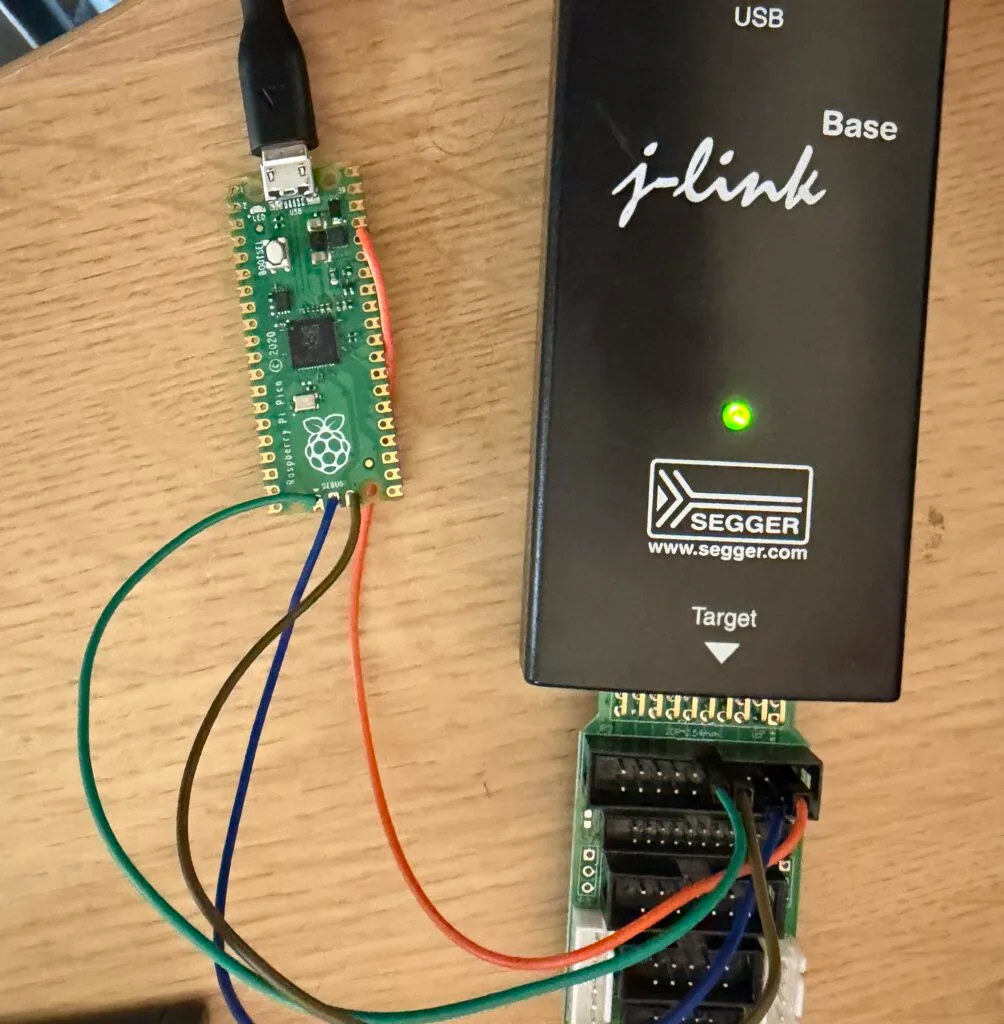
A colleague pointed out that Segger J-Link supports the RP2040 MCU in the Pi Pico, so, I hooked it up. Segger has a page which outlines how to hook it up. I have a couple of genuine Segger J-Links, I grabbed my older v10 one first and wired everything up.
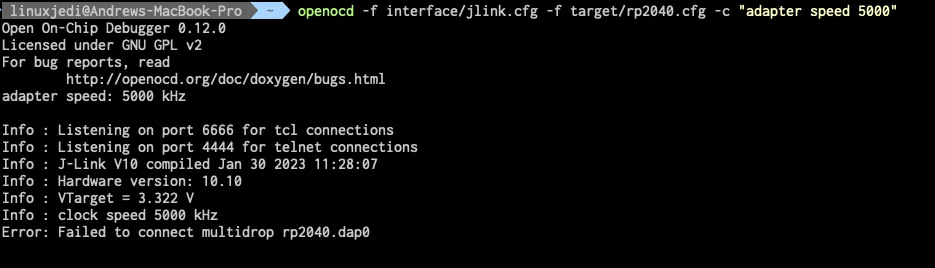
Once this was hooked up, I modified the standard OpenOCD command to connect via the J-Link, which turns it into:
openocd -f interface/jlink.cfg -f target/rp2040.cfg -c "adapter speed 5000"
I even tried different connection speeds, no joy. Time to try something else…
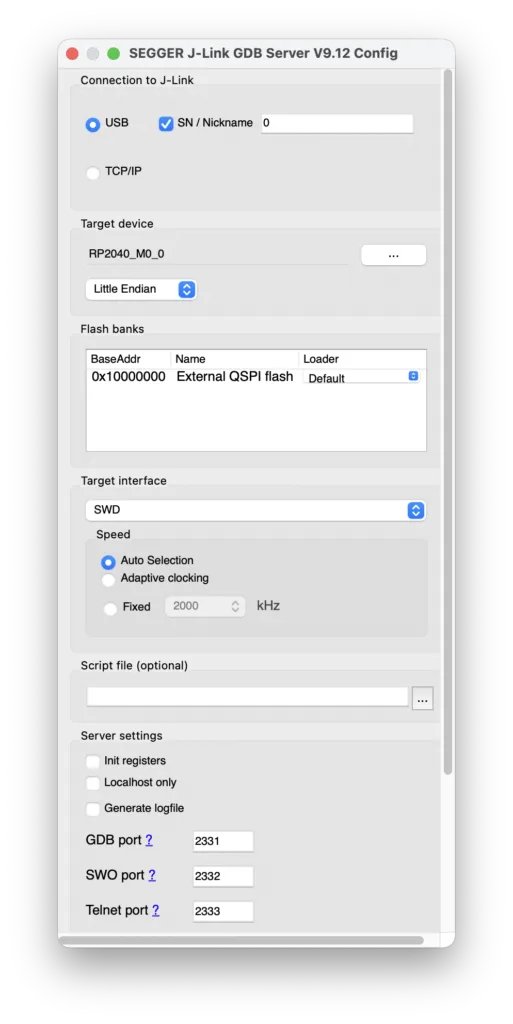
The J-Link has a bunch of GUI tools, one of which is to connect as a debugger, so I loaded this tool.
Once loaded I configured it for an RP2040 SWD connection.
When scrolling down, there is a button to connect, and…
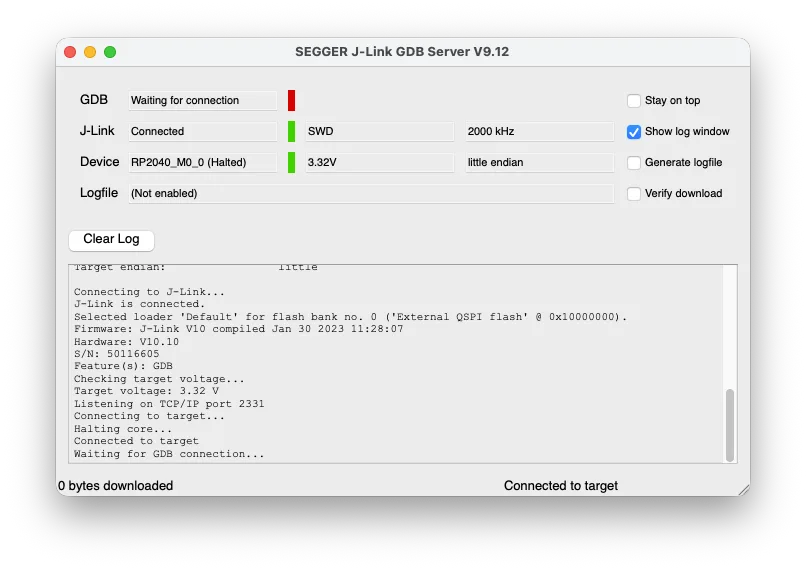
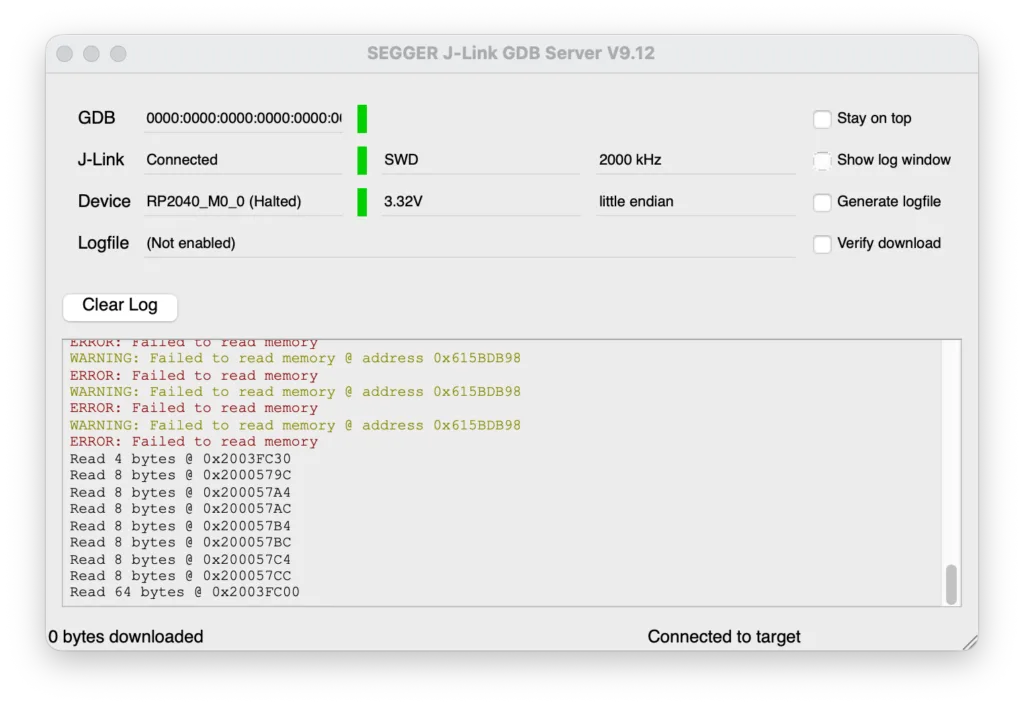
Immediate connection! Excellent!
This is listening on port 2331 for a debug connection. So, we open a GDB connection by doing:
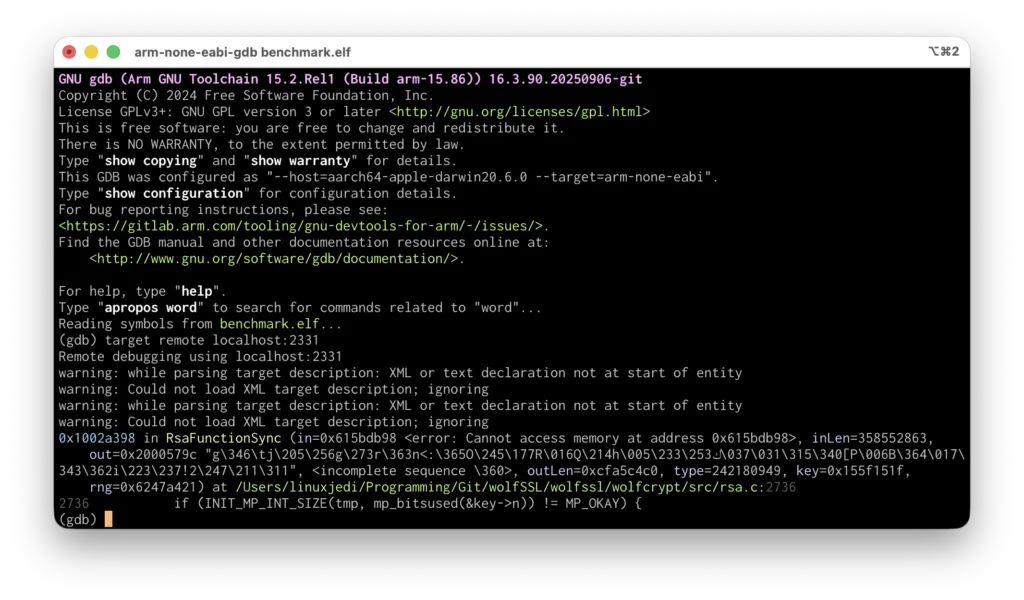
arm-none-eabi-gdb benchmark.elf
Note that you need to use the .elf here instead of the .uf2. Once loaded, you need to connect to the debugger. This is done by entering the following into gdb. This will make the GDB connection go green in the J-Link GUI:
target remote localhost:2331
monitor reset
You only need to do monitor reset if you want to restart the execution on RP2040. From here you can enter continue and the code execution will continue. You can’t use run like you would locally debugging.
Using this method, I was quickly able to debug the problem I was having (I made a dumb configuration error) and was able to continue. I think I’ll be using J-Link for RP2040 / RP2350 debugging from now on!
此内容由惯性聚合(RSS阅读器)自动聚合整理,仅供阅读参考。 原文来自 — 版权归原作者所有。