


While many operating systems seem to try to prevent you from peeking under the hood, Unix and Linux positively encourage it. One great tool that we’ve looked at before is strace. Using this tool, you can see details about every system call a program makes. As you might imagine, for any significant program, the output from strace can be huge.
While I’m not always a fan of GUIs, this is one of those cases where making the data easier to browse is a great idea. Enter strace-tui, a text-based GUI for strace from [Rodrigodd]. The program can parse output from strace or manage the strace execution itself, and either way, display the data in a useful way.
I started out looking at [janestreet’s] strace_ui, but the OCaml setup was throwing errors for me, so I just gave up. The strace-tui installs like many Rust programs, using cargo, and it went smoothly.
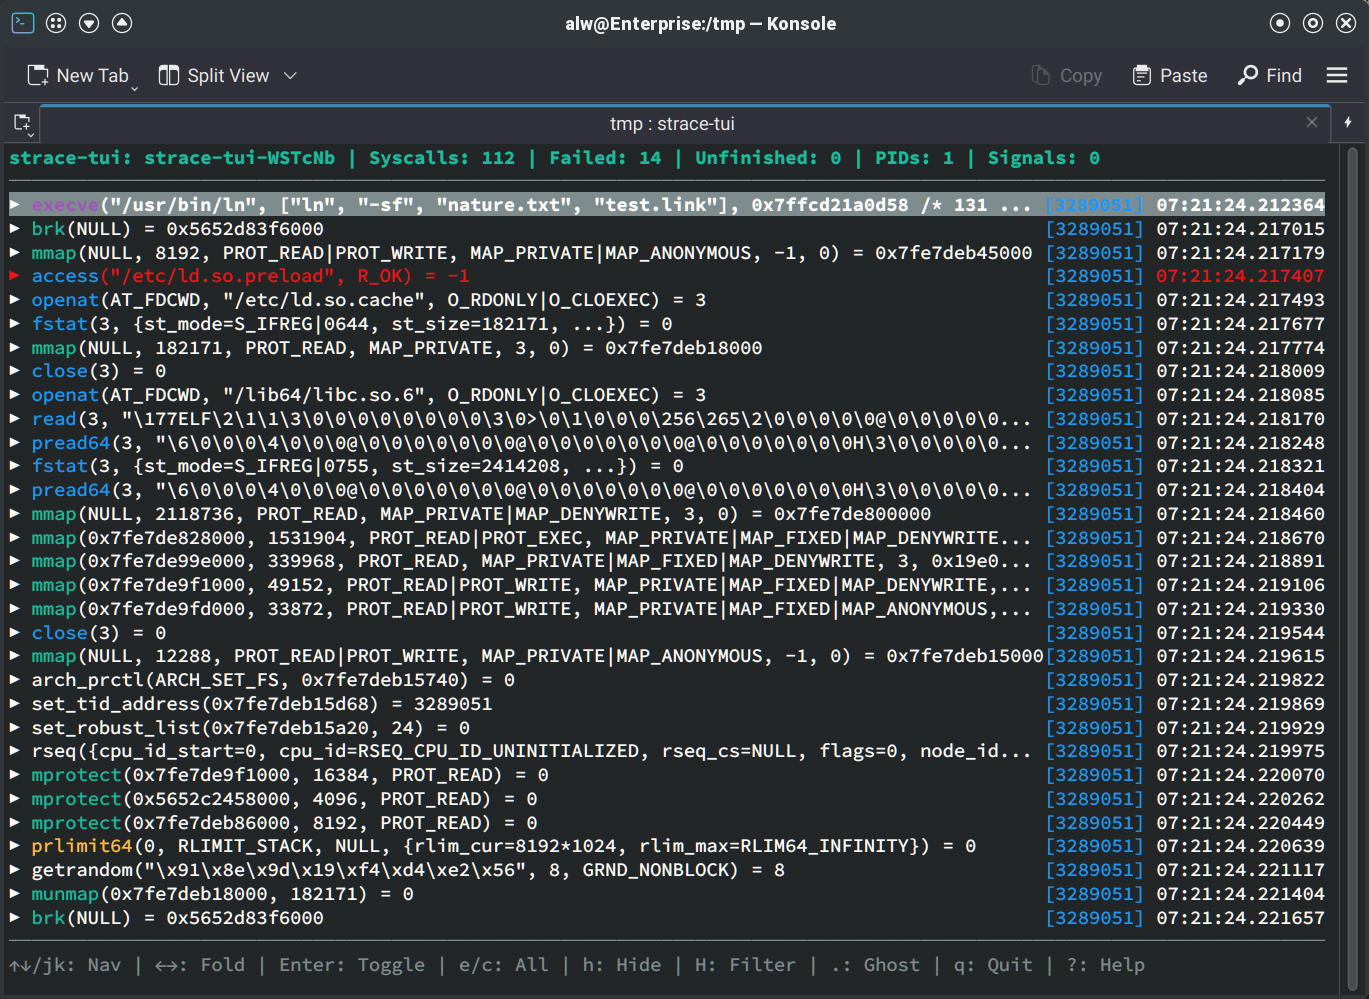
The only issue I had running the tool was that I don’t normally keep ~/.cargo/bin on my path. You can add it to your path, link the executable into your path, or solve that in any number of other ways.
As an example, I traced a symbolic link command (ln -sf nature.txt test.link). It is easy to pick out some essential information on the top line. The command took 112 system calls, 14 of them failed (which isn’t unexpected), there were no unfinished calls, no signals, and only a single PID.
The bottom shows things you can do. Arrows or j and k, along with the usual cursor control keys like Home and Page Down scroll through the list. The right and left arrows will expand or collapse items. That will show details about the call in question, including the arguments and return values. You can consult the help for all the details.
The real power, though, lies in filtering out the noise and searching for specific things. If you are looking at something you don’t want to see, you can press a lowercase h to hide it, but note that it hides everything similar, not just an individual line. An uppercase H will bring up a filter dialog where you can include or exclude groups of data.
Searching is also a great way to find what you want. A slash key starts a search. The N key navigates with a lowercase entry moving forward and an uppercase one moving backward.
For example, if I only wanted to look at openat commands, I could open the dialog. Not only does it show filters, but it also shows how many things match (there are 30 instances of openat). Pressing a will toggle all entries off and then selecting openat greatly reduces the amount of output. I also selected symlinkat, read, and fstat so I would only look at the file-related items.
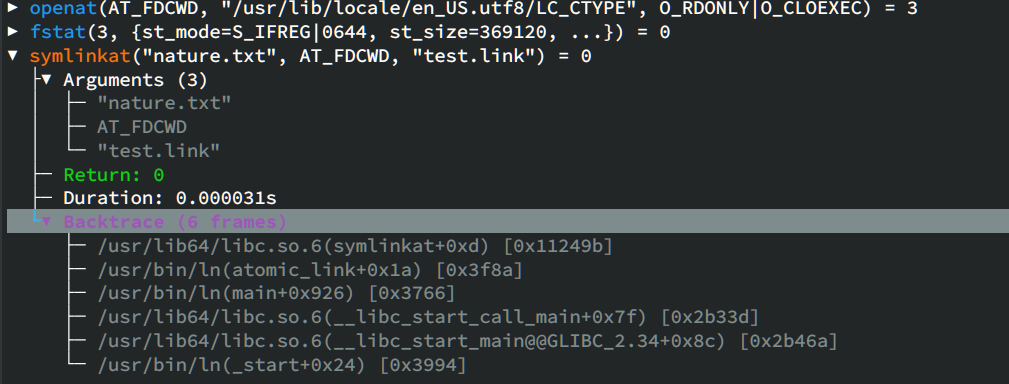
Many of the file operations are related to loading shared libraries and locales. To find the actual line that makes the link, it was easy to press the slash key and some text from the file like test.link.
That will highlight the symlinkat line, which is no surprise, but this is a simple example. If you press Enter or the right arrow, you can see more detail, including arguments, the return value, the amount of time executing, and a backtrace that shows how your program made it to the call.
This is a simple example, but the program can also visualize multi-threaded or multi-process traces using graphs. That can be helpful for analyzing real programs.
Even this simple program has a lot of output. Sure, if you are trying to debug a locale-related problem, all of the lines about loading locale files that don’t exist might be gold. But most of the time, you don’t really care about all the standard loading scaffolding and a tool like this can help cut through the chatter.
According to the project page, there are some missing features, and we presume this is a roadmap for future development.
In particular, the program can’t filter traces for specific processes or threads. There’s also no way to copy details to the clipboard or export filtered traces out to a file. Of course, it is open source, so you can always volunteer to add some of this or your favorite feature.
If you give strace-tui a shot, or have other strace tips and tricks you’d like to share, let us know in the comments.
此内容由惯性聚合(RSS阅读器)自动聚合整理,仅供阅读参考。 原文来自 — 版权归原作者所有。