


APM vs Observability: Observing beyond APM
In my previous post I made a bold, sweeping statement that APM is not - in the most specific sense - a subset of observability.
Still standing by it
I stand by that because words matter and - like many "monitoring engineers" (IT folks who make monitoring and observability their specialty) - I, too, bear scars from the flame-wars on Twitter back in the 2020's where we fought internecine battles over the proper definition of (and number of pillars in) “observability”.
But, if I were slightly less pedantic about the whole thing*, we could recognize and accept that many (perhaps most) APM tools tend to have certain features that work in a particular way; and likewise, observability tools tend to have certain features and work in a particular way. And that there has come to be a lot of overlap between those two categories.
Therein lies the potential for confusion. Is it true that all APM tools “do” observability? Or that all solutions that “do” observability can be categorized as APM tools? Or both? Or neither?
As mentioned in the previous blog, a large part of the problem is vendor-induced confusion. Gartner, Forrester, et. al. create a category, which then generates a rush across the industry where vendors attempt to get listed (and be seen as a leader) in that new category. And so, for a while, vendors tried to make APM be whatever it was they did best.
I’m going to add a layer of nuance, moving from the typical tool-and-technique based definition (APM tools have tracing! No they don’t!) to their intrinsic point of view. Broadly speaking, APM tools tend to use the interior of the application as the starting point – the hardware, infrastructure, even the code base itself. It builds its understanding of application performance from that point and moves outward toward the end-user.
APM tools tend to look at the infrastructure – the systems and functions that make up an application or service – from outside of those systems. Not from the point of view of the user, but also not from within the code itself. External agents make requests of each element of the architecture, collecting and correlating data points to build a picture of the internal operations.
This stands in opposition to observability, which tends to generate its most important data from inside the system itself (usually as traces and internal code-based logging) and then “emit” that data to whoever is listening. The difference is both nuanced and important. In one case (APM) data collection is an unplanned interruption of the operation of the system. In the other (Observability) the data emission is part of the planned execution and can therefore be tuned, optimized, and balanced with other critical operations.
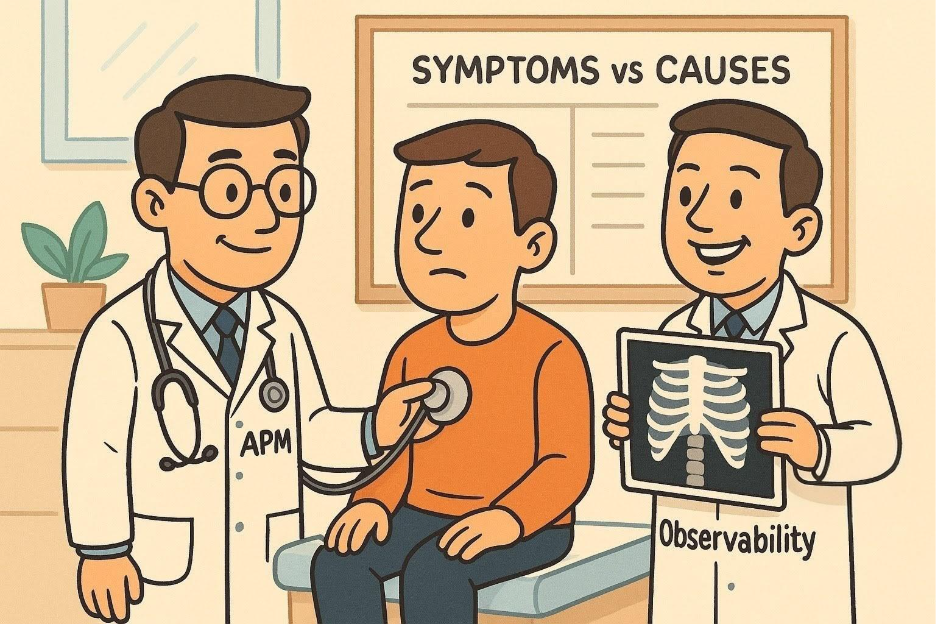
But the point, vis-a-vis observability, is that code-based issues are detected by APM-style methods only in the form of impacted user experience - by first noticing the symptoms (slow response, broken elements, unexpected results), flagging those aspects for the support team, and allowing them to dig in to the appropriate back-end elements. By definition, this is the opposite of the traditional definition of observability, where the system's output tells you the internal state. APM is based on a call-and-response, externally initiated monitoring process.
So-called "observability tools" (which, to go back to my earlier analogy ), is like saying "lake rowboats" versus "ocean rowboats") tend to be far more code-centric. They typically begin by leveraging tracing and logging, and then supplementing that insight with metrics for additional context.
But saying "it's tracing with a little metrics and logs for flavor" doesn't get to the heart of observability, even if we imagine observability is a type of tool or solution. The key element of observability is:
These tools are designed to handle a vast quantity of data, with the ability to ingest and normalize it quickly, and then pivot that data in multiple ways to surface unique combinations. As stated earlier, the "unknown unknowns" - events and data combinations with high cardinality (uniqueness)- are far more important in an observability context than the "known unknowns.”
So, POSSIBLY, an aspect of observability that goes beyond typical APM solutions is the volume of data consumed, speed of analysis, and focus on high-cardinality events. BUT... it’s worth noting that this is not a fundamental aspect of observability, but rather is my observation of how the majority of tools which best embody observability philosophies have been built.
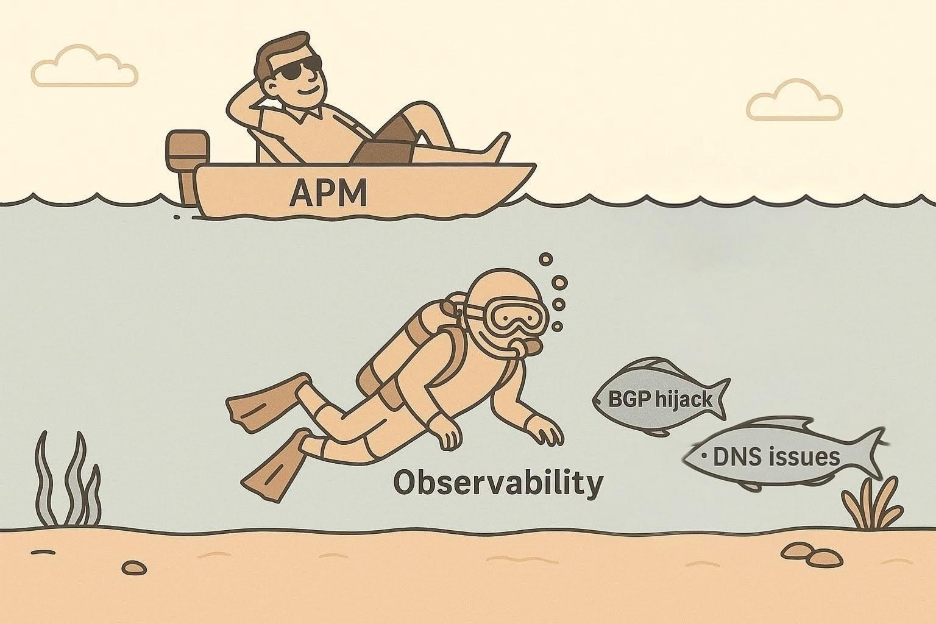
What's more relevant to this discussion is where APM falls short, and observability doesn't fill the gap. APM tools don't always include network-specific data. In fact, the newer APM tools rarely include detailed network telemetry, and only a few provide insight into the fabric of the Internet itself (I'm not trying to sound mysterious. I mean BGP and ASs. The literal network fabric that makes up the Internet). Only by including those elements, and not just including, but integrating them holistically into the other aspects, do you achieve top-to-bottom application visibility.
Compare what you can monitor with APM vs IPM
FOOTNOTES/SIDEBAR BELOW
* And if my grandmother had wheels... - editor
APM vs Observability: Observing beyond APM
In my previous post I made a bold, sweeping statement that APM is not - in the most specific sense - a subset of observability.
Still standing by it
I stand by that because words matter and - like many "monitoring engineers" (IT folks who make monitoring and observability their specialty) - I, too, bear scars from the flame-wars on Twitter back in the 2020's where we fought internecine battles over the proper definition of (and number of pillars in) “observability”.
But, if I were slightly less pedantic about the whole thing*, we could recognize and accept that many (perhaps most) APM tools tend to have certain features that work in a particular way; and likewise, observability tools tend to have certain features and work in a particular way. And that there has come to be a lot of overlap between those two categories.
Therein lies the potential for confusion. Is it true that all APM tools “do” observability? Or that all solutions that “do” observability can be categorized as APM tools? Or both? Or neither?
As mentioned in the previous blog, a large part of the problem is vendor-induced confusion. Gartner, Forrester, et. al. create a category, which then generates a rush across the industry where vendors attempt to get listed (and be seen as a leader) in that new category. And so, for a while, vendors tried to make APM be whatever it was they did best.
I’m going to add a layer of nuance, moving from the typical tool-and-technique based definition (APM tools have tracing! No they don’t!) to their intrinsic point of view. Broadly speaking, APM tools tend to use the interior of the application as the starting point – the hardware, infrastructure, even the code base itself. It builds its understanding of application performance from that point and moves outward toward the end-user.
APM tools tend to look at the infrastructure – the systems and functions that make up an application or service – from outside of those systems. Not from the point of view of the user, but also not from within the code itself. External agents make requests of each element of the architecture, collecting and correlating data points to build a picture of the internal operations.
This stands in opposition to observability, which tends to generate its most important data from inside the system itself (usually as traces and internal code-based logging) and then “emit” that data to whoever is listening. The difference is both nuanced and important. In one case (APM) data collection is an unplanned interruption of the operation of the system. In the other (Observability) the data emission is part of the planned execution and can therefore be tuned, optimized, and balanced with other critical operations.
But the point, vis-a-vis observability, is that code-based issues are detected by APM-style methods only in the form of impacted user experience - by first noticing the symptoms (slow response, broken elements, unexpected results), flagging those aspects for the support team, and allowing them to dig in to the appropriate back-end elements. By definition, this is the opposite of the traditional definition of observability, where the system's output tells you the internal state. APM is based on a call-and-response, externally initiated monitoring process.
So-called "observability tools" (which, to go back to my earlier analogy ), is like saying "lake rowboats" versus "ocean rowboats") tend to be far more code-centric. They typically begin by leveraging tracing and logging, and then supplementing that insight with metrics for additional context.
But saying "it's tracing with a little metrics and logs for flavor" doesn't get to the heart of observability, even if we imagine observability is a type of tool or solution. The key element of observability is:
These tools are designed to handle a vast quantity of data, with the ability to ingest and normalize it quickly, and then pivot that data in multiple ways to surface unique combinations. As stated earlier, the "unknown unknowns" - events and data combinations with high cardinality (uniqueness)- are far more important in an observability context than the "known unknowns.”
So, POSSIBLY, an aspect of observability that goes beyond typical APM solutions is the volume of data consumed, speed of analysis, and focus on high-cardinality events. BUT... it’s worth noting that this is not a fundamental aspect of observability, but rather is my observation of how the majority of tools which best embody observability philosophies have been built.
What's more relevant to this discussion is where APM falls short, and observability doesn't fill the gap. APM tools don't always include network-specific data. In fact, the newer APM tools rarely include detailed network telemetry, and only a few provide insight into the fabric of the Internet itself (I'm not trying to sound mysterious. I mean BGP and ASs. The literal network fabric that makes up the Internet). Only by including those elements, and not just including, but integrating them holistically into the other aspects, do you achieve top-to-bottom application visibility.
Compare what you can monitor with APM vs IPM
FOOTNOTES/SIDEBAR BELOW
* And if my grandmother had wheels... - editor
This is some text inside of a div block.
此内容由惯性聚合(RSS阅读器)自动聚合整理,仅供阅读参考。 原文来自 — 版权归原作者所有。