



惯性聚合 高效追踪和阅读你感兴趣的博客、新闻、科技资讯
阅读原文 在惯性聚合中打开

推荐订阅源

W
WeLiveSecurity
博客园 - 【当耐特】
Microsoft Azure Blog
WordPress大学
WordPress大学
Stack Overflow Blog
Stack Overflow Blog
cs.AI updates on arXiv.org
IT之家
IT之家
Cloudbric
Cloudbric
The Register - Security
小众软件
小众软件
PCI Perspectives
PCI Perspectives
G
Google Developers Blog
AI
AI
OSCHINA 社区最新新闻
OSCHINA 社区最新新闻
Google DeepMind News
宝玉的分享
宝玉的分享
Recent Commits to openclaw:main
量子位
TaoSecurity Blog
TaoSecurity Blog
cs.CV updates on arXiv.org
F
Full Disclosure
N
Netflix TechBlog - Medium
博客园_首页
Last Week in AI
Last Week in AI
A
Arctic Wolf
B
Blog RSS Feed
J
Java Code Geeks
C
Cybersecurity and Infrastructure Security Agency CISA
I
InfoQ
aimingoo的专栏
aimingoo的专栏
云风的 BLOG
云风的 BLOG
NISL@THU
NISL@THU
MyScale Blog
MyScale Blog
H
Hackread – Cybersecurity News, Data Breaches, AI and More
Jina AI
Jina AI
有赞技术团队
有赞技术团队
S
Schneier on Security
L
Lohrmann on Cybersecurity
P
Privacy & Cybersecurity Law Blog
T
Threat Research - Cisco Blogs
P
Palo Alto Networks Blog
S
Security @ Cisco Blogs
Security Archives - TechRepublic
Security Latest
Security Latest
Vercel News
Vercel News
博客园 - 司徒正美
Webroot Blog
Webroot Blog
Hacker News: Ask HN
Hacker News: Ask HN
A
About on SuperTechFans

Catchpoint Blog

SRE Report: AI optimism and the economics of effort SRE Report: Why fast is what users trust SRE Report 2026: What surprised us, what didn't, and why the gaps matter most The SRE Report 2026: Defensible Ns Why Synthetic Tracing Delivers Better Data, Not Just More Data A New Chapter: LogicMonitor + Catchpoint – A Personal Note from Mehdi Mezmo + Catchpoint deliver observability SREs can rely on The four pillars holding up your digital business, and what happens when they crumble When payments pause: lessons from a global payments outage Observability 2025 Decoded: What the DZone Report Means for SLO-Driven Ops The next evolution of WebPageTest has arrived, and it’s a game-changer The Monitoring Blind Spot That Could Cost You Black Friday Powering Mexico’s Digital Future: Expanded Internet Observability with Catchpoint The Next Chapter of WebPageTest: Your New Experience Starts Soon SRE Report Retrospectives — Have AIOps Predictions Held Up? When BGP becomes UX: The inside story of a SaaS routing decision gone wrong (or right) Session Replay explained: A guide to seeing digital experience through your user’s eyes Making the invisible visible: Are your cloud firewalls and DDoS protection really working? Why it’s time to move beyond APM: Monitoring from the user’s perspective When metrics mislead: Inside the 2025 Retail Web Performance Benchmark The vendor trap: why your next outage won’t be your fault—but will be your problem LLMs don’t stand still: How to monitor and trust the models powering your AI The Annual SRE Survey Is Open—We Want to Hear from You Observability isn’t about the tool. It’s about the truth Invisible dependencies, visible impact: Lessons from the Google Cloud outage Real-time detection of BGP blackholing and prefix hijacks Leading analyst firm reveals the real cost of internet disruptions The Power of Over 3000 Intelligent Observability Agents Monitoring in the Age of Complexity: 5 Assumptions CIOs Need to Rethink Why Intelligent Traffic Steering is Critical for Performance and Cost Optimization Retail digital performance event recap: Key insights from IBM & Catchpoint Zendesk outage: A case for proactive monitoring and faster incident response Silence during chaos: Why the X outage is a call to arms for proactive monitoring The $1 Million Lesson: Building a Culture of Quality Through SLAs When AI tools fail: How to map your AI dependencies for proactive visibility Why Super Bowl 2025 was a triumph for Internet Resilience Why Internet Performance Monitoring is the new health check for IT organizations Why use Playwright in Catchpoint for synthetic monitoring Introducing WebPageTest Expert Plan: Real-Time Insights, Synthetic + RUM together in One Platform The shift to digital: How businesses are reshaping their priorities for 2025 The SRE Report 2025's Call to Action Monitoring in the Age of the Internet: DEM, IPM, and APM—What You Need to Know SSL Monitoring, Trust, and McLOVIN Performing for the holidays: Look beyond uptime for season sales success Lessons from Microsoft’s office 365 Outage: The Importance of third-party monitoring Web Performance Experts Look into the Future of Web Performance The hidden challenges of Internet Resilience: Key insights from 2024 report When SSL Issues aren’t just about SSL: A deep dive into the TIBCO Mashery outage The curious case of Marriott and the untold impact of web performance on revenue Preparing for the unexpected: Lessons from the AJIO and Jio Outage It’s time to stop neglecting the elephant in the room: Performance Matters! The Need for Speed: Highlights from IBM and Catchpoint’s Global DNS Performance Study Learnings from ServiceNow’s Proactive Response to a Network Breakdown Webinar Recap: Taking Web Performance to the Next Level Use the Catchpoint Terraform Provider in your CI/CD workflows Is the Internet ready for L4S? Takeaways from the CrowdStrike outage: third-parties can pose risk July 19th global IT outage reminds us of digital complexity 5 Actions you can take to improve digital performance 2024: A banner year for Internet Resilience APM vs Observability: Both-and, not either-or AppAssure: Ensuring the resilience of your Tier-1 applications just became easier APM vs observability: why your definitions are broken APM vs Observability: What comes next? APM vs Observability: Observing beyond APM Achieving stability with agility in your CI/CD pipeline AWS Outage: How do you prepare for the failure of your own safety net? Agentic AI: Powerful But Fragile—What You Need to Know Catch frustration before it costs you: New tools for a better user experience Catchpoint Expands Observability Network to Barcelona: A Growing Internet Hub Catchpoint Peak Performance Summit 2025: Redefining Observability for the Outcome Economy Catchpoint named a leader in the 2024 Gartner® Magic Quadrant™ for Digital Experience Monitoring Consolidation and Modernization in Enterprise Observability Connected Devices: Unlocking the next frontier of Internet Performance Monitoring Cloud Monitoring's Blind Spot: The User Perspective Cloudflare’s Resolver Outage: More Than Just DNS Cloudflare outage: another wake-up call for resilience planning Demystifying API Monitoring and Testing with IPM Creating the IPM Category: Catchpoint’s Journey to Leadership and the LogicMonitor Era Critical Requirements for Modern API Monitoring Customer Survey 2024: Unveiling insights and impact Did Delta's slow web performance signal trouble before CrowdStrike? Diagnosing Wi-Fi failures that traditional tools miss: a case study DNS misconfiguration can happen to anyone - the question is how fast can you detect it? ECN explained: Navigate congestion for faster, smoother data delivery Don’t get caught in the dark: Lessons from a Lumen & AWS micro-outage Escalating risk, shrinking margins: The 2025 Internet Resilience Report From refresh to results: the metrics that shaped Election Day 2024 coverage Fast and furious: The importance of performance in the digital age Getting Started with Traceroute From the source to the edge: the six agent types you can’t ignore From SEO to AEO: Why Web Performance Is the Key to AI Search Success Going for gold: Testing the resilience of Olympic websites Here’s the proof: What the fastest sites on the web have in common Google’s Agent-to-Agent (A2A) Protocol is here—Now Let’s Make it Observable How IPM helped a top tech brand catch an OpenAI outage before it became a crisis How AI Turns Monitoring From “What Now?” Into “What’s Next?” How SAP achieved world-class uptime through modern observability How to Monitor AI Agents in Commerce Systems
Semantic Caching: What We Measured, Why It Matters
2025-07-31 · via Catchpoint Blog

in this blog post

Semantic caching promises to make AI systems faster and cheaper by reducing duplicate calls to large language models (LLMs). But what happens when it doesn’t work as expected?

We built a test environment to find out. Through a caching system, we evaluated how semantically similar queries would behave. When the cache worked, response times were fast. When it didn’t, things got expensive. In fact, a single semantic cache miss increased latency by more than 2.5x. These failures didn’t show up in the API logs. But they cost real time and real money.

This blog shares our findings, why semantic caching matters, what causes it to fail, and how to monitor it effectively.

Traditional caching stores responses based on exact matches. If you’ve asked the same question before—verbatim—you’ll get a fast answer from cache. But if you phrase it differently, even slightly, it’s treated as a brand-new request.

Semantic caching is different. Instead of matching by text, it matches by meaning.

It uses embeddings—numerical representations of the intent behind a query—to determine whether a new request is close enough to a previous one. If two queries are semantically similar, the system can return the same result without reprocessing it through the LLM.

This is especially useful in AI systems where users might ask the same thing in dozens of ways. With semantic caching, “Who’s the President of the US?” and “Who runs America?” can trigger the same cached response—saving time, compute, and cost.

Why semantic caching matters in Agentic AI systems

Agentic AI systems don’t just respond to commands—they plan, reason, and act across multiple steps. Each of those steps often involves an LLM call: retrieving documents, rephrasing responses, or deciding what to do next.

The problem? LLM calls are expensive, especially when repeated across variations of the same question.

Instead of reprocessing every variation of a query, it can reuse results from previous, similar requests—so long as the meaning is close enough.

That’s where things get risky: in an agentic AI world, a silent failure in semantic caching doesn’t just mean a slower API call—it can derail entire multistep AI workflows. When semantic cache misses occur, queries go straight to the backend LLM—creating higher latency and skyrocketing costs. Worse yet, these failures are often invisible.  

Your API returns a 200 OK, but behind the scenes, your cost and performance are suffering.

Bottom line: Unlike traditional caching, semantic caches introduce new risks:

  • Sudden model updates change embeddings and break matches.
  • Vector drift causes cache misses even for similar queries.
  • Users phrase things differently, leading to unexpected misses.

What we observed in the lab

To experiment with how semantic caching affects user experience and infrastructure cost, we built a testing lab environment locally.  

Here’s how it worked:

  • We created a FastAPI application running locally, exposing an endpoint /search via a public endpoint to make it reachable.
  • Every incoming search query followed this logic:
  • Cosmos DB Lookup → Check whether we’ve seen a similar semantic query before, using the query text as the key.
  • Cache Hit → Return the cached vector embedding directly, saving time and cost.
  • Cache Miss → Call Gemini Pro to generate a new vector embedding for the query, then store it in Cosmos DB for future reuse.
  • We sent the embedding to Azure AI Search, performing a vector similarity search to find the top matching documents.
  • Finally, we returned the search results plus two crucial custom HTTP headers:
  • X-Semantic-Cache: hit or miss
  • X-Semantic-Score (e.g. 0.8543) indicating how close the new query is to previous ones.

Test results

We configured a Catchpoint test to simulate user queries to our public endpoint URL. The test:

  • Sent randomized prompts (e.g. “NYC weather,” “New York forecast”) to trigger both cache hits and misses.
  • Captured and parsed the semantic headers using regex in Catchpoint to track:
  • Cache efficiency (% of hits vs. misses)
  • Semantic similarity scores
  • Visualized this data in dashboards to see latency differences between hits and misses.

This gave us real evidence of how semantic caching reduces API calls to the expensive LLM backend and improves response times—insights we could quantify directly in the Catchpoint Internet Performance Monitoring (IPM) portal.  

Below, are some helpful insights from our testing.
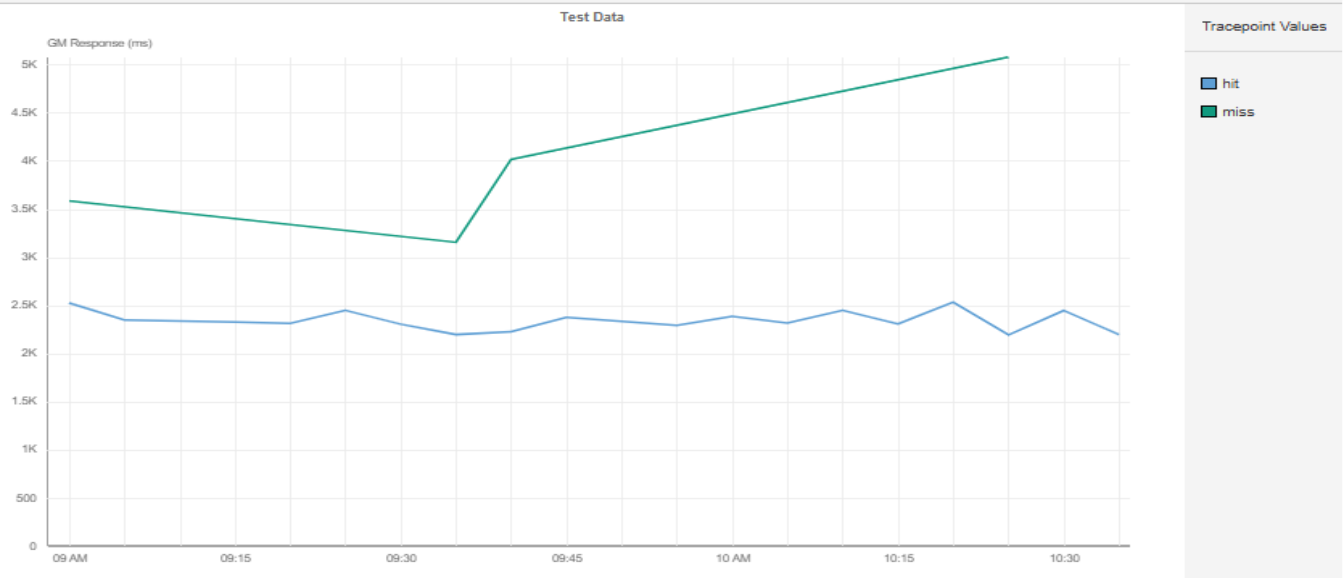
A graph with a line and a lineDescription automatically generated

Cache Hits vs. Misses: Measurable Latency Gap

The trend line in the graph above shows that overall, the response time was about 50% to 250% higher when semantic cache returned a MISS compared to a HIT.

Diving deeper, we observed that the first run of a prompt went to the backend (a cache miss), with higher latency and costs.
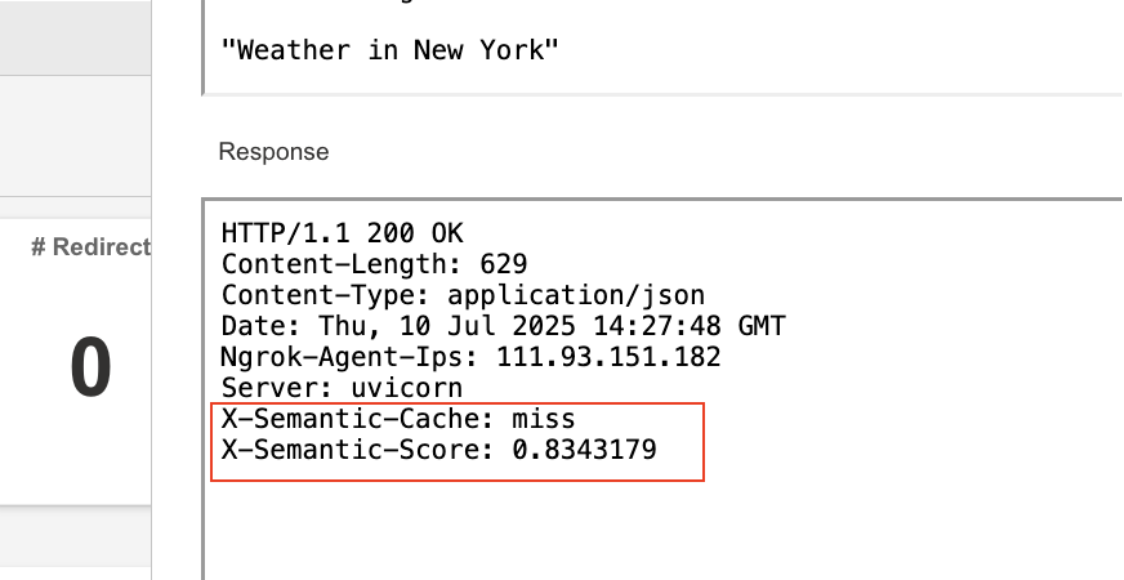
A screenshot of a computerDescription automatically generated

First Run: Cache Miss with High Latency

The second run of the same semantic query hit the cache, cutting response times by 50%.
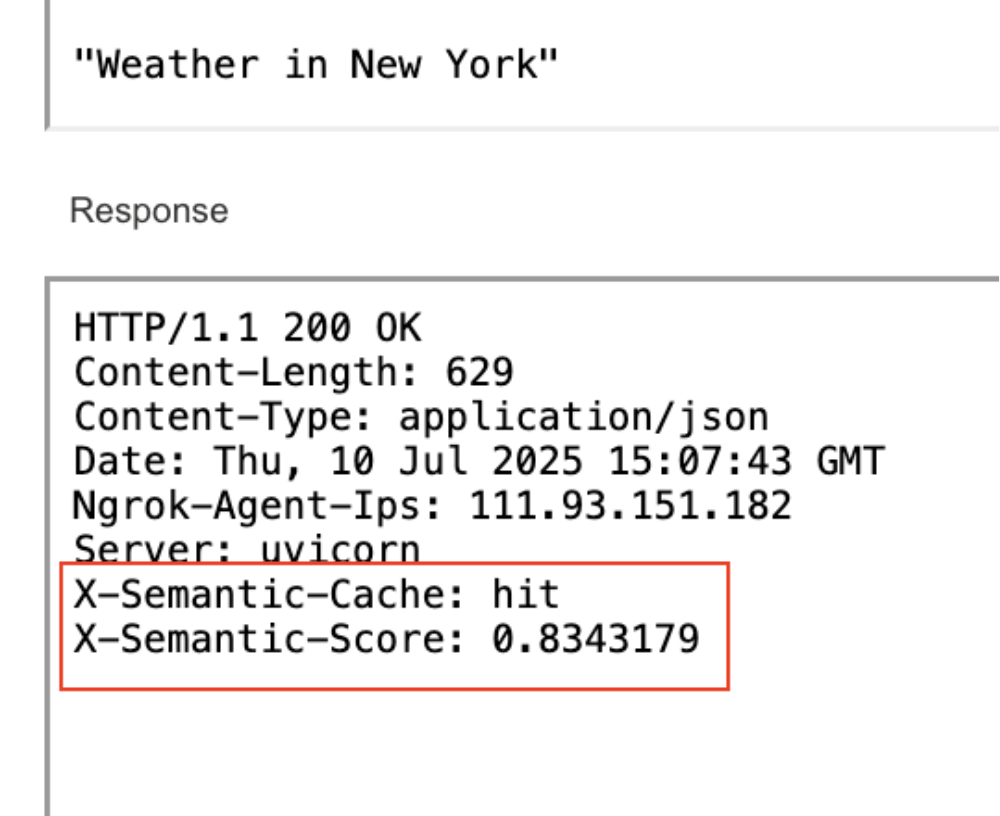
A screenshot of a computerDescription automatically generated

Second Run: Served from Cache (hit). Same semantic score (prompt matched). Response time is 50% lower

Monitoring strategies to make semantic caching reliable

Semantic caching is no longer a background optimization—it’s a core pillar of agentic AI systems that reason and act in real-time. But to trust it, we need to measure how well it’s working.  

Here are three ways to monitor and improve its reliability:

#1. Test semantically similar queries

Semantic caching lives or dies on how well it matches similar questions. Use synthetic monitoring to simulate different phrasings of the same intent:

  • “Who’s the President of the US?”
  • “Who runs the US government?”
  • “Commander-in-Chief of America?”

Then compare their outcomes:

  • Did they result in cache hits or misses?
  • What were the semantic similarity scores?

This gives you visibility into whether your caching system is recognizing intent consistently. For agentic AI, it’s not enough for one query to be fast. You need confidence that all user expressions of the same intent are covered.

#2. Track semantic similarity scores

Semantic caches often return a similarity score (e.g. 0.85) to indicate how close the new query is to an existing cached answer. If your cache system returns a similarity score (e.g. 0.8343), you can:

  • Monitor it over time
  • Visualize trends
  • Alert if scores drop below thresholds

For instance, in our tests, both requests returned the same semantic score of 0.85224825.  

But if the model changes or query phrasing drifts, scores could drop, leading to unexpected misses and rising costs.

Monitoring these numbers ensures your semantic cache stays reliable—and that you’re not wasting money on backend calls unnecessarily.

#3. Measure real-world latency differences

One of the biggest promises of semantic caching is speed. Cache hits should be significantly faster than misses.

Monitoring this can:

  • Split metrics for cache hits vs. misses
  • Show precise latency differences
  • Alert when cache misses cause slowdowns

From our test results:

  • Cache miss response time: ~5 seconds
  • Cache hit response time: ~2 seconds

That’s a 2.5x speedup. In the world of agentic AI, that gap is the difference between a seamless conversation—and a frustrating pause.

Final takeaway

Semantic caching isn’t just a nice-to-have—it’s becoming core infrastructure for real-time AI systems. Cloud leaders like Fastly, AWS, and Azure are already baking it into their architectures. But it’s also uniquely fragile. Changes in language, embedding drift, or model updates can quietly degrade performance.

By combining semantic caching with IPM, teams can ensure that their systems are not only fast—but reliably so.

If you're running AI agents at scale, silent cache failures aren't just inefficiencies. They're risks. Measure them, monitor them, and mitigate them.  

Learn more:

Summary

Semantic caching can make AI systems faster and cheaper by reusing results for similar queries instead of reprocessing them with expensive LLM calls. But when it silently fails—due to phrasing differences, model updates, or vector drift—it can drastically increase latency and costs without warning. In our test lab, a single cache miss slowed responses by 2.5x. This post explores why semantic caching is essential for agentic AI, how it can fail, and how to monitor and improve it to avoid hidden performance and cost issues.

Semantic caching promises to make AI systems faster and cheaper by reducing duplicate calls to large language models (LLMs). But what happens when it doesn’t work as expected?

We built a test environment to find out. Through a caching system, we evaluated how semantically similar queries would behave. When the cache worked, response times were fast. When it didn’t, things got expensive. In fact, a single semantic cache miss increased latency by more than 2.5x. These failures didn’t show up in the API logs. But they cost real time and real money.

This blog shares our findings, why semantic caching matters, what causes it to fail, and how to monitor it effectively.

What is semantic caching?

Traditional caching stores responses based on exact matches. If you’ve asked the same question before—verbatim—you’ll get a fast answer from cache. But if you phrase it differently, even slightly, it’s treated as a brand-new request.

Semantic caching is different. Instead of matching by text, it matches by meaning.

It uses embeddings—numerical representations of the intent behind a query—to determine whether a new request is close enough to a previous one. If two queries are semantically similar, the system can return the same result without reprocessing it through the LLM.

This is especially useful in AI systems where users might ask the same thing in dozens of ways. With semantic caching, “Who’s the President of the US?” and “Who runs America?” can trigger the same cached response—saving time, compute, and cost.

Why semantic caching matters in Agentic AI systems

Agentic AI systems don’t just respond to commands—they plan, reason, and act across multiple steps. Each of those steps often involves an LLM call: retrieving documents, rephrasing responses, or deciding what to do next.

The problem? LLM calls are expensive, especially when repeated across variations of the same question.

Instead of reprocessing every variation of a query, it can reuse results from previous, similar requests—so long as the meaning is close enough.

That’s where things get risky: in an agentic AI world, a silent failure in semantic caching doesn’t just mean a slower API call—it can derail entire multistep AI workflows. When semantic cache misses occur, queries go straight to the backend LLM—creating higher latency and skyrocketing costs. Worse yet, these failures are often invisible.  

Your API returns a 200 OK, but behind the scenes, your cost and performance are suffering.

Bottom line: Unlike traditional caching, semantic caches introduce new risks:

  • Sudden model updates change embeddings and break matches.
  • Vector drift causes cache misses even for similar queries.
  • Users phrase things differently, leading to unexpected misses.

What we observed in the lab

To experiment with how semantic caching affects user experience and infrastructure cost, we built a testing lab environment locally.  

Here’s how it worked:

  • We created a FastAPI application running locally, exposing an endpoint /search via a public endpoint to make it reachable.
  • Every incoming search query followed this logic:
  • Cosmos DB Lookup → Check whether we’ve seen a similar semantic query before, using the query text as the key.
  • Cache Hit → Return the cached vector embedding directly, saving time and cost.
  • Cache Miss → Call Gemini Pro to generate a new vector embedding for the query, then store it in Cosmos DB for future reuse.
  • We sent the embedding to Azure AI Search, performing a vector similarity search to find the top matching documents.
  • Finally, we returned the search results plus two crucial custom HTTP headers:
  • X-Semantic-Cache: hit or miss
  • X-Semantic-Score (e.g. 0.8543) indicating how close the new query is to previous ones.

Test results

We configured a Catchpoint test to simulate user queries to our public endpoint URL. The test:

  • Sent randomized prompts (e.g. “NYC weather,” “New York forecast”) to trigger both cache hits and misses.
  • Captured and parsed the semantic headers using regex in Catchpoint to track:
  • Cache efficiency (% of hits vs. misses)
  • Semantic similarity scores
  • Visualized this data in dashboards to see latency differences between hits and misses.

This gave us real evidence of how semantic caching reduces API calls to the expensive LLM backend and improves response times—insights we could quantify directly in the Catchpoint Internet Performance Monitoring (IPM) portal.  

Below, are some helpful insights from our testing.

A graph with a line and a lineDescription automatically generated

Cache Hits vs. Misses: Measurable Latency Gap

The trend line in the graph above shows that overall, the response time was about 50% to 250% higher when semantic cache returned a MISS compared to a HIT.

Diving deeper, we observed that the first run of a prompt went to the backend (a cache miss), with higher latency and costs.

A screenshot of a computerDescription automatically generated

First Run: Cache Miss with High Latency

The second run of the same semantic query hit the cache, cutting response times by 50%.

A screenshot of a computerDescription automatically generated

Second Run: Served from Cache (hit). Same semantic score (prompt matched). Response time is 50% lower

Monitoring strategies to make semantic caching reliable

Semantic caching is no longer a background optimization—it’s a core pillar of agentic AI systems that reason and act in real-time. But to trust it, we need to measure how well it’s working.  

Here are three ways to monitor and improve its reliability:

#1. Test semantically similar queries

Semantic caching lives or dies on how well it matches similar questions. Use synthetic monitoring to simulate different phrasings of the same intent:

  • “Who’s the President of the US?”
  • “Who runs the US government?”
  • “Commander-in-Chief of America?”

Then compare their outcomes:

  • Did they result in cache hits or misses?
  • What were the semantic similarity scores?

This gives you visibility into whether your caching system is recognizing intent consistently. For agentic AI, it’s not enough for one query to be fast. You need confidence that all user expressions of the same intent are covered.

#2. Track semantic similarity scores

Semantic caches often return a similarity score (e.g. 0.85) to indicate how close the new query is to an existing cached answer. If your cache system returns a similarity score (e.g. 0.8343), you can:

  • Monitor it over time
  • Visualize trends
  • Alert if scores drop below thresholds

For instance, in our tests, both requests returned the same semantic score of 0.85224825.  

But if the model changes or query phrasing drifts, scores could drop, leading to unexpected misses and rising costs.

Monitoring these numbers ensures your semantic cache stays reliable—and that you’re not wasting money on backend calls unnecessarily.

#3. Measure real-world latency differences

One of the biggest promises of semantic caching is speed. Cache hits should be significantly faster than misses.

Monitoring this can:

  • Split metrics for cache hits vs. misses
  • Show precise latency differences
  • Alert when cache misses cause slowdowns

From our test results:

  • Cache miss response time: ~5 seconds
  • Cache hit response time: ~2 seconds

That’s a 2.5x speedup. In the world of agentic AI, that gap is the difference between a seamless conversation—and a frustrating pause.

Final takeaway

Semantic caching isn’t just a nice-to-have—it’s becoming core infrastructure for real-time AI systems. Cloud leaders like Fastly, AWS, and Azure are already baking it into their architectures. But it’s also uniquely fragile. Changes in language, embedding drift, or model updates can quietly degrade performance.

By combining semantic caching with IPM, teams can ensure that their systems are not only fast—but reliably so.

If you're running AI agents at scale, silent cache failures aren't just inefficiencies. They're risks. Measure them, monitor them, and mitigate them.  

Learn more: