







With Black Friday and the holiday season looming, IT teams everywhere are bracing themselves for what is, year after year, the most daunting stress test of your entire service delivery chain. Under relentless peak demand, every link in your digital experience is scrutinized by customers whose tolerance for friction is at an all-time low.
It’s not just about uptime, monitoring dashboards, or technical metrics. The real challenge is seeing and fixing the blind spots that only emerge under peak conditions, especially those invisible to traditional cloud-based monitoring. AWS’s recent outage is a powerful example of how the impact of these hidden vulnerabilities isn’t theoretical. Proactive detection is critical for resilience.
Recent findings from our 2025 Athletic Footwear and Apparel Benchmark reveal the scale of this disconnect. Performance can swing by 8× for users on different ISPs, even in the same city, with some customers waiting 28 seconds for a page that your cloud synthetic tests say loads in three. These are exactly the kinds of issues that can break your business when it matters most, and that hidden friction can go undetected until it costs you revenue.
Here's the technical reality behind the performance gaps top brands face. Traditional cloud monitoring tests from idealized conditions, including high-bandwidth connections, optimized routing, and minimal last-mile interference. But consumers don’t shop from the cloud.
Where you test from has as much impact on your results as what you test. Cloud-based synthetic metrics almost always make your site look faster and more resilient than it feels to actual people.
Our findings demonstrate how dramatically performance can shift depending on a user’s geography, ISP infrastructure, and network conditions. A retailer seeing consistently rapid load times in their dashboards could be losing substantial revenue in markets and segments where last-mile performance degrades to 2+ seconds—without realizing it.
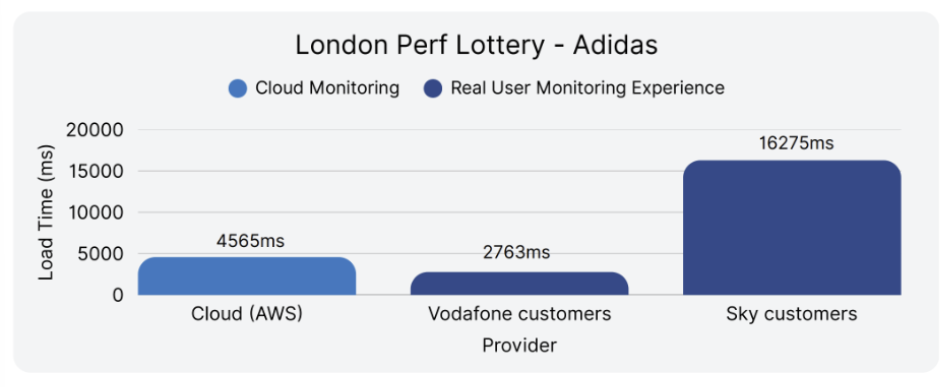
Consider Adidas’ London homepage.
Nike’s London homepage paints an even starker picture
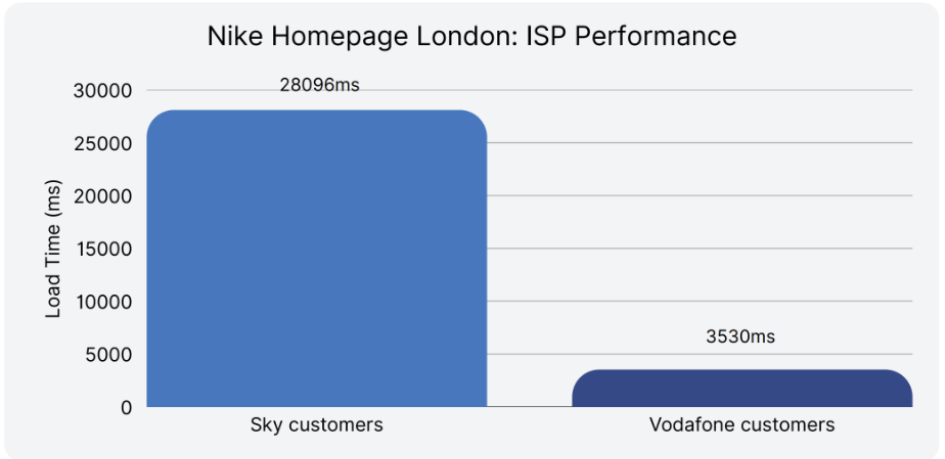
Nike users on Sky wait 28s vs. 3.5s for Vodafone — an 8× difference in the same city.
Similar issues were found across the broader retail sector.

Aldi's homepage provides a perfect technical example: from a U.S. cloud vantage point, it appeared to load in under 500 ms. But when measured from real user locations across diverse ISPs and network types, customers waited 2–5× longer. In Philadelphia, actual shoppers faced load times of 1,932 ms—nearly 2 seconds longer than cloud metrics suggested.
This isn't just about geographic differences. Even within the same city, performance can vary dramatically based on local ISP infrastructure, device capabilities, and to-the-minute network congestion.
During normal traffic periods, these monitoring blind spots might cause some user frustration but remain manageable. Black Friday changes everything. Traffic spikes of 5-10x normal levels expose every weakness in your performance stack:
The retailers that performed well during our benchmark testing, including companies like Aldi, IKEA, and Apple, succeeded because they monitored and optimized for real-world conditions, not just infrastructure metrics.
Effective monitoring during peak periods requires a fundamentally different approach than traditional cloud-based synthetic testing. The key components include:
This approach reveals performance bottlenecks that traditional monitoring misses; bottlenecks that become revenue-killing issues during Black Friday traffic surges.
Beyond the technical monitoring challenges, there's a resource reality that many teams face during peak periods. Our research consistently shows talent-related issues as the top challenge in reliability implementations—hiring, retention, and having enough skilled engineers available when you need them most.
Consider how this intensifies during Black Friday preparation. You need experienced engineers who can:
These skills are specialized, and the expertise is needed precisely when your team is already stretched thin.
The Internet Resilience Program was designed specifically to address these monitoring blind spots and resource constraints during critical periods. The program combines comprehensive real-world monitoring with dedicated engineering expertise for the periods when your business can't afford performance issues.
The program essentially provides the monitoring infrastructure and expertise to see performance from your users' perspective, not just your datacenter's perspective.
The data from our athletic footwear and retail benchmarks makes the case clear: traditional monitoring approaches are systematically missing performance issues that directly impact user experience and revenue. The gap between technical metrics and user reality is too significant to ignore, especially during peak shopping periods.
For teams preparing for Black Friday and similar high-traffic events, this means shifting focus from pure infrastructure monitoring to Internet Performance Monitoring (IPM) that captures real-world performance conditions. It means having the expertise and resources to act on that data when problems emerge.
The retailers winning in digital experience aren't just those with the best infrastructure, but the ones who understand what their users actually experience and have the capabilities to optimize for that reality.
Your dashboards might be green, but that doesn't mean your customers are having a good experience. The question is: do you have the monitoring and expertise in place to know the difference when it matters most?
Start here
Black Friday and the holiday season expose the gap between cloud monitoring and real user experience. Evidence from our industry benchmark reports proves that cloud-based tools often miss critical issues affecting customers. The Internet Resilience Program helps you spot and fix these blind spots—ensuring your site stays reliable when it matters most.
With Black Friday and the holiday season looming, IT teams everywhere are bracing themselves for what is, year after year, the most daunting stress test of your entire service delivery chain. Under relentless peak demand, every link in your digital experience is scrutinized by customers whose tolerance for friction is at an all-time low.
It’s not just about uptime, monitoring dashboards, or technical metrics. The real challenge is seeing and fixing the blind spots that only emerge under peak conditions, especially those invisible to traditional cloud-based monitoring. AWS’s recent outage is a powerful example of how the impact of these hidden vulnerabilities isn’t theoretical. Proactive detection is critical for resilience.
Recent findings from our 2025 Athletic Footwear and Apparel Benchmark reveal the scale of this disconnect. Performance can swing by 8× for users on different ISPs, even in the same city, with some customers waiting 28 seconds for a page that your cloud synthetic tests say loads in three. These are exactly the kinds of issues that can break your business when it matters most, and that hidden friction can go undetected until it costs you revenue.
Here's the technical reality behind the performance gaps top brands face. Traditional cloud monitoring tests from idealized conditions, including high-bandwidth connections, optimized routing, and minimal last-mile interference. But consumers don’t shop from the cloud.
Where you test from has as much impact on your results as what you test. Cloud-based synthetic metrics almost always make your site look faster and more resilient than it feels to actual people.
Our findings demonstrate how dramatically performance can shift depending on a user’s geography, ISP infrastructure, and network conditions. A retailer seeing consistently rapid load times in their dashboards could be losing substantial revenue in markets and segments where last-mile performance degrades to 2+ seconds—without realizing it.
Consider Adidas’ London homepage.
Nike’s London homepage paints an even starker picture
Nike users on Sky wait 28s vs. 3.5s for Vodafone — an 8× difference in the same city.
Similar issues were found across the broader retail sector.
Aldi's homepage provides a perfect technical example: from a U.S. cloud vantage point, it appeared to load in under 500 ms. But when measured from real user locations across diverse ISPs and network types, customers waited 2–5× longer. In Philadelphia, actual shoppers faced load times of 1,932 ms—nearly 2 seconds longer than cloud metrics suggested.
This isn't just about geographic differences. Even within the same city, performance can vary dramatically based on local ISP infrastructure, device capabilities, and to-the-minute network congestion.
During normal traffic periods, these monitoring blind spots might cause some user frustration but remain manageable. Black Friday changes everything. Traffic spikes of 5-10x normal levels expose every weakness in your performance stack:
The retailers that performed well during our benchmark testing, including companies like Aldi, IKEA, and Apple, succeeded because they monitored and optimized for real-world conditions, not just infrastructure metrics.
Effective monitoring during peak periods requires a fundamentally different approach than traditional cloud-based synthetic testing. The key components include:
This approach reveals performance bottlenecks that traditional monitoring misses; bottlenecks that become revenue-killing issues during Black Friday traffic surges.
Beyond the technical monitoring challenges, there's a resource reality that many teams face during peak periods. Our research consistently shows talent-related issues as the top challenge in reliability implementations—hiring, retention, and having enough skilled engineers available when you need them most.
Consider how this intensifies during Black Friday preparation. You need experienced engineers who can:
These skills are specialized, and the expertise is needed precisely when your team is already stretched thin.
The Internet Resilience Program was designed specifically to address these monitoring blind spots and resource constraints during critical periods. The program combines comprehensive real-world monitoring with dedicated engineering expertise for the periods when your business can't afford performance issues.
The program essentially provides the monitoring infrastructure and expertise to see performance from your users' perspective, not just your datacenter's perspective.
The data from our athletic footwear and retail benchmarks makes the case clear: traditional monitoring approaches are systematically missing performance issues that directly impact user experience and revenue. The gap between technical metrics and user reality is too significant to ignore, especially during peak shopping periods.
For teams preparing for Black Friday and similar high-traffic events, this means shifting focus from pure infrastructure monitoring to Internet Performance Monitoring (IPM) that captures real-world performance conditions. It means having the expertise and resources to act on that data when problems emerge.
The retailers winning in digital experience aren't just those with the best infrastructure, but the ones who understand what their users actually experience and have the capabilities to optimize for that reality.
Your dashboards might be green, but that doesn't mean your customers are having a good experience. The question is: do you have the monitoring and expertise in place to know the difference when it matters most?
Start here
This is some text inside of a div block.
此内容由惯性聚合(RSS阅读器)自动聚合整理,仅供阅读参考。 原文来自 — 版权归原作者所有。