





In modern observability practices, distributed tracing has become table stakes. Most application performance monitoring (APM) platforms encourage an “instrument everything” approach: Deploy an SDK or agent, hook into every service call and capture every user interaction at scale. On paper, this sounds like complete visibility. In practice, it can turn into a costly firehose of data with diminishing returns. To put this in perspective: If you have a 0.1% failure rate, you’re still capturing 99.99% of tracing and logging data you will most likely never use.
Honeycomb makes a compelling argument: “Every new host, pod, node or service adds to the APM bill… As they consume custom metrics, index data in additional formats such as traces and logs, and ration seat access, buyers are faced with a cost-visibility trade-off. Teams either find themselves overpaying for observability or sacrificing visibility to control costs.”
Enter synthetic tracing, a targeted, proactive approach that flips the model on its head. Instead of tracing every real user request, synthetic tracing executes controlled, continuous test transactions that mirror real user journeys. These synthetic transactions can be traced end to end across your distributed stack. The result: reduced costs, cleaner data and faster detection of meaningful issues.
Let’s break down why synthetic tracing is worth serious consideration, especially as observability costs and data sprawl continue to spiral.
Synthetic tracing is the practice of generating controlled, scripted transactions against your application and then instrumenting those test interactions with distributed tracing. It’s like sending a robot to test your app before real people use it. This robot follows a set of steps, such as logging in and making a payment, to verify that everything works as expected. Instead of waiting for real users to trigger a span or transaction, synthetic requests enable you to catch problems early, much like a canary used to warn miners about dangerous air.
For example, you might configure a synthetic trace to:
The key difference from real-user tracing is control:
For site reliability engineering (SRE)/DevOps teams, this means you can baseline performance for critical workflows, pinpoint bottlenecks and proactively validate fixes without waiting for a user to stumble across a problem first. If needed, you can always add tools like OpenTelemetry to capture all errors, including those of real users and or samples.
Traditional APM tracing relies on SDKs or agents to capture every request flowing through your application. Every API call, every database query, every interservice hop is captured and shipped off for aggregation. As Mezmo states “Most teams capture everything all the time, leading to expensive, overwhelming and often unnecessary data volumes.” While this provides massive amounts of data, it also creates several challenges:
The investment might be acceptable for some for Tier-1 apps where every transaction is mission critical or for new releases in QA cycles, but for Tier-2 and Tier-3 apps, the ROI becomes questionable. Worse, the “more data is better” philosophy often backfires by overwhelming both budgets and teams.
Further, the amount of data creates an illusion that the answer must be somewhere in the haystack of logs, events and traces. However, blind spots still exist: A significant portion of the stack in today’s distributed, service-dependent applications remains untraceable. To mitigate this, often the approach is to firehose logs from those services, but often that’s not enough because when those services are down or misbehaving; there is nothing useful in the logs they provide.
Synthetic tracing takes a different path. Instead of capturing all user interactions, you control when and how tracing occurs:
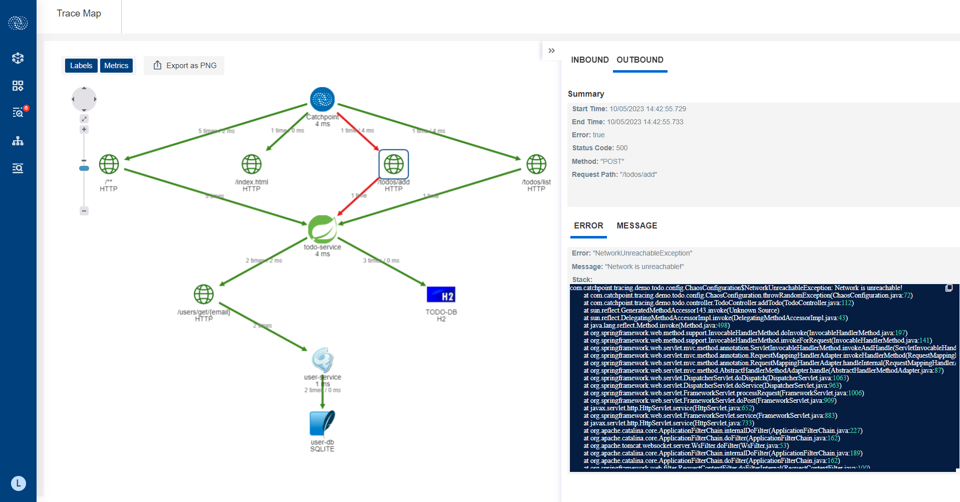
For Tier-1 business-critical systems, full distributed tracing may remain a non-negotiable requirement. But many organizations are discovering that synthetic tracing is more than sufficient for Tier-2 and Tier-3 apps, where:
Over time, even Tier-1 applications can benefit from a hybrid approach: Use synthetic tracing to continuously validate baseline performance and availability, while keeping full APM tracing for high-value transactions or complex incident investigations.
For some organizations, synthetic tracing may be the right approach. Especially when considering the cost of operations for a software company, where 10% of cost of goods sold (COGS) is allocated to infrastructure and 5% to personnel, while spending 5% on monitoring may be unacceptable. Monitoring shouldn’t be more than 1% to 2 % of the revenue of a product; otherwise, the company will struggle to make the operating margins work.
The industry mantra has long been “more data equals more visibility.” Synthetic tracing challenges that assumption. In reality, better data is better.
Targeted traces capture the right context at the right time. Controlled test conditions eliminate variability and guesswork, and, of critical importance, global vantage points ensure you understand not just what the server executed, but how it felt to an end user in São Paulo, Singapore or San Francisco.
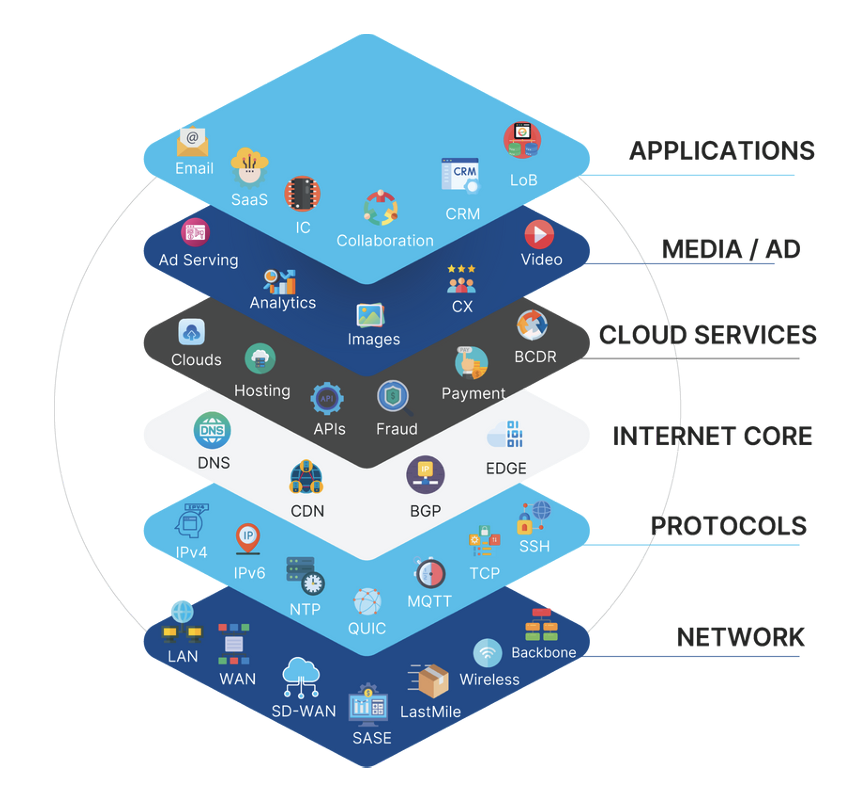
Monitoring exclusively from hyperscaler environments misses essential real-world variables like last-mile congestion, ISP routing, carrier-grade NAT, local DNS resolution and edge/cache viability. These are not theoretical gaps; they have a material impact on how users experience applications every day.
This precision means teams spend less time sifting through noisy trace data and more time solving real problems.
Synthetic tracing won’t replace APM everywhere, nor should it. But for organizations struggling with observability costs and alert fatigue, it offers a powerful complement — and in many cases, a smarter, more sustainable path forward.
Sometimes less really is more. Or rather: Better is better.
Take our guided tour to learn how Catchpoint correlates synthetic traces with Internet and application performance data
Synthetic tracing lets you send a "robot" through your most critical user journeys on a fixed schedule, then trace that traffic end to end across the entire internet stack — without paying to instrument every real user click. The result is fewer blind spots, far less data (and cost), and faster, cleaner signals when something breaks, especially for noisy, non‑Tier‑1 apps where “trace everything” observability is starting to look unsustainably expensive.
In modern observability practices, distributed tracing has become table stakes. Most application performance monitoring (APM) platforms encourage an “instrument everything” approach: Deploy an SDK or agent, hook into every service call and capture every user interaction at scale. On paper, this sounds like complete visibility. In practice, it can turn into a costly firehose of data with diminishing returns. To put this in perspective: If you have a 0.1% failure rate, you’re still capturing 99.99% of tracing and logging data you will most likely never use.
Honeycomb makes a compelling argument: “Every new host, pod, node or service adds to the APM bill… As they consume custom metrics, index data in additional formats such as traces and logs, and ration seat access, buyers are faced with a cost-visibility trade-off. Teams either find themselves overpaying for observability or sacrificing visibility to control costs.”
Enter synthetic tracing, a targeted, proactive approach that flips the model on its head. Instead of tracing every real user request, synthetic tracing executes controlled, continuous test transactions that mirror real user journeys. These synthetic transactions can be traced end to end across your distributed stack. The result: reduced costs, cleaner data and faster detection of meaningful issues.
Let’s break down why synthetic tracing is worth serious consideration, especially as observability costs and data sprawl continue to spiral.
Synthetic tracing is the practice of generating controlled, scripted transactions against your application and then instrumenting those test interactions with distributed tracing. It’s like sending a robot to test your app before real people use it. This robot follows a set of steps, such as logging in and making a payment, to verify that everything works as expected. Instead of waiting for real users to trigger a span or transaction, synthetic requests enable you to catch problems early, much like a canary used to warn miners about dangerous air.
For example, you might configure a synthetic trace to:
The key difference from real-user tracing is control:
For site reliability engineering (SRE)/DevOps teams, this means you can baseline performance for critical workflows, pinpoint bottlenecks and proactively validate fixes without waiting for a user to stumble across a problem first. If needed, you can always add tools like OpenTelemetry to capture all errors, including those of real users and or samples.
Traditional APM tracing relies on SDKs or agents to capture every request flowing through your application. Every API call, every database query, every interservice hop is captured and shipped off for aggregation. As Mezmo states “Most teams capture everything all the time, leading to expensive, overwhelming and often unnecessary data volumes.” While this provides massive amounts of data, it also creates several challenges:
The investment might be acceptable for some for Tier-1 apps where every transaction is mission critical or for new releases in QA cycles, but for Tier-2 and Tier-3 apps, the ROI becomes questionable. Worse, the “more data is better” philosophy often backfires by overwhelming both budgets and teams.
Further, the amount of data creates an illusion that the answer must be somewhere in the haystack of logs, events and traces. However, blind spots still exist: A significant portion of the stack in today’s distributed, service-dependent applications remains untraceable. To mitigate this, often the approach is to firehose logs from those services, but often that’s not enough because when those services are down or misbehaving; there is nothing useful in the logs they provide.
Synthetic tracing takes a different path. Instead of capturing all user interactions, you control when and how tracing occurs:
For Tier-1 business-critical systems, full distributed tracing may remain a non-negotiable requirement. But many organizations are discovering that synthetic tracing is more than sufficient for Tier-2 and Tier-3 apps, where:
Over time, even Tier-1 applications can benefit from a hybrid approach: Use synthetic tracing to continuously validate baseline performance and availability, while keeping full APM tracing for high-value transactions or complex incident investigations.
For some organizations, synthetic tracing may be the right approach. Especially when considering the cost of operations for a software company, where 10% of cost of goods sold (COGS) is allocated to infrastructure and 5% to personnel, while spending 5% on monitoring may be unacceptable. Monitoring shouldn’t be more than 1% to 2 % of the revenue of a product; otherwise, the company will struggle to make the operating margins work.
The industry mantra has long been “more data equals more visibility.” Synthetic tracing challenges that assumption. In reality, better data is better.
Targeted traces capture the right context at the right time. Controlled test conditions eliminate variability and guesswork, and, of critical importance, global vantage points ensure you understand not just what the server executed, but how it felt to an end user in São Paulo, Singapore or San Francisco.
Monitoring exclusively from hyperscaler environments misses essential real-world variables like last-mile congestion, ISP routing, carrier-grade NAT, local DNS resolution and edge/cache viability. These are not theoretical gaps; they have a material impact on how users experience applications every day.
This precision means teams spend less time sifting through noisy trace data and more time solving real problems.
Synthetic tracing won’t replace APM everywhere, nor should it. But for organizations struggling with observability costs and alert fatigue, it offers a powerful complement — and in many cases, a smarter, more sustainable path forward.
Sometimes less really is more. Or rather: Better is better.
Take our guided tour to learn how Catchpoint correlates synthetic traces with Internet and application performance data
This is some text inside of a div block.
此内容由惯性聚合(RSS阅读器)自动聚合整理,仅供阅读参考。 原文来自 — 版权归原作者所有。