





Over the past few years at Catchpoint, we’ve benchmarked the digital performance of banks, airlines, hotels, travel aggregators, GenAI platforms, athletic footwear brands, and even ad hoc events like the Super Bowl, Olympics, and Election Day. Each time, our approach focused on the technical metrics performance professionals live and breathe: DNS resolution times, Time to First Byte, page load speeds, and six other core measurements that we'd dissect, analyze, and use to rank companies.
The process was thorough, data-driven, and produced insights that resonated with our technical audience. But as we prepared our latest retail benchmark report, something didn’t sit well with this approach.
Anyone who works in web performance or SRE knows this feeling: users are complaining about slow page loads, but when you check the dashboard, everything's green. Your DNS is resolving in under 50ms, TTFB looks solid, and your availability is at 99.9%. Yet somehow, real users are still having a terrible experience.
This disconnect between technical metrics and user reality was the unspoken challenge in our previous reports. Who really cared if Marriott had the highest document complete time in a two-week snapshot? The user on the street doesn't care about milliseconds or Cumulative Layout Shift values. When they press a button, they just want speed and responsiveness.
So, what if there was a way we could rank the companies we tested, not according to their technical metrics, but the actual experience they provided to end users?
For our new retail report, we decided to try something different. Actually, that's not quite accurate — we decided to use something we already had, something we'd been leveraging for Catchpoint customers for years. It was staring right at us in plain sight: Experience Scores.
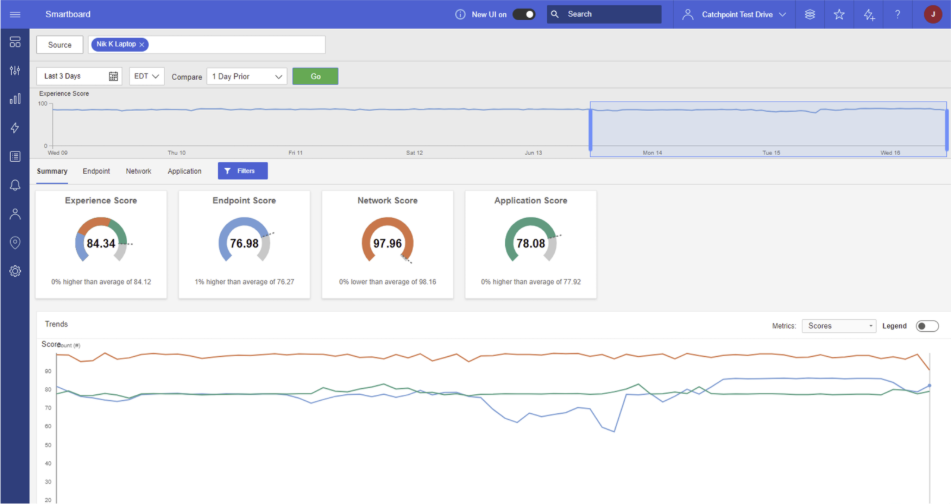
Experience Scores aggregate endpoint, network, and application insights into a single number between 0 and 100 that reflects what customers actually experience when interacting with a website or application. Unlike traditional infrastructure metrics that tell you about your systems, Experience Scores tell you about you about the experience of your users.
Made possible by our Global Agent Network, they capture the holistic picture, considering device performance variations, network quality, real-world latency, and interactive experience quality that affects user satisfaction. After all, users don’t live in the cloud, last mile conditions matter when it comes to user experience, which is a key differentiator of the Catchpoint platform. So that's exactly what we decided to do.
How did we run the study?
We tested brands from the NRF Top 50 Global Retailers list for three weeks. But we didn't just measure Experience Scores. We also captured all eight traditional performance metrics we'd always used, applying the same weighted methodology from our previous reports.
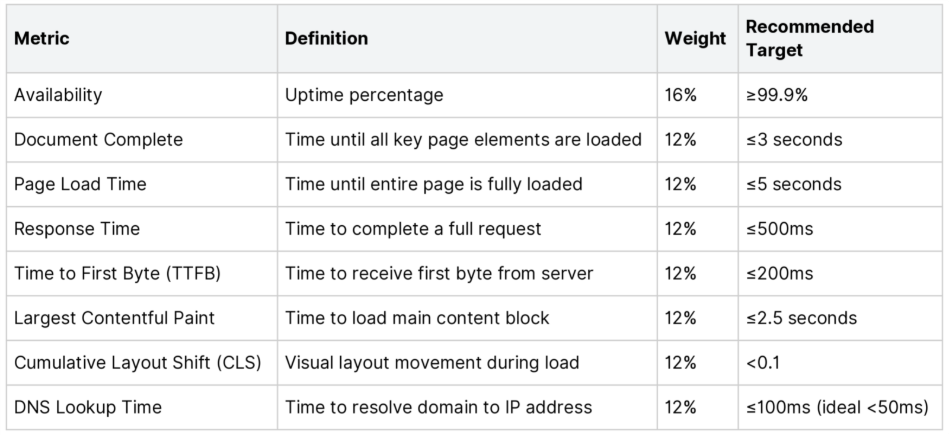
This dual approach would let us compare how traditional technical rankings stacked up against actual user experience.
Then we waited. What we found was fascinating
When the numbers came in, the results were striking. A few highlights stood out right away:
You can dive into the full report to see all of the patterns we uncovered. But one finding in particular jumped out: the sharp divergence between traditional metrics and actual user experience.
Over 70% of retailers showed significant ranking differences (5 or more positions) between their traditional metrics performance and their Experience Score ranking.
Let that sink in.
In other words, more than two-thirds of the retailers we tested would tell a completely different story depending on whether you looked at technical metrics or actual user experience.
| Exp Rank | Retailer | Exp Score | Trad Rank | Rank Diff |
|---|---|---|---|---|
| 1 | Aldi | 100 | 1 | 0 |
| 2 | Action | 99 | 6 | +4 |
| 3 | IKEA | 98 | 3 | 0 |
| 4 | Euronics International | 97 | 5 | +1 |
| 5 | Aspiag | 97 | 18 | +14 |
| 6 | Apple | 96 | 2 | -4 |
| 7 | TJX Companies | 96 | 26 | +20 |
| 8 | Adeo | 96 | 8 | +2 |
| 9 | Carrefour | 96 | 13 | +7 |
| 10 | Lulu Group | 94 | 7 | -3 |
| 11 | Metro AG | 93 | 28 | +17 |
| 12 | Fast Retailing | 92 | 10 | -2 |
| 13 | Rakuten | 92 | 21 | +9 |
| 14 | Ceconomy | 91 | 11 | -3 |
| 15 | Walgreens Boots Alliance | 90 | 29 | +14 |
| 16 | Amazon | 90 | 4 | -11 |
| 17 | Migros | 89 | 12 | -5 |
| 18 | Phoenix Group | 88 | 24 | +6 |
| 19 | H&M | 87 | 23 | +4 |
| 20 | Expert | 84 | 41 | +21 |
| 21 | Best Buy | 84 | 9 | -11 |
| 22 | AS Watson | 83 | 16 | -6 |
| 23 | Rewe | 83 | 37 | +15 |
| 24 | Auchan | 83 | 38 | +16 |
| 25 | Couche-Tard | 79 | 19 | -6 |
| 26 | Schwarz | 77 | 30 | +4 |
| 27 | Leclerc | 77 | 39 | +13 |
| 28 | Kingfisher | 75 | 33 | +5 |
| 29 | Ahold Delhaize | 71 | 44 | +15 |
| 30 | Cencosud | 71 | 43 | +14 |
| 31 | Walmart | 68 | 15 | -16 |
| 32 | Jeronimo Martins | 67 | 47 | +15 |
| 33 | DM Drogerie Markt | 67 | 16 | -16 |
| 34 | Lawson | 67 | 34 | +2 |
| 35 | Costco | 66 | 14 | -21 |
| 36 | Inditex | 65 | 45 | +9 |
| 37 | Primark | 64 | 31 | -6 |
| 38 | Falabella | 61 | 20 | -18 |
| 39 | Aeon | 59 | 35 | -4 |
| 40 | Tesco | 58 | 25 | -15 |
| 41 | P All (7-Eleven Thailand) | 55 | 46 | +5 |
| 42 | Target | 54 | 36 | -6 |
| 43 | Sephora (LVMH) | 52 | 32 | -11 |
| 44 | FamilyMart | 52 | 40 | -3 |
| 45 | Lululemon | 52 | 22 | -21 |
| 46 | Seven & I | 51 | 27 | -19 |
| 47 | Alibaba | 50 | 42 | -5 |
Key
Some retailers looked great on paper but gave customers a very different experience once they hit the site:
On the flip side, some brands delighted customers even when their technical stats weren’t perfect:
Across the board, consistency separated the best performers from the rest:
The data validates something many in the performance world have long suspected: technical perfection doesn't guarantee user satisfaction.
The retailers achieving high Experience Scores despite ok traditional metrics likely succeeded through optimized critical rendering paths, effective front-end performance strategies, and superior user experience design that masked backend latency. Meanwhile, retailers with good technical metrics but poor Experience Scores were probably missing the real-world performance variations, network condition impacts, and interactive quality issues that actually affect users.
With the global retail digital transformation market expanding at 17.6% CAGR to reach $1.04 trillion by 2032, performance isn't just a technical consideration—it's becoming a competitive differentiator. Market share is being redistributed based on digital experience quality, not just technical infrastructure quality.
The retailers that understand this distinction, that recognize user experience as the ultimate metric, are the ones positioning themselves to win.
Of course, technical metrics remain important, but they're diagnostic tools, not the end goal. The end goal is user satisfaction.
For performance teams, this suggests a shift from purely technical KPIs to more holistic, Experience Level Objectives: metrics that directly gauge user experience and satisfaction. Instead of just tracking whether systems are up and technically fast, we need to track whether users are having good experiences.
Going forward, our industry benchmark reports will lead with Experience Scores while still providing the technical metric breakdowns that help teams understand what's driving user experience outcomes. Because at the end of the day, users don't care about your TTFB or DNS resolution times. They care about whether your site feels fast and responsive.
And as our retail report shows, those can be two very different things.
Read the full benchmark report
Curious how your retail brand compares?
Get a free retail assessment with one of our Internet Performance Monitoring experts to understand both your technical metrics and your actual user experience performance.
Over the past few years at Catchpoint, we’ve benchmarked the digital performance of banks, airlines, hotels, travel aggregators, GenAI platforms, athletic footwear brands, and even ad hoc events like the Super Bowl, Olympics, and Election Day. Each time, our approach focused on the technical metrics performance professionals live and breathe: DNS resolution times, Time to First Byte, page load speeds, and six other core measurements that we'd dissect, analyze, and use to rank companies.
The process was thorough, data-driven, and produced insights that resonated with our technical audience. But as we prepared our latest retail benchmark report, something didn’t sit well with this approach.
Anyone who works in web performance or SRE knows this feeling: users are complaining about slow page loads, but when you check the dashboard, everything's green. Your DNS is resolving in under 50ms, TTFB looks solid, and your availability is at 99.9%. Yet somehow, real users are still having a terrible experience.
This disconnect between technical metrics and user reality was the unspoken challenge in our previous reports. Who really cared if Marriott had the highest document complete time in a two-week snapshot? The user on the street doesn't care about milliseconds or Cumulative Layout Shift values. When they press a button, they just want speed and responsiveness.
So, what if there was a way we could rank the companies we tested, not according to their technical metrics, but the actual experience they provided to end users?
For our new retail report, we decided to try something different. Actually, that's not quite accurate — we decided to use something we already had, something we'd been leveraging for Catchpoint customers for years. It was staring right at us in plain sight: Experience Scores.
Experience Scores aggregate endpoint, network, and application insights into a single number between 0 and 100 that reflects what customers actually experience when interacting with a website or application. Unlike traditional infrastructure metrics that tell you about your systems, Experience Scores tell you about you about the experience of your users.
Made possible by our Global Agent Network, they capture the holistic picture, considering device performance variations, network quality, real-world latency, and interactive experience quality that affects user satisfaction. After all, users don’t live in the cloud, last mile conditions matter when it comes to user experience, which is a key differentiator of the Catchpoint platform. So that's exactly what we decided to do.
How did we run the study?
We tested brands from the NRF Top 50 Global Retailers list for three weeks. But we didn't just measure Experience Scores. We also captured all eight traditional performance metrics we'd always used, applying the same weighted methodology from our previous reports.
This dual approach would let us compare how traditional technical rankings stacked up against actual user experience.
Then we waited. What we found was fascinating
When the numbers came in, the results were striking. A few highlights stood out right away:
You can dive into the full report to see all of the patterns we uncovered. But one finding in particular jumped out: the sharp divergence between traditional metrics and actual user experience.
Over 70% of retailers showed significant ranking differences (5 or more positions) between their traditional metrics performance and their Experience Score ranking.
Let that sink in.
In other words, more than two-thirds of the retailers we tested would tell a completely different story depending on whether you looked at technical metrics or actual user experience.
| Exp Rank | Retailer | Exp Score | Trad Rank | Rank Diff |
|---|---|---|---|---|
| 1 | Aldi | 100 | 1 | 0 |
| 2 | Action | 99 | 6 | +4 |
| 3 | IKEA | 98 | 3 | 0 |
| 4 | Euronics International | 97 | 5 | +1 |
| 5 | Aspiag | 97 | 18 | +14 |
| 6 | Apple | 96 | 2 | -4 |
| 7 | TJX Companies | 96 | 26 | +20 |
| 8 | Adeo | 96 | 8 | +2 |
| 9 | Carrefour | 96 | 13 | +7 |
| 10 | Lulu Group | 94 | 7 | -3 |
| 11 | Metro AG | 93 | 28 | +17 |
| 12 | Fast Retailing | 92 | 10 | -2 |
| 13 | Rakuten | 92 | 21 | +9 |
| 14 | Ceconomy | 91 | 11 | -3 |
| 15 | Walgreens Boots Alliance | 90 | 29 | +14 |
| 16 | Amazon | 90 | 4 | -11 |
| 17 | Migros | 89 | 12 | -5 |
| 18 | Phoenix Group | 88 | 24 | +6 |
| 19 | H&M | 87 | 23 | +4 |
| 20 | Expert | 84 | 41 | +21 |
| 21 | Best Buy | 84 | 9 | -11 |
| 22 | AS Watson | 83 | 16 | -6 |
| 23 | Rewe | 83 | 37 | +15 |
| 24 | Auchan | 83 | 38 | +16 |
| 25 | Couche-Tard | 79 | 19 | -6 |
| 26 | Schwarz | 77 | 30 | +4 |
| 27 | Leclerc | 77 | 39 | +13 |
| 28 | Kingfisher | 75 | 33 | +5 |
| 29 | Ahold Delhaize | 71 | 44 | +15 |
| 30 | Cencosud | 71 | 43 | +14 |
| 31 | Walmart | 68 | 15 | -16 |
| 32 | Jeronimo Martins | 67 | 47 | +15 |
| 33 | DM Drogerie Markt | 67 | 16 | -16 |
| 34 | Lawson | 67 | 34 | +2 |
| 35 | Costco | 66 | 14 | -21 |
| 36 | Inditex | 65 | 45 | +9 |
| 37 | Primark | 64 | 31 | -6 |
| 38 | Falabella | 61 | 20 | -18 |
| 39 | Aeon | 59 | 35 | -4 |
| 40 | Tesco | 58 | 25 | -15 |
| 41 | P All (7-Eleven Thailand) | 55 | 46 | +5 |
| 42 | Target | 54 | 36 | -6 |
| 43 | Sephora (LVMH) | 52 | 32 | -11 |
| 44 | FamilyMart | 52 | 40 | -3 |
| 45 | Lululemon | 52 | 22 | -21 |
| 46 | Seven & I | 51 | 27 | -19 |
| 47 | Alibaba | 50 | 42 | -5 |
Key
Some retailers looked great on paper but gave customers a very different experience once they hit the site:
On the flip side, some brands delighted customers even when their technical stats weren’t perfect:
Across the board, consistency separated the best performers from the rest:
The data validates something many in the performance world have long suspected: technical perfection doesn't guarantee user satisfaction.
The retailers achieving high Experience Scores despite ok traditional metrics likely succeeded through optimized critical rendering paths, effective front-end performance strategies, and superior user experience design that masked backend latency. Meanwhile, retailers with good technical metrics but poor Experience Scores were probably missing the real-world performance variations, network condition impacts, and interactive quality issues that actually affect users.
With the global retail digital transformation market expanding at 17.6% CAGR to reach $1.04 trillion by 2032, performance isn't just a technical consideration—it's becoming a competitive differentiator. Market share is being redistributed based on digital experience quality, not just technical infrastructure quality.
The retailers that understand this distinction, that recognize user experience as the ultimate metric, are the ones positioning themselves to win.
Of course, technical metrics remain important, but they're diagnostic tools, not the end goal. The end goal is user satisfaction.
For performance teams, this suggests a shift from purely technical KPIs to more holistic, Experience Level Objectives: metrics that directly gauge user experience and satisfaction. Instead of just tracking whether systems are up and technically fast, we need to track whether users are having good experiences.
Going forward, our industry benchmark reports will lead with Experience Scores while still providing the technical metric breakdowns that help teams understand what's driving user experience outcomes. Because at the end of the day, users don't care about your TTFB or DNS resolution times. They care about whether your site feels fast and responsive.
And as our retail report shows, those can be two very different things.
Read the full benchmark report
Curious how your retail brand compares?
Get a free retail assessment with one of our Internet Performance Monitoring experts to understand both your technical metrics and your actual user experience performance.
此内容由惯性聚合(RSS阅读器)自动聚合整理,仅供阅读参考。 原文来自 — 版权归原作者所有。