


Recently I was asked to offer my opinions on Application Performance Management (APM) and Observability (o11y) - how they overlap, compete, and conflict. I was just one of several folks who's ideas were solicited, so (understandably) some of my thoughts were left out of the original article.
HOWEVER, I'm never one to let good words (or at least a lot of words) go to waste, so I thought I'd pull them together here. I've eschewed the Q&A format of the original solicitation so that, hopefully, these ideas flow together a little better.
I also have to point out that this was a response for APMdigest, and moreover for a discussion of “APM versus Observability”. As such my responses focused on those two technologies rather than expounding on the glory that is Internet Performance Monitoring (IPM) or the various advantages Catchpoint brings to the table.
I'm going to start by stating, unequivocally, that there is a lot (my editor won't let me use the word "rampant" *) confusion in the market about APM and o11y. Most of the confusion, I'm sorry to say, is due to self-inflicted wounding by vendors who tweak terms to suit their needs (and their products).
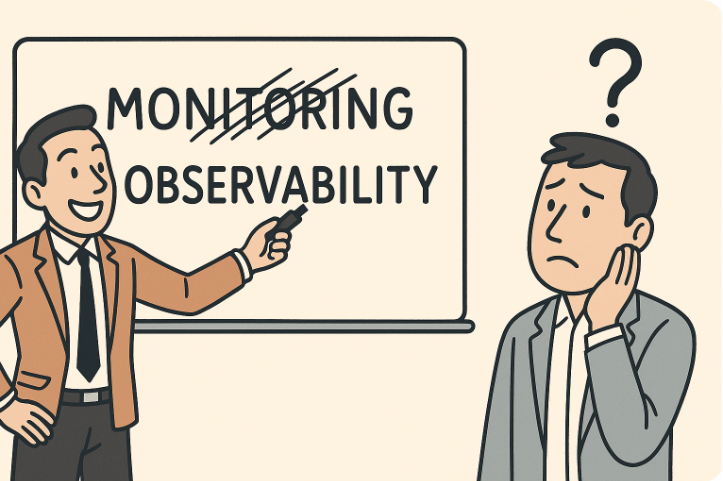
In fact, when asked for a plain-language explanation of what observability was, one executive from a former company memorably (and horrifyingly) responded "...monitoring is when someone sits at a computer and looks at log files. Observability is what our customers want." Yup, that was the best he could offer. He really didn't understand anything beyond that statement.
This example not only underscores the rampant misunderstandings within the industry, it also highlights the lengths to which some folks will go to invent - sometimes out of whole cloth - definitions of technology.
To be clear, this is not unique to APM or observability (or even technology in general). But it sure doesn't help.
In my (not so) humble opinion, APM - as the name implies - is a specific set of actions that one can take to understand how an application is performing from a particular point of view (location) or multiple points of view (sets of locations). Functionally, this means a command or utility is run from one or more locations, targeting some aspect of an application, and returning the results of those commands or tests as measurable data. All of that - the command, the multiple locations, and the ability to aggregate all the data - rolls up into what APM vendors would call a "feature" of their solution.
Having said that "APM [...] is a specific set of actions..." it's important to note that not all APM solutions contain every possible feature, tool, utility, or command under the APM umbrella. Like all software solutions, each product will emphasize some elements while minimizing (or eliminating) others.
MEANWHILE, BACK AT THE NOC... observability is far more a philosophy than it is a specific set of actions, utilities, tools, or features. Observability is concerned with the potential - irrespective of the tool being used - for the application to report on itself, without the need to be prompted, checked, or tested. It has also come to include ideas (and ideals) about cardinality (unique-ness) of data points; whether the focus is on well-known vs unpredictable events; and more.
To use an analogy: APM is a type of ship - whether that's a sailboat, battleship, or rowboat. But observability is more than just the water or the current conditions at sea. It's the context - whether you're on a lake, whitewater rapids, the open ocean, or polar ice.
What I will say is that APM, as it's traditionally defined, is no longer sufficient. The world of apps has changed from the time APM became a category on the Gartner magic quadrant list. Applications (whether web-based, on a phone, etc.) are now a collection of APIs, microservices, and systems separated not only by geography but by cloud platform. Many APM solutions don't have the range of tooling or depth of insight needed.
For observability - meaning the philosophy - to be effective in terms of APM, we need to understand the entire system. This ability goes beyond "the application" as understood by many APM tools today. This is where a newer category of solution - Internet Performance Monitoring (IPM) and/or Digital Experience Management (DEM) is needed.
IPM / DEM adds layers to the APM solution set, including code level insights (via tracing) and the network layer (specifically BGP and ASs). and network awareness. Because the problem could be a bad code push. Or it might be a bad route through your provider's network (or their provider. Or the provider of their provider.).
But IPM - so far as it's a relatively new term and therefore our responsibility to define clearly and in the least vendor-specific ways - is about much more than which tools, technologies, tests, and techniques we bring to bear. It's about a fundamental shifting in the point of view of the telemetry collected.
I plan to explore this idea in more depth later, but for the time being, let me leave things here: In the misty past of monitoring, we didn't have any data that could definitively tell us, directly, about the user's experience. All we had were lower-level metrics from which we could infer what was happening in front of the user's screen. That all changed with advent of traces, and the increasing viability of techniques like RUM and synthetic transactions in the production context.
But the presentation to IT practitioners - the dashboards, reports, and alerts - have failed to shift accordingly. You still see displays that show lower-level data from which we have to infer the user experience. IPM (as opposed to APM) is in large part a shift in that focus. Emphasizing the user's experience as the thing that takes center stage. If (and only if) that is impacted, do we begin to delve deeper into the data to see where the root cause lies.
Compare what you can monitor with APM vs IPM
FOOTNOTES/SIDEBAR BELOW
* You see that he found a way to sneak it in anyway - editor
Recently I was asked to offer my opinions on Application Performance Management (APM) and Observability (o11y) - how they overlap, compete, and conflict. I was just one of several folks who's ideas were solicited, so (understandably) some of my thoughts were left out of the original article.
HOWEVER, I'm never one to let good words (or at least a lot of words) go to waste, so I thought I'd pull them together here. I've eschewed the Q&A format of the original solicitation so that, hopefully, these ideas flow together a little better.
I also have to point out that this was a response for APMdigest, and moreover for a discussion of “APM versus Observability”. As such my responses focused on those two technologies rather than expounding on the glory that is Internet Performance Monitoring (IPM) or the various advantages Catchpoint brings to the table.
I'm going to start by stating, unequivocally, that there is a lot (my editor won't let me use the word "rampant" *) confusion in the market about APM and o11y. Most of the confusion, I'm sorry to say, is due to self-inflicted wounding by vendors who tweak terms to suit their needs (and their products).
In fact, when asked for a plain-language explanation of what observability was, one executive from a former company memorably (and horrifyingly) responded "...monitoring is when someone sits at a computer and looks at log files. Observability is what our customers want." Yup, that was the best he could offer. He really didn't understand anything beyond that statement.
This example not only underscores the rampant misunderstandings within the industry, it also highlights the lengths to which some folks will go to invent - sometimes out of whole cloth - definitions of technology.
To be clear, this is not unique to APM or observability (or even technology in general). But it sure doesn't help.
In my (not so) humble opinion, APM - as the name implies - is a specific set of actions that one can take to understand how an application is performing from a particular point of view (location) or multiple points of view (sets of locations). Functionally, this means a command or utility is run from one or more locations, targeting some aspect of an application, and returning the results of those commands or tests as measurable data. All of that - the command, the multiple locations, and the ability to aggregate all the data - rolls up into what APM vendors would call a "feature" of their solution.
Having said that "APM [...] is a specific set of actions..." it's important to note that not all APM solutions contain every possible feature, tool, utility, or command under the APM umbrella. Like all software solutions, each product will emphasize some elements while minimizing (or eliminating) others.
MEANWHILE, BACK AT THE NOC... observability is far more a philosophy than it is a specific set of actions, utilities, tools, or features. Observability is concerned with the potential - irrespective of the tool being used - for the application to report on itself, without the need to be prompted, checked, or tested. It has also come to include ideas (and ideals) about cardinality (unique-ness) of data points; whether the focus is on well-known vs unpredictable events; and more.
To use an analogy: APM is a type of ship - whether that's a sailboat, battleship, or rowboat. But observability is more than just the water or the current conditions at sea. It's the context - whether you're on a lake, whitewater rapids, the open ocean, or polar ice.
What I will say is that APM, as it's traditionally defined, is no longer sufficient. The world of apps has changed from the time APM became a category on the Gartner magic quadrant list. Applications (whether web-based, on a phone, etc.) are now a collection of APIs, microservices, and systems separated not only by geography but by cloud platform. Many APM solutions don't have the range of tooling or depth of insight needed.
For observability - meaning the philosophy - to be effective in terms of APM, we need to understand the entire system. This ability goes beyond "the application" as understood by many APM tools today. This is where a newer category of solution - Internet Performance Monitoring (IPM) and/or Digital Experience Management (DEM) is needed.
IPM / DEM adds layers to the APM solution set, including code level insights (via tracing) and the network layer (specifically BGP and ASs). and network awareness. Because the problem could be a bad code push. Or it might be a bad route through your provider's network (or their provider. Or the provider of their provider.).
But IPM - so far as it's a relatively new term and therefore our responsibility to define clearly and in the least vendor-specific ways - is about much more than which tools, technologies, tests, and techniques we bring to bear. It's about a fundamental shifting in the point of view of the telemetry collected.
I plan to explore this idea in more depth later, but for the time being, let me leave things here: In the misty past of monitoring, we didn't have any data that could definitively tell us, directly, about the user's experience. All we had were lower-level metrics from which we could infer what was happening in front of the user's screen. That all changed with advent of traces, and the increasing viability of techniques like RUM and synthetic transactions in the production context.
But the presentation to IT practitioners - the dashboards, reports, and alerts - have failed to shift accordingly. You still see displays that show lower-level data from which we have to infer the user experience. IPM (as opposed to APM) is in large part a shift in that focus. Emphasizing the user's experience as the thing that takes center stage. If (and only if) that is impacted, do we begin to delve deeper into the data to see where the root cause lies.
Compare what you can monitor with APM vs IPM
FOOTNOTES/SIDEBAR BELOW
* You see that he found a way to sneak it in anyway - editor
此内容由惯性聚合(RSS阅读器)自动聚合整理,仅供阅读参考。 原文来自 — 版权归原作者所有。