











Reliability used to mean “are we up?” Today, customers ask something more demanding: “Are you fast, everywhere, every time?”
The SRE Report 2026 shows that this change is no longer emerging. It is already established.
Across two years of data, one message holds steady: slow apps are dead apps. In last year’s report, a majority of organizations (53%) agreed with the phrase “slow is the new down,” even though many had never heard it before. In the 2026 report, 67% of respondents agreed that performance degradation is as serious as downtime. That belief has settled.
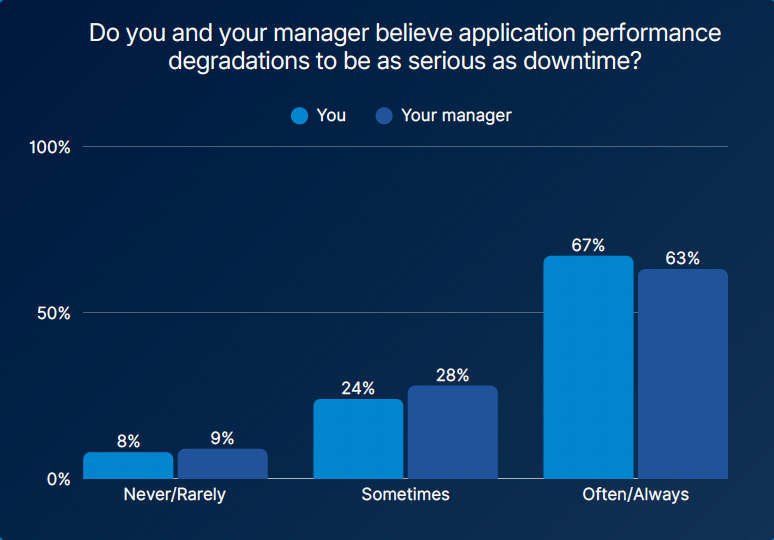
Reliability is no longer measured only by uptime. It is measured by how fast, how steady, and how confidently digital experiences work in every location where users connect. When a login hangs or a checkout page drags, customers do not care whether the cause is an outage or a delay. The result feels the same and trust drops either way.
This year’s data pushes further by testing whether belief translates into action. The report combined two questions to form a quadrant view.
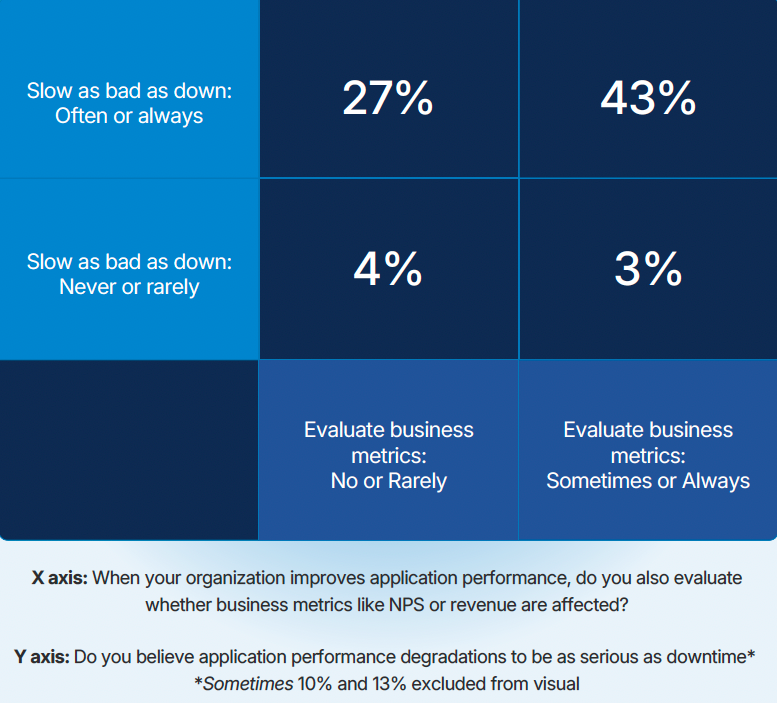
The result exposes four patterns:
The quadrant reveals a pattern where most respondents now agree, in principle, that degraded performance is a reliability failure, yet fewer than half have built the feedback loops to prove what that failure costs in terms the business cares about.
The fact that most teams have mature dashboards and synthetic tests tells its own story.
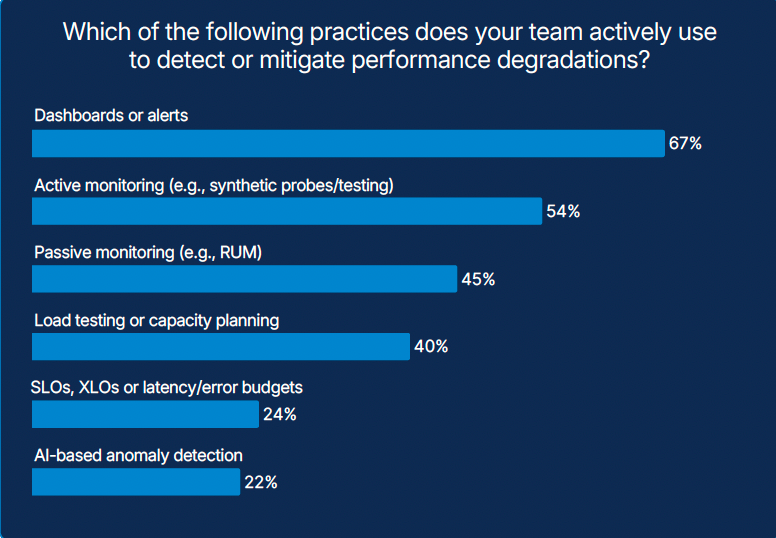
When performance data stays technical, with dashboards, alerts, and latency charts, it struggles to compete with business priorities. But when reliability is tied to outcomes customers and executives care about, it stops being an operational cost and starts becoming a strategic lever.
Teams that connect performance to outcomes see different results. Reliability work gains visibility. Prioritization becomes easier. Long-term trust becomes easier to defend.
Another signal reinforces this point. Fewer than one in four organizations formally model the financial cost of slowness or downtime.
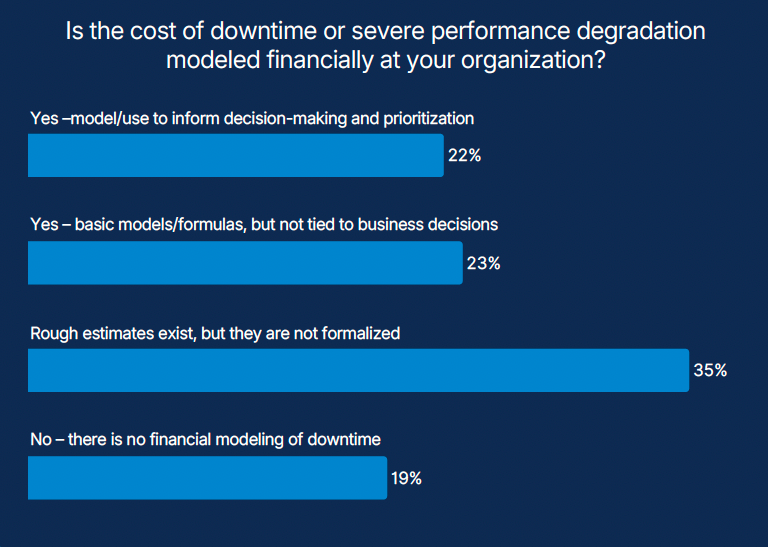
Without that context, reliability conversations stay trapped in the server room. Speed changes the framing. Delay is easier to understand than error rates. Time lost maps naturally to money lost, customers lost, trust lost. When teams can explain reliability in terms of cost, it becomes comparable, defensible, and visible at the business level.
As reliability expands beyond engineering, language becomes a constraint or an enabler. The report shows mixed comfort with technical terms like SLOs, and growing interest in more human alternatives that clearly describe intent and impact.
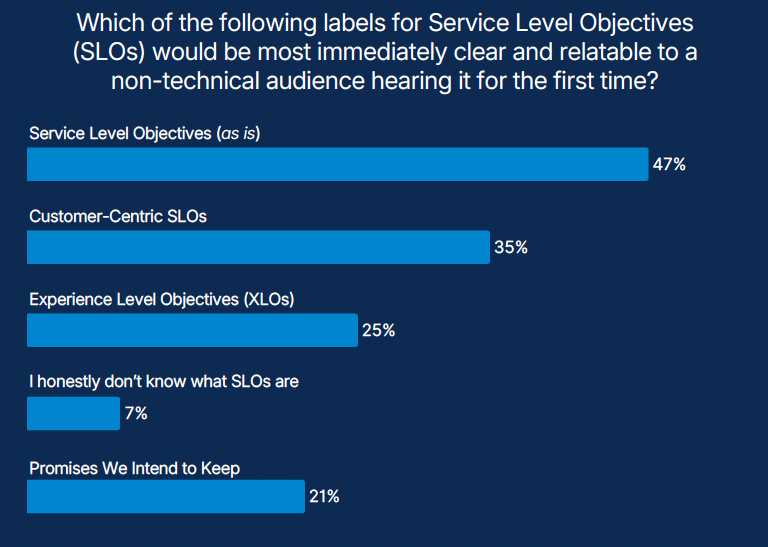
Reliability needs words that resonate outside of SRE teams. Speed does that naturally. Everyone understands fast. Everyone understands waiting. Few need a glossary to grasp why it matters.
If speed is how trust is experienced, then monitoring that stops at your own systems is no longer sufficient.
Your customers do not experience reliability inside your cloud, your regions, or your service boundaries. They experience it on real devices, across unpredictable networks, and through providers and services you do not own. Any monitoring model that ends before the user does will systematically underestimate failure.
That is the real risk exposed by the data.
Traditional monitoring answers the question “is something broken?” Experience-led monitoring answers a harder one: “who was affected, where, and what did it cost us?”
Until those answers live in the same view, reliability will continue to compete poorly for attention and funding. Engineers may know something is wrong, but leaders cannot see why it matters now.
Closing that gap requires monitoring to do three things differently:
Organizations in the belief-plus-behavior group show this pattern clearly. Their dashboards pair technical signals with business indicators. Post-incident reviews include discussion of customer impact and trust, not only time to recovery. Monitoring supports decision-making, not only troubleshooting.
When we examined the data by company size, one signal stood out clearly. Aligning reliability with business KPIs and customer experience ranks as a top priority at every scale.
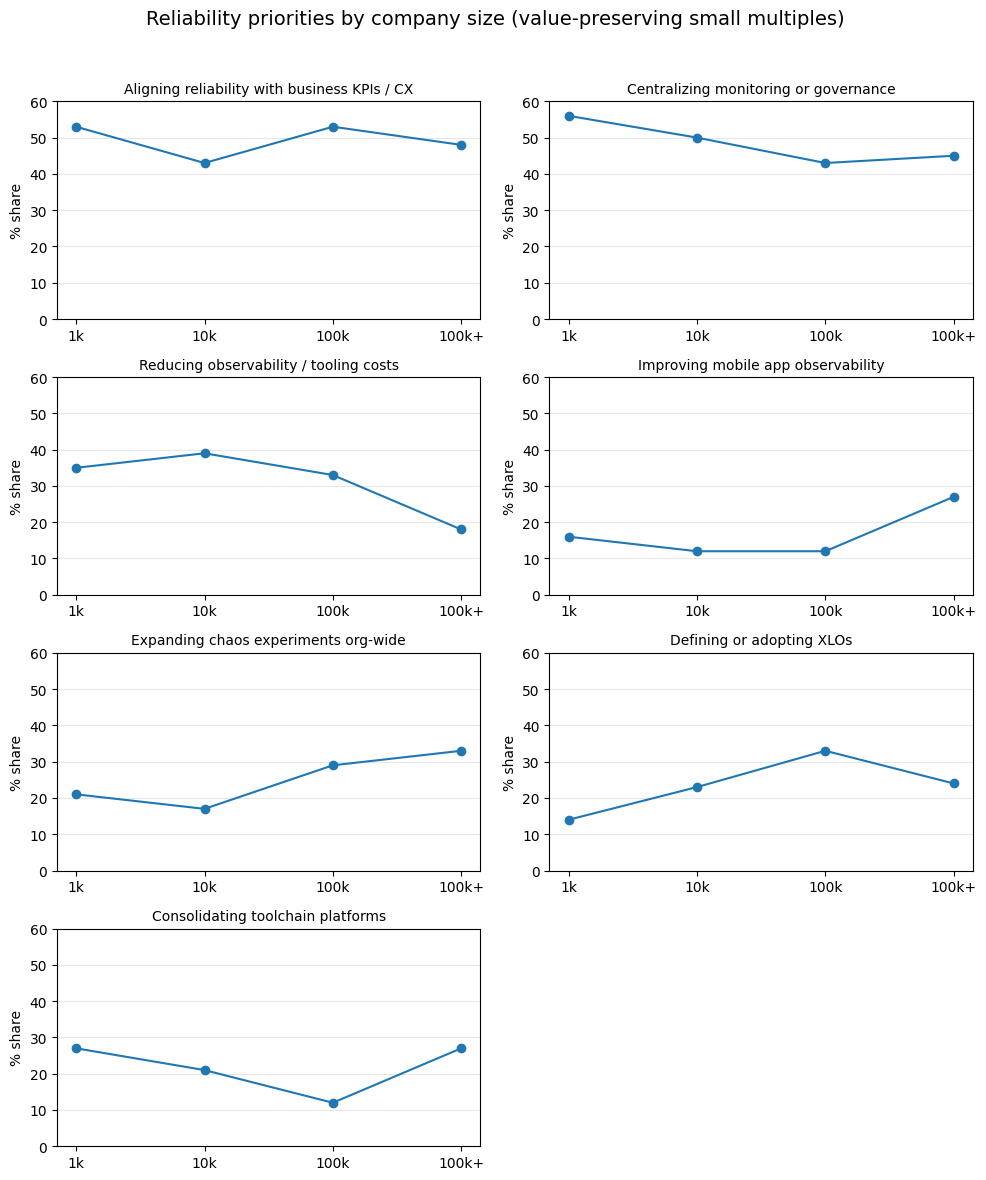
Where size changes the picture is in how alignment is enforced. Larger organizations show greater urgency around formal mechanisms such as XLOs, which offer a way to define what fast enough means for the journeys that matter most. They convert expectation into measurement and measurement into accountability. As organizations grow, this structure becomes necessary to preserve trust across expanding customer bases and increasingly complex systems.
If degraded performance is as damaging as downtime, then monitoring must be treated as the system of record for trust.
It must tell you, continuously and credibly:
Reliability viewed only through internal signals will always look healthier than it feels to customers. Reliability tied to business outcomes gains the visibility required for sustained investment.
Reliability used to mean “are we up?” Today, customers ask something more demanding: “Are you fast, everywhere, every time?”
The SRE Report 2026 shows that this change is no longer emerging. It is already established.
Across two years of data, one message holds steady: slow apps are dead apps. In last year’s report, a majority of organizations (53%) agreed with the phrase “slow is the new down,” even though many had never heard it before. In the 2026 report, 67% of respondents agreed that performance degradation is as serious as downtime. That belief has settled.
Reliability is no longer measured only by uptime. It is measured by how fast, how steady, and how confidently digital experiences work in every location where users connect. When a login hangs or a checkout page drags, customers do not care whether the cause is an outage or a delay. The result feels the same and trust drops either way.
This year’s data pushes further by testing whether belief translates into action. The report combined two questions to form a quadrant view.
The result exposes four patterns:
The quadrant reveals a pattern where most respondents now agree, in principle, that degraded performance is a reliability failure, yet fewer than half have built the feedback loops to prove what that failure costs in terms the business cares about.
The fact that most teams have mature dashboards and synthetic tests tells its own story.
When performance data stays technical, with dashboards, alerts, and latency charts, it struggles to compete with business priorities. But when reliability is tied to outcomes customers and executives care about, it stops being an operational cost and starts becoming a strategic lever.
Teams that connect performance to outcomes see different results. Reliability work gains visibility. Prioritization becomes easier. Long-term trust becomes easier to defend.
Another signal reinforces this point. Fewer than one in four organizations formally model the financial cost of slowness or downtime.
Without that context, reliability conversations stay trapped in the server room. Speed changes the framing. Delay is easier to understand than error rates. Time lost maps naturally to money lost, customers lost, trust lost. When teams can explain reliability in terms of cost, it becomes comparable, defensible, and visible at the business level.
As reliability expands beyond engineering, language becomes a constraint or an enabler. The report shows mixed comfort with technical terms like SLOs, and growing interest in more human alternatives that clearly describe intent and impact.
Reliability needs words that resonate outside of SRE teams. Speed does that naturally. Everyone understands fast. Everyone understands waiting. Few need a glossary to grasp why it matters.
If speed is how trust is experienced, then monitoring that stops at your own systems is no longer sufficient.
Your customers do not experience reliability inside your cloud, your regions, or your service boundaries. They experience it on real devices, across unpredictable networks, and through providers and services you do not own. Any monitoring model that ends before the user does will systematically underestimate failure.
That is the real risk exposed by the data.
Traditional monitoring answers the question “is something broken?” Experience-led monitoring answers a harder one: “who was affected, where, and what did it cost us?”
Until those answers live in the same view, reliability will continue to compete poorly for attention and funding. Engineers may know something is wrong, but leaders cannot see why it matters now.
Closing that gap requires monitoring to do three things differently:
Organizations in the belief-plus-behavior group show this pattern clearly. Their dashboards pair technical signals with business indicators. Post-incident reviews include discussion of customer impact and trust, not only time to recovery. Monitoring supports decision-making, not only troubleshooting.
When we examined the data by company size, one signal stood out clearly. Aligning reliability with business KPIs and customer experience ranks as a top priority at every scale.
Where size changes the picture is in how alignment is enforced. Larger organizations show greater urgency around formal mechanisms such as XLOs, which offer a way to define what fast enough means for the journeys that matter most. They convert expectation into measurement and measurement into accountability. As organizations grow, this structure becomes necessary to preserve trust across expanding customer bases and increasingly complex systems.
If degraded performance is as damaging as downtime, then monitoring must be treated as the system of record for trust.
It must tell you, continuously and credibly:
Reliability viewed only through internal signals will always look healthier than it feels to customers. Reliability tied to business outcomes gains the visibility required for sustained investment.
This is some text inside of a div block.
此内容由惯性聚合(RSS阅读器)自动聚合整理,仅供阅读参考。 原文来自 — 版权归原作者所有。