







In this article, we compare GTmetrix to Google’s Lighthouse run on Chrome DevTools.
Overview
Besides PageSpeed Insights, Lighthouse can be run directly within the Chrome browser using DevTools.
Note that this tool is chiefly designed for quick spot checks, and not for frequent tracking and integration into your team’s day-to-day workflow.
We’ve covered the differences between GTmetrix and PageSpeed Insights in another post.
In this post, we compare GTmetrix to Lighthouse (DevTools).
Here’s a step-by-step guide on how to use this tool:
1) On your local machine, visit your page on a Chrome browser and open DevTools
We’d suggest opening your page in Incognito mode (Ctrl + Shift + N on Windows / Command + Shift + N on Mac) for a better understanding of how a first time visitor would experience your page.
You can quickly open DevTools using the keyboard shortcut Ctrl + Shift + I (Command + Shift + I on Mac).
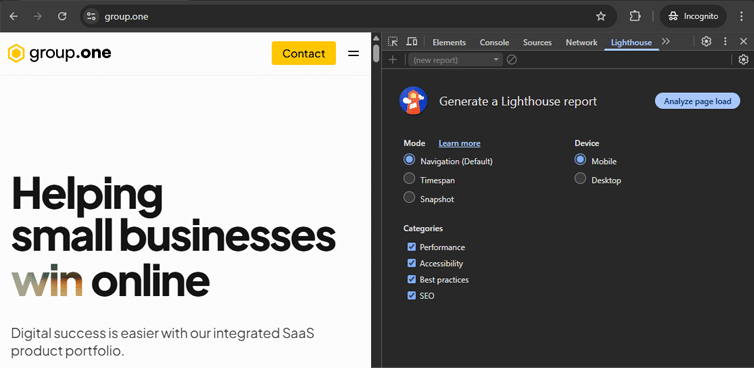
Visit your page on a Chrome Incognito browser, and open DevTools.
Incognito page loads can also help negate any interference from browser extensions or other resources (e.g., IndexedDB storage, local storage, etc.) if preferred.
2) Navigate to the Lighthouse tab
You’ll see 3 analysis modes displayed:
- Navigation (Default): Analyzes a single page load, similar to other tools.
- Timespan: Analyzes an arbitrary period of time to include user interactions, layout shifts, JavaScript execution.
- Snapshot: Analyzes the page in a particular state.
Learn more about the analysis modes here.
For standard page loads, leave it in the default Navigation mode.
3) Select device and click on Analyze page load
DevTools will now load your page again, analyze it using Lighthouse and provide the results.
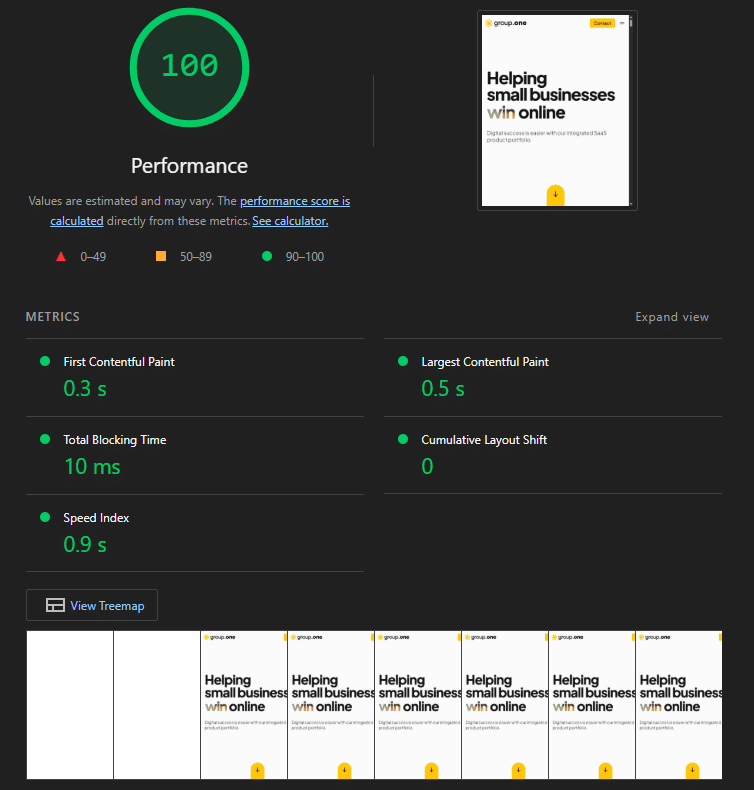
Lighthouse (DevTools) Report.
Here’s how GTmetrix compares to Lighthouse (DevTools):
 Loads page with real browser (Chrome) Desktop view – 1366×768 (default) Uses Lighthouse with custom audits Lab and field data both available Unthrottled Connection (default) Applies Analysis Options (if selected) Seattle, USA (default test location) Uses consistent hardware across all locations Does not use Lantern Results based on Observed performance |
 Uses your real, local Chrome browser Mobile – 412×823 / Desktop – user’s viewport Uses Lighthouse with “insights” Only Lab data available Throttled mobile / Unthrottled desktop results Cannot change Analysis Options Uses user’s location Results specific to user’s local environment Uses Lantern Results based on Simulated performance |
- Very easy to use: Directly built into Chrome and quickly analyses your page without having to visit a new URL.
- Provides both mobile and desktop analysis: Produces a report similar to PSI.
- Provides 3 different analysis modes: Navigation (default), Timespan, and Snapshot, giving you more insights on how your page behaves.
Note: Lighthouse on DevTools also provides “Insights” and not audits, similar to PSI.
- Results are not very representative of your audience: Great for local testing only as results represent your specific device and network conditions, and not a wide set of users.
- Cannot customize test conditions: Consequently, you do not have any control over the testing environment and cannot change any of the test parameters.
- Spot checks only: You can run multiple tests and view separate reports, but there is no historical tracking or centralized dashboard to view and compare results.
Conclusion
Think of Lighthouse (DevTools) as a quick health check from a walk-in clinic while GTmetrix is your family doctor.
Lighthouse (DevTools) is a free, easy-to-use tool that gives you a speedy insight into how your page is performing. However, the tool offers very limited testing and is not designed to continuously keep track of your webpages.
GTmetrix can be your full performance dashboard that can be used for both quick spot-checks and continuous tracking of your webpage’s performance.
With GTmetrix Reports, you can dive deeper and uncover real-time insights while monitoring and alerts help you catch issues before they affect your visitors.
Get started with a Free GTmetrix account now and give us a try!
Keep an eye on your site with Monitoring and Alerts
Let GTmetrix automatically test your page on your chosen frequency and alert you before performance drops affect your visitors.
Available in all PRO plans.
Other features include: More Test Locations, More Monitored Slots (select plans), Remote Location Monitoring, Priority access for tests, Bulk testing, Advanced Analysis Options, and more!