
惯性聚合 高效追踪和阅读你感兴趣的博客、新闻、科技资讯
阅读原文 在惯性聚合中打开

推荐订阅源

Threat Intelligence Blog | Flashpoint
Microsoft Azure Blog
Cloudbric
Cloudbric
I
InfoQ
V
V2EX
博客园_首页
The Register - Security
cs.CV updates on arXiv.org
S
Secure Thoughts
Vercel News
Vercel News
Forbes - Security
Forbes - Security
云风的 BLOG
云风的 BLOG
PCI Perspectives
PCI Perspectives
L
LINUX DO - 最新话题
D
DataBreaches.Net
H
Hacker News: Front Page
Application and Cybersecurity Blog
B
Blog RSS Feed
A
About on SuperTechFans
N
News and Events Feed by Topic
Apple Machine Learning Research
Help Net Security
Help Net Security
Attack and Defense Labs
N
Netflix TechBlog - Medium
Spread Privacy
Spread Privacy
F
Full Disclosure
Recorded Future
Recorded Future
AWS News Blog
AWS News Blog
博客园 - 【当耐特】
The Cloudflare Blog
T
Threatpost
T
Tor Project blog
Google DeepMind News
C
CXSECURITY Database RSS Feed - CXSecurity.com
CTFtime.org: upcoming CTF events
Recent Announcements
M
MIT News - Artificial intelligence
A
Arctic Wolf
C
Check Point Blog
Stack Overflow Blog
Stack Overflow Blog
T
Threat Research - Cisco Blogs
Security Archives - TechRepublic
Hacker News - Newest:
Hacker News - Newest: "LLM"
WordPress大学
WordPress大学
Cyberwarzone
Cyberwarzone
小众软件
小众软件
C
Cyber Attacks, Cyber Crime and Cyber Security
P
Proofpoint News Feed
Security Latest
Security Latest
The Last Watchdog
The Last Watchdog

Supabase Blog

AI Agents Know About Supabase. They Don't Always Use It Right. Custom OIDC Providers for Supabase Auth 100,000 GitHub stars Supabase docs over SSH Navigating Regional Network Blocks Supabase Joins the Stripe Projects Developer Preview Log Drains: Now available on Pro Supabase Storage: major performance, security, and reliability updates Supabase incident on February 12, 2026 Hydra joins Supabase X / Twitter OAuth 2.0 is now available for Supabase Auth BKND joins Supabase Supabase is now an official Claude connector Supabase PrivateLink is now available Introducing: Postgres Best Practices When to use Read Replicas vs. bigger compute Introducing TRAE SOLO integration with Supabase Supabase Security Retro: 2025 Sync Stripe Data to Your Supabase Database in One Click Building ChatGPT Apps with Supabase Edge Functions and mcp-use Own Your Observability: Supabase Metrics API Introducing iceberg-js: A JavaScript Client for Apache Iceberg Introducing Supabase for Platforms Adding Async Streaming to Postgres Foreign Data Wrappers Build "Sign in with Your App" using Supabase Auth Introducing Seven New Email Templates for Supabase Auth The new Supabase power for Kiro Introducing Supabase ETL Introducing Analytics Buckets Introducing Vector Buckets Snap, Inc. Launches Snap Cloud, Powered by Supabase Triplit joins Supabase Supabase Series E 1000 Y Combinator Founders Choose Supabase gm 👋 web3, welcome aboard to Sign in with Web3 (Solana, Ethereum) Announcing the Supabase Remote MCP Server Enterprise speed, enterprise standards with Bolt Cloud + Supabase PostgREST 13 Lovable Cloud + Supabase: The Default Platform for AI Builders Processing large jobs with Edge Functions, Cron, and Queues Defense in Depth for MCP Servers OrioleDB Patent: now freely available to the Postgres community Supabase Launch Week 15 Hackathon Winner Announcement The Vibe Coder's Guide to Supabase Environments Testing for Vibe Coders: From Zero to Production Confidence The Vibe Coding Master Checklist Vibe Coding: Best Practices for Prompting Supabase Auth: Build vs. Buy Top 10 Launches of Launch Week 15 Supabase Launch Week 15 Hackathon Storage: 10x Larger Uploads, 3x Cheaper Cached Egress, and 2x Egress Quota Persistent Storage and 97% Faster Cold Starts for Edge Functions Algolia Connector for Supabase New Observability Features in Supabase Improved Security Controls and A New Home for Security Introducing Branching 2.0 Stripe-To-Postgres Sync Engine as standalone Library Supabase Analytics Buckets with Iceberg Support Create a Supabase backend using Figma Make Introducing JWT Signing Keys Supabase UI: Platform Kit Build a Personalized AI Assistant with Postgres Announcing Multigres: Vitess for Postgres Building on open table formats Open Data Standards: Postgres, OTel, and Iceberg Simplifying back-end complexity with Supabase Data APIs PostgreSQL Event Triggers without superuser access Top 10 Launches of Launch Week 14 Supabase MCP Server Data API Routes to Nearest Read Replica Declarative Schemas for Simpler Database Management Realtime: Broadcast from Database Keeping Tabs on What's New in Supabase Studio Edge Functions: Deploy from the Dashboard + Deno 2.1 Automatic Embeddings in Postgres Introducing the Supabase UI Library Supabase Auth: Bring Your Own Clerk Postgres Language Server: Initial Release Migrating from Fauna to Supabase Migrating from the MongoDB Data API to Supabase Dedicated Poolers Postgres as a Graph Database: (Ab)using pgRouting AI Hackathon at Y Combinator Calendars in Postgres using Foreign Data Wrappers Supabase Launch Week 13 Hackathon Winners How to Hack the Base! Running Durable Workflows in Postgres using DBOS database.build v2: Bring-your-own-LLM Restore to a New Project Hack the Base! with Supabase Top 10 Launches of Launch Week 13 Supabase Queues High Performance Disk Supabase Cron Supabase CLI v2: Config as Code Supabase Edge Functions: Introducing Background Tasks, Ephemeral Storage, and WebSockets Supabase AI Assistant v2 OrioleDB Public Alpha Executing Dynamic JavaScript Code on Supabase with Edge Functions ClickHouse Partnership, improved Postgres Replication, and Disk Management
Supabase Reports and Metrics
Div Arora · 2021-07-29 · via Supabase Blog

Supabase Reports and Metrics

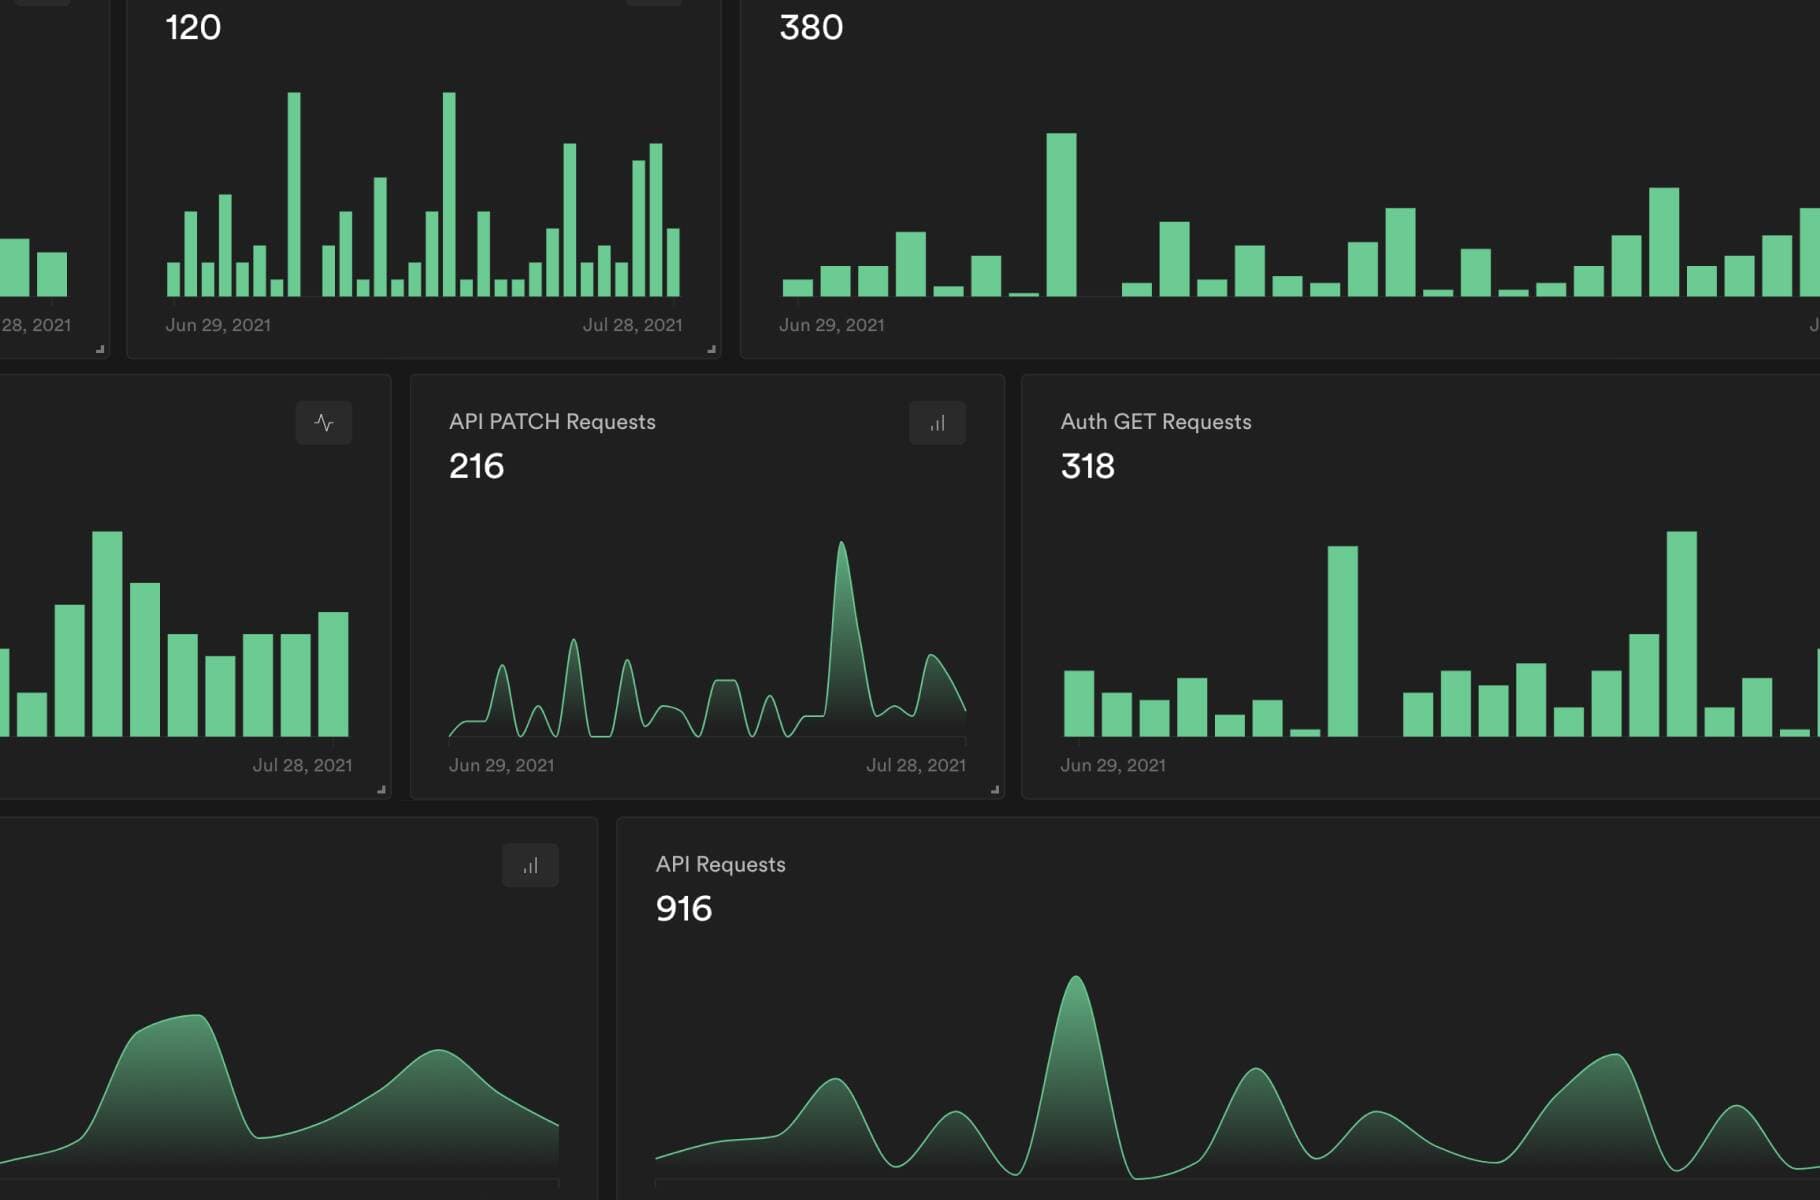
Supabase offers a supercharged Postgres instance, along with a set of complementary services, making it easy to build mobile and web applications. Today, we're exposing a full set of metrics in your projects, so that you can build better (and faster) products for your users.

Reports page#

We've added a new "Reports" section to the Dashboard. You can view one month of data, including API requests across all of Supabase's core pillars: Database, Auth and Storage. We've included two instance health metrics, CPU usage and Memory usage, with a lot more on the way.

All charts are built with Recharts, an MIT-licensed React chart library chosen for its ease of use. We'll add customizable charts in the future, so we'd love to hear which libraries you'd like to see in Supabase.

We support one configurable report per project, accessible and editable by all team members. In the next few weeks, we'll expand to unlimited reports, with longer date range options, new layout configurations, report templates, stacked charts and private/public visibility across your project's members.

New project home page#

Every project has a new home page with a weekly overview of important metrics. We've included usage bars for Database storage, number of Auth users, and Storage space.

And we're just getting warmed up. Over the next few months you'll see more project information, notifications, and highlights to monitor your project health at a glance.

Backend as a Service? Infrastructure as a Service? We don't care about the label, but we do care about giving developers the relevant observability metrics. Supabase gives you a full Postgres cluster for every project, and now we give you the tools to diagnose and manage important infrastructure anomalies.

All databases are now launched with pg_stat_statements enabled, so you can expect some useful query statistics in the future too.

"If you can't measure it, you can't improve it."

Full control, full responsibility#

When developers build services and applications on top of Supabase, relying on the platform's reliability and performance. Product observability is critical, as it allows developers to make decisions on where to spend their optimization dollars, and to get ahead of possible issues before they become showstoppers.

At Supabase, each project is provisioned with a Postgres cluster, and a suite of associated services that add, ahem, supa-powers to the database.

Our users get liberal access to each of these services - you can use PostgREST for a RESTful API, Realtime to listen to changes in your Postgres instance, or even just open a raw connection to the database. While this makes for an extremely flexible offering, it presents a diverse cast of foot-guns. Want to mess with Realtime? Why not bulk-insert millions of records on tables you've configured it to watch? Feel like taking out your entire database? Just connect to it and run a wildly inefficient query!

We're continuously rolling out protections to mitigate failure scenarios and to minimize the blast radius. However, given the power and flexibility exposed via our services and the diverse workloads they support, our users remain best positioned to make the call on what's reasonable for their project. As such, we're also working on exposing as much data as possible to them.

Gathering relevant metrics#

Given the setup described above, there are two major categories of metrics that we care about. There are metrics pertinent to the services mentioned ("Project Metrics") that get spun up for each project (e.g. the number of active connections to the db), and there are metrics for the underlying infrastructure (e.g. system health). Most of the time, our users shouldn't have to care about the latter, though the nature of leaky abstractions dictates that sometimes they become relevant to Project Metrics as well.

In order to build a comprehensive view of the project's health, each service needs to be instrumented along with its underlying infrastructure. We're looking at hundreds of thousands of targets at our current scale (likely approaching millions in the near future) each of them presenting hundreds of metrics of interest (every minute!).

To buy ourselves some headroom, we built a federated approach: we run instances of our monitoring systems in each geographical region we operate in. This provides a natural dimension for sharding, while reducing the latency for everyone. We run Prometheus out of inertia, soon to be VictoriaMetrics. The monitoring instances scrape data from a number of exporters that are bundled into each of our projects. A small subset of the metrics collected gets aggregated to a centralized VictoriaMetrics instance for easier cohort analysis.

Available sources and metrics#

To start with, we're focusing on metrics a few of the most pertinent metrics:

  • Database metrics: CPU and RAM usage
  • API Requests: Ingress, Egress, GET, POST, PATCH, PUT, OPTIONS, and all requests.
  • Storage Requests: Ingress, Egress, GET, POST, PATCH, PUT, OPTIONS, and all requests.
  • Auth Requests: Ingress, Egress, GET, POST, PATCH, PUT, OPTIONS, and all requests.

Where to begin?

  • Multiple reports per project: we've started with just one report per project, but in the next few weeks we'll allow you to create as many as you want.
  • More metrics: we're just getting started.
    • Number of active connections to your database.
    • Various detailed stats from pg_stat_statements, pg_stat_bgwriter, pg_stat_database, pg_stat_database_conflicts.
    • System level metrics like CPU, memory and disk utilization.
  • Granularity: project statistics will come down to hourly.
  • Longer time periods: view historical data going back several months.
  • Interactive widgets: view-only reports are fine, but we wouldn't be a Postgres company if we didn't allow you to write your own SQL queries.

Any other metrics you want to see in your projects? Reach out on our Discord channel and give Supabase a try by creating a project.