








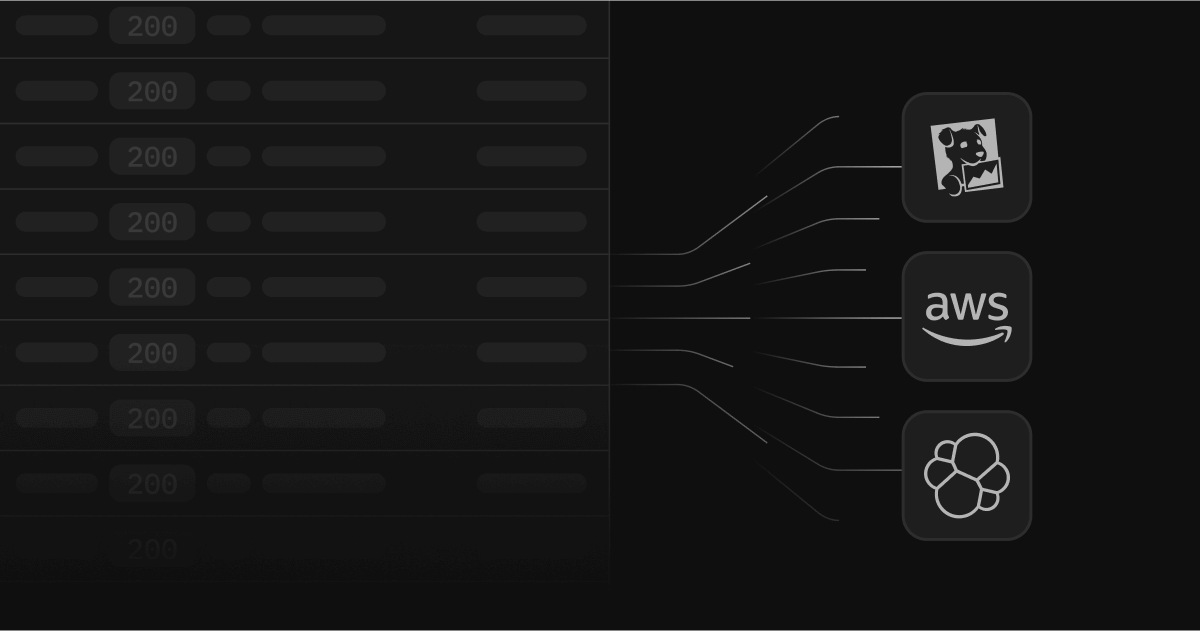
Today, Supabase is releasing Log Drains for all Team and Enterprise users.
With Log Drains, developers can export logs generated by their Supabase products to external destinations, such as Datadog or custom HTTP endpoints. All logs generated by Supabase products such as the Database, Storage, Realtime and Auth are supported.
Beyond providing a single pane of glass inside your existing logging and monitoring system, Log Drains can be used to build additional alerting and observability pipelines. For example, you can ingest Postgres connection logs into your Security Information and Event Management (SIEM) or Intrusion Detection System (IDS) to create custom alerting rules based on events happening in your database.
This feature also allows for extended retention periods to meet compliance requirements and provide an important escape hatch for advanced use cases while we continue to improve logging and alerting within the Supabase platform
Log drains can be set up in the project settings.
The initial supported destinations are:
- Datadog Logs
- HTTP Endpoint
Popular destinations like Datadog are supported out of the box. More detailed setup guides are available within the log drains documentation.
For the providers that are not natively supported yet, the HTTP Endpoint drain can be used to send logs to any destination that supports ingestion via HTTP POST requests. For example, you can send logs to an Edge Function, filter, or restructure the logs, and then dispatch them to an external provider. In the following example, we perform a simple console.log of the received JSON payload. Detailed setup guide is available under the Edge Functions guide.
Log Drains are available for self-hosting and local development through the Studio under Project Settings > Log Drains.
Log Drains are built into Logflare, the analytics and observability server of the Supabase stack.
The architecture of analytics server had to be rewritten to allow for efficient and scalable log dispatching to multiple destinations. This architecture revamp is part of a multi-year effort to allow multiple backends to be used with the server, as the initial architecture was heavily tied to Google BigQuery. This was first seen through our initial release of Supabase Logs Self-Hosted which utilizes a PostgreSQL backend out-of-the-box for self-hosted and CLI setups. User can optionally switch between a PostgreSQL backend and a BigQuery backend depending on their needs.
Development work for the architecture change had first started in mid 2022, and PostgreSQL was our very first backend added to this architecture. The new multi-backend architecture, dubbed internally as the V2 pipeline, has undergone extensive benchmarking and profiling to ensure that changes brought about by the V2 pipeline only improve and enhance the performance and stability of the server.
One of the Logflare features that Log Drains extends is the ingest-time rules. Prior to the Log Drains implementation, these rules applied to specific sources and allowed for routing of events from one source to another source. In Logflare terms, a source acts as an abstracted queryable table. These rules then specified filters on whether the event would be inserted into the target source. Extending upon this with the multi-backends architecture, Log Drains now uses these rules to route events from each product's source to a user-configured drain destination, which is modeled as a backend.
With these changes, Logflare is able to provide soft-realtime dispatching of log events to user destinations as fast as they get inserted into the underlying backend used for storage due to the highly scalable concurrency brought about by the BEAM runtime. This means that on the Supabase Platform, any Log Drain configured will receive events as fast or even faster than they appear in the Logs UI.
Self-Hosting and Local Development#
In alignment with Supabase open-source philosophy, Log Drains will be fully available without restriction for local development and self-hosting. You can track the progress of the pull request that makes this happen for the latest updates.
Instructions for setting up and configuring the Analytics server can be found in the self-hosting docs. If you are interested in how we open-sourced Logflare, check out the blog post here.
Log Drains are available as an project Add-On for all Team and Enterprise users. Each Log Drain costs $60 per month per project, with a $0.20 per million log events processing fee and a $0.09 per GB egress fee as part of unified egress.
- We intend to support a wide variety of destinations. Syslog and Loki are currently under development and are expected to be released in the coming weeks. If you would like your favorite tools to be supported as a destination, vote on this GitHub discussion!
- Log sampling to control the volume of logs sent to the drain
- Draining specific product logs
- Sharing Log Drains between multiple projects