



惯性聚合 高效追踪和阅读你感兴趣的博客、新闻、科技资讯
阅读原文 在惯性聚合中打开

推荐订阅源

aimingoo的专栏
aimingoo的专栏
M
MIT News - Artificial intelligence
CTFtime.org: upcoming CTF events
F
Fortinet All Blogs
L
LangChain Blog
D
Docker
G
Google Developers Blog
B
Blog RSS Feed
Google DeepMind News
Vercel News
Vercel News
Recent Announcements
MyScale Blog
MyScale Blog
Microsoft Azure Blog
A
About on SuperTechFans
T
The Blog of Author Tim Ferriss
Recorded Future
Recorded Future
I
InfoQ
博客园 - 【当耐特】
The Cloudflare Blog
P
Proofpoint News Feed
GbyAI
GbyAI
博客园 - 司徒正美
U
Unit 42
OSCHINA 社区最新新闻
OSCHINA 社区最新新闻
IT之家
IT之家
H
Hackread – Cybersecurity News, Data Breaches, AI and More
B
Blog
Hugging Face - Blog
Hugging Face - Blog
博客园_首页
Stack Overflow Blog
Stack Overflow Blog
Microsoft Security Blog
爱范儿
爱范儿
Jina AI
Jina AI
量子位
阮一峰的网络日志
阮一峰的网络日志
月光博客
月光博客
有赞技术团队
有赞技术团队
罗磊的独立博客
博客园 - 三生石上(FineUI控件)
Y
Y Combinator Blog
Apple Machine Learning Research
V
V2EX
大猫的无限游戏
大猫的无限游戏
F
Full Disclosure
雷峰网
雷峰网
美团技术团队
酷 壳 – CoolShell
酷 壳 – CoolShell
freeCodeCamp Programming Tutorials: Python, JavaScript, Git & More
让小产品的独立变现更简单 - ezindie.com
S
SegmentFault 最新的问题

Supabase Blog

AI Agents Know About Supabase. They Don't Always Use It Right. Custom OIDC Providers for Supabase Auth 100,000 GitHub stars Supabase docs over SSH Navigating Regional Network Blocks Supabase Joins the Stripe Projects Developer Preview Log Drains: Now available on Pro Supabase Storage: major performance, security, and reliability updates Supabase incident on February 12, 2026 Hydra joins Supabase X / Twitter OAuth 2.0 is now available for Supabase Auth BKND joins Supabase Supabase is now an official Claude connector Supabase PrivateLink is now available Introducing: Postgres Best Practices When to use Read Replicas vs. bigger compute Introducing TRAE SOLO integration with Supabase Supabase Security Retro: 2025 Sync Stripe Data to Your Supabase Database in One Click Building ChatGPT Apps with Supabase Edge Functions and mcp-use Own Your Observability: Supabase Metrics API Introducing iceberg-js: A JavaScript Client for Apache Iceberg Introducing Supabase for Platforms Adding Async Streaming to Postgres Foreign Data Wrappers Build "Sign in with Your App" using Supabase Auth Introducing Seven New Email Templates for Supabase Auth The new Supabase power for Kiro Introducing Supabase ETL Introducing Analytics Buckets Introducing Vector Buckets Snap, Inc. Launches Snap Cloud, Powered by Supabase Triplit joins Supabase Supabase Series E 1000 Y Combinator Founders Choose Supabase gm 👋 web3, welcome aboard to Sign in with Web3 (Solana, Ethereum) Announcing the Supabase Remote MCP Server Enterprise speed, enterprise standards with Bolt Cloud + Supabase PostgREST 13 Lovable Cloud + Supabase: The Default Platform for AI Builders Processing large jobs with Edge Functions, Cron, and Queues Defense in Depth for MCP Servers OrioleDB Patent: now freely available to the Postgres community Supabase Launch Week 15 Hackathon Winner Announcement The Vibe Coder's Guide to Supabase Environments Testing for Vibe Coders: From Zero to Production Confidence The Vibe Coding Master Checklist Vibe Coding: Best Practices for Prompting Supabase Auth: Build vs. Buy Top 10 Launches of Launch Week 15 Supabase Launch Week 15 Hackathon Storage: 10x Larger Uploads, 3x Cheaper Cached Egress, and 2x Egress Quota Persistent Storage and 97% Faster Cold Starts for Edge Functions Algolia Connector for Supabase Improved Security Controls and A New Home for Security Introducing Branching 2.0 Stripe-To-Postgres Sync Engine as standalone Library Supabase Analytics Buckets with Iceberg Support Create a Supabase backend using Figma Make Introducing JWT Signing Keys Supabase UI: Platform Kit Build a Personalized AI Assistant with Postgres Announcing Multigres: Vitess for Postgres Building on open table formats Open Data Standards: Postgres, OTel, and Iceberg Simplifying back-end complexity with Supabase Data APIs PostgreSQL Event Triggers without superuser access Top 10 Launches of Launch Week 14 Supabase MCP Server Data API Routes to Nearest Read Replica Declarative Schemas for Simpler Database Management Realtime: Broadcast from Database Keeping Tabs on What's New in Supabase Studio Edge Functions: Deploy from the Dashboard + Deno 2.1 Automatic Embeddings in Postgres Introducing the Supabase UI Library Supabase Auth: Bring Your Own Clerk Postgres Language Server: Initial Release Migrating from Fauna to Supabase Migrating from the MongoDB Data API to Supabase Dedicated Poolers Postgres as a Graph Database: (Ab)using pgRouting AI Hackathon at Y Combinator Calendars in Postgres using Foreign Data Wrappers Supabase Launch Week 13 Hackathon Winners How to Hack the Base! Running Durable Workflows in Postgres using DBOS database.build v2: Bring-your-own-LLM Restore to a New Project Hack the Base! with Supabase Top 10 Launches of Launch Week 13 Supabase Queues High Performance Disk Supabase Cron Supabase CLI v2: Config as Code Supabase Edge Functions: Introducing Background Tasks, Ephemeral Storage, and WebSockets Supabase AI Assistant v2 OrioleDB Public Alpha Executing Dynamic JavaScript Code on Supabase with Edge Functions ClickHouse Partnership, improved Postgres Replication, and Disk Management Live Share: Connect to in-browser PGlite with any Postgres client
New Observability Features in Supabase
Jonny Summers-Muir, Saxon Fletcher, Jordi Enric, Francesco Sansa · 2025-07-17 · via Supabase Blog

New Observability Features in Supabase

We are starting to add OpenTelemetry support to all our core products and our Telemetry server. OpenTelemetry (OTel) standardizes logs, metrics, and traces in a vendor-agnostic format, so you can ingest data into tools like Datadog, Honeycomb, or any monitoring solution you already use. While you'll still have the freedom to bring your own observability stack, we're preparing to surface this data natively in the Supabase dashboard.

Today, we are announcing:

  • New Logging Interface (coming soon!)
  • Advanced Product Reports
  • Supabase AI Assistant with debugging capabilities (coming soon!)

These updates mark the first step toward unified, end-to-end observability. You won't get the full OTel visualization just yet, but with these foundations in place, you'll soon be able to trace, analyze errors and performance issues, and troubleshoot your entire stack without leaving Supabase.

Supabase is a collection of seamlessly integrated services. Storage talks to Postgres via the dedicated connection pooler. Edge Functions can talk to Auth and Realtime. If Storage uploads fail, you must determine whether the problem lies with the Storage server, the dedicated connection pooler, or the database. Previously, pinpointing the root cause meant jumping between multiple log streams.

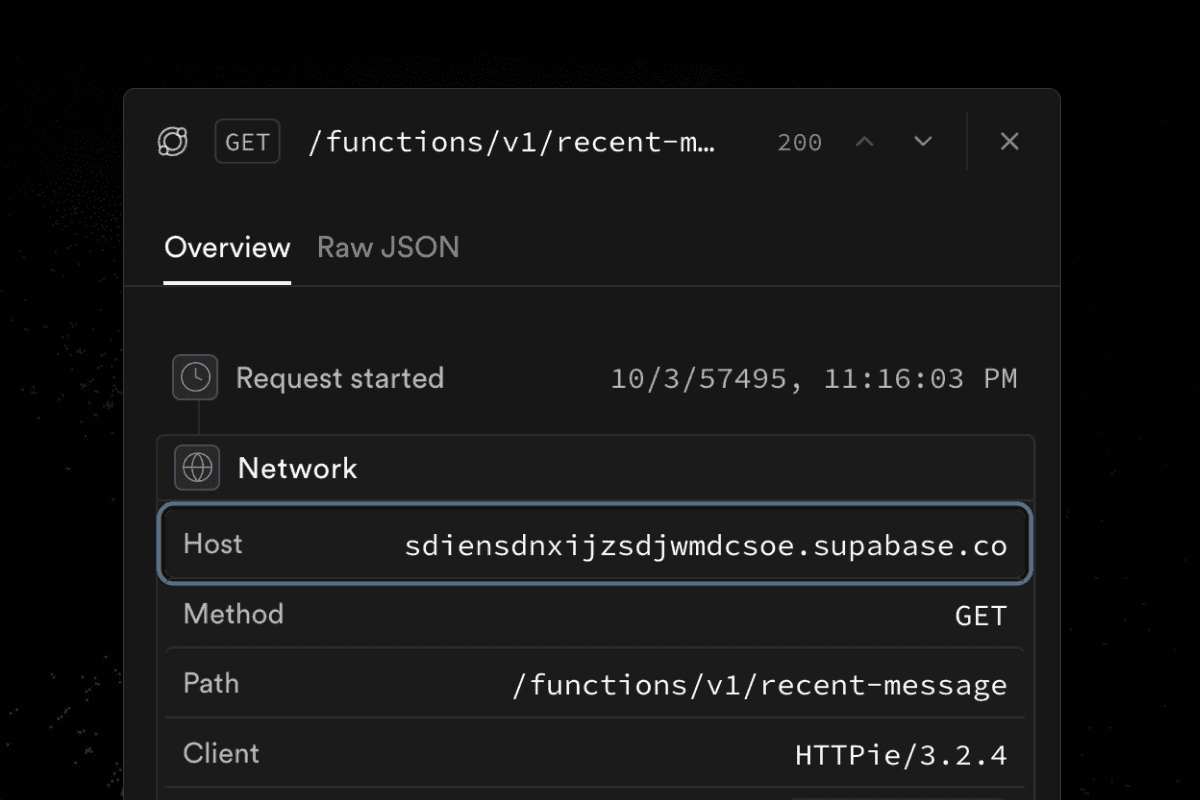
Now, there is one interleaved stream of logs across all services. You can trace a single request across the entire Supabase stack. No more jumping between tabs to diagnose errors.

We have also added contextual log views. You can now jump from a function's invocation log directly into its execution logs. What used to require two disconnected sources is now stitched together in one view.

The new interface also supports filtering logs by the request status code, method, path, log level and the auth user associated with the request. This means you can quickly find all Postgrest 500 errors, or all requests made by a specific user with a few clicks.

The new interface currently supports API Gateway logs and Postgres logs, with logs for the other products coming soon.

Shoutout to openstatus.dev for providing the inspiration for some of our Log components.

Apart from making our logs better, we also revamped the metrics exposed in our product reports. Previously, you had to host your own Grafana dashboard to access some of these advanced metrics. We are bringing some of these metrics directly into the dashboard, so that you can access them without any additional setup or maintaining your own production ready monitoring infrastructure.

Each product has its own dedicated report with a common set of metrics like number of requests, egress, and response time, along with product specific metrics like “Realtime connected clients”.

Additionally, you can drill into a specific time frame and filter by various request and response parameters across all reports.

Free users get a basic set of metrics for all products, while some of the advanced metrics (like p99 response time) is available for all paid customers.

Try out the new reports here.

The Supabase AI Assistant now offers powerful new debugging capabilities, making it easier to identify and resolve issues across your stack.

You can now ask the Assistant to:

  • Retrieve logs for any Supabase product
  • Analyze log volume over time to identify spikes
  • Drill into specific time windows to investigate anomalies

This means you can go from "something looks off" to concrete answers, without leaving the chat.

The Assistant also comes with several quality-of-life upgrades:

  • Automatic chat renaming based on your queries
  • Branch diff reviews, perfect for projects using branching environments
  • A more capable model with additional controls for data privacy and security improvements built in

It's the fastest way to get answers for your project, whether you're debugging a failing function, reviewing changes between branches, or just trying to understand how your app is behaving in production.

This is an example of how the Assistant can analyze logs to identify issues:

It can also provide recommendations for fixes:

  • We'll keep adding more metrics across our reports
  • We're adding logs from the remaining products to new logging interface
  • We plan to make the new logging interface the default experience for all projects soon
  • Expose OpenTelemetry trace information in the logging interface