惯性聚合 高效追踪和阅读你感兴趣的博客、新闻、科技资讯
阅读原文 在惯性聚合中打开

推荐订阅源

博客园 - 叶小钗
Last Week in AI
Last Week in AI
OSCHINA 社区最新新闻
OSCHINA 社区最新新闻
雷峰网
雷峰网
GbyAI
GbyAI
Hugging Face - Blog
Hugging Face - Blog
N
Netflix TechBlog - Medium
博客园 - 聂微东
Y
Y Combinator Blog
罗磊的独立博客
博客园_首页
小众软件
小众软件
有赞技术团队
有赞技术团队
爱范儿
爱范儿
F
Fortinet All Blogs
C
Check Point Blog
Google DeepMind News
云风的 BLOG
云风的 BLOG
Apple Machine Learning Research
M
MIT News - Artificial intelligence
月光博客
月光博客
钛媒体:引领未来商业与生活新知
钛媒体:引领未来商业与生活新知
博客园 - 司徒正美
aimingoo的专栏
aimingoo的专栏

The latest policy updates for developers - The GitHub Blog

Q1 2026 Innovation Graph update: Open source collaboration is accelerating worldwide GitHub joins coalition advocating for fixes to California AI Transparency Act to protect open source Why age assurance laws matter for developers How researchers are using GitHub Innovation Graph data to reveal the “digital complexity” of nations Developer policy update: Intermediary liability, copyright, and transparency Year recap and future goals for the GitHub Innovation Graph Help shape the future of open source in Europe The future of AI-powered software optimization (and how it can help your team) Developers still need the right to challenge junk patents How GitHub protects developers from copyright enforcement overreach We need a European Sovereign Tech Fund
Q1 2025 Innovation Graph update: Bar chart races, data vi...
Kevin Xu · 2025-08-15 · via The latest policy updates for developers - The GitHub Blog

We launched the GitHub Innovation Graph to give developers, researchers, and policymakers an easy way to explore and analyze global trends in open source software development. It offers a reliable, transparent dataset that tracks public collaboration activity across regions over time.

Our latest quarterly update now includes data through March 2025, which means the Innovation Graph spans more than five years of insights into the global software economy.

Data visualization and AI continue to gain momentum, and more broadly, the Innovation Graph is becoming an increasingly valuable resource for anyone looking to ground their work in trusted, real-world developer data.

Let’s jump in.

Bar chart race videos now available on global metrics pages

We’ve added bar chart race videos to the git pushes, repositories, developers, and organizations global metrics pages.

data-visualization enters the topics leader board

In Q1 2025, data-visualization finally appeared as one of the top 50 topics by the number of unique pushers:

Screenshot of a chart that shows that the “data-visualization” repository topic is at rank 50 in Q1 2025. This is the first and only time it appears on the chart.

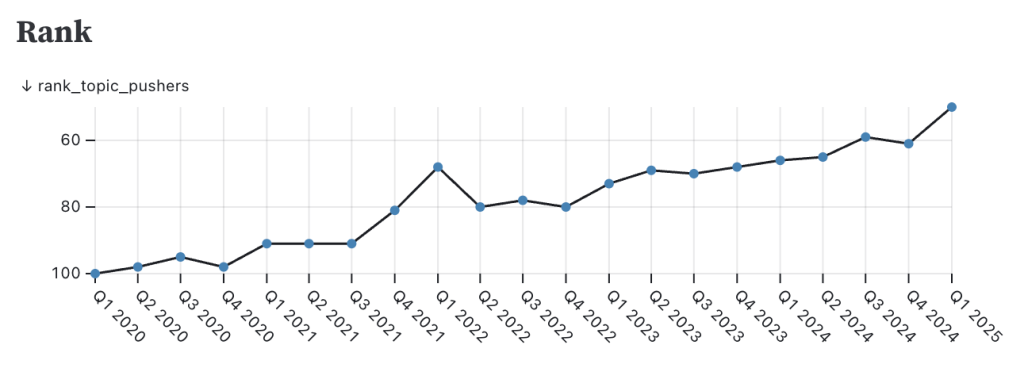
Starting from way down in rank 100 in Q1 2020, it’s been an arduous journey:

A line chart that shows the rank of the “data-visualization” repository topic over time. Its rank rose steadily from rank 100 in Q1 2020 to rank 50 in Q1 2025, with a temporary spike to approximately rank 70 in Q1 2022.

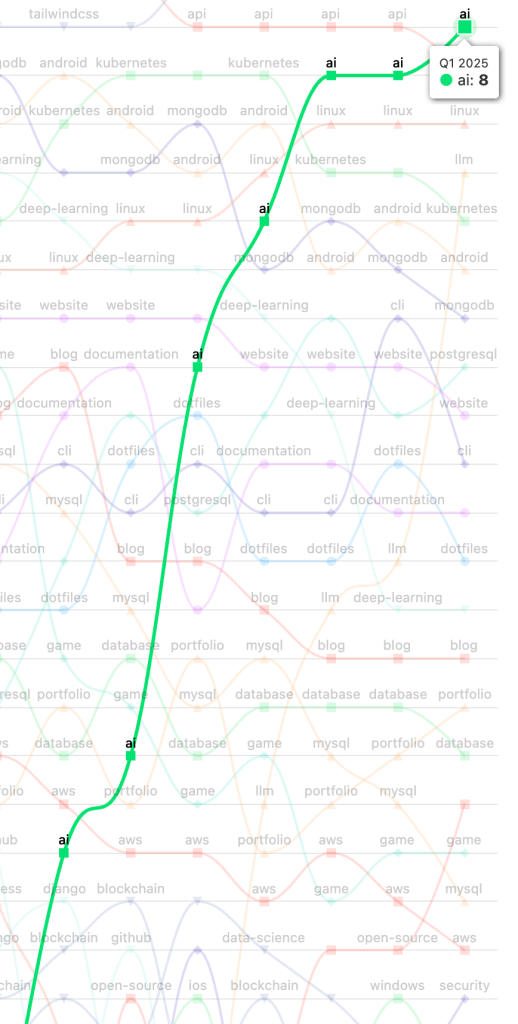
Not every repository topic has the kind of trajectory as ai:

A bump chart that shows the rapid rise of the “ai” repository topic over time, starting at rank 25 in Q3 2023 to rank 8 in Q1 2025.

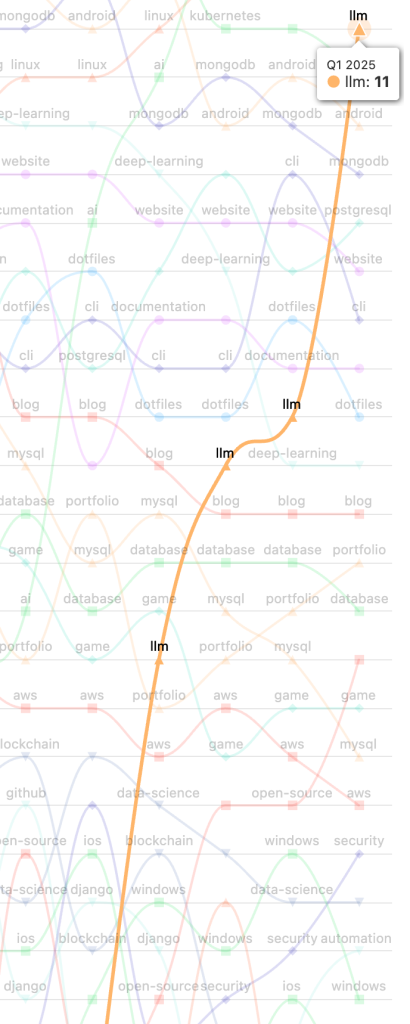
Or llm:

A bump chart that shows the rapid rise of the “llm” repository topic over time, starting at rank 24 in Q2 2024 to rank 11 in Q1 2025.

Research roundup

Finally, we’d like to highlight some of the recent research reports and papers that caught our interest — and that utilize GitHub and Innovation Graph data:

The 2025 AI Index Report

Published by the Stanford Institute for Human-Centered AI (HAI), the AI Index Report tracks and monitors trends in AI development and diffusion, synthesizing insights relevant to businesses, policymakers, researchers, and the general public. Check out Section 1.6 of the report for their analysis of public AI-related software projects on GitHub over time, showing a sharp increase in 2024.

  • Nestor Maslej, Loredana Fattorini, Raymond Perrault, Yolanda Gil, Vanessa Parli, Njenga Kariuki, Emily Capstick, Anka Reuel, Erik Brynjolfsson, John Etchemendy, Katrina Ligett, Terah Lyons, James Manyika, Juan Carlos Niebles, Yoav Shoham, Russell Wald, Tobi Walsh, Armin Hamrah, Lapo Santarlasci, Julia Betts Lotufo, Alexandra Rome, Andrew Shi, Sukrut Oak. “The AI Index 2025 Annual Report,” AI Index Steering Committee, Institute for Human-Centered AI, Stanford University, Stanford, CA, April 2025.

Corporate Accelerators and Global Entrepreneurial Growth

Researchers found that participating in a corporate accelerator program increased startups’ future funding by more than 40%. Innovation Graph data was used as a measure of regional technical labor capacity.

The building blocks of software work explain coding careers and language popularity

Researchers analyzed StackOverflow to develop a large-scale, fine-grained taxonomy of software development tasks. They found that in particular, Python developers are more likely to pursue tasks associated with higher wages, possibly because Python’s versatility enables them to more readily pick up skills in disparate and unfamiliar areas. Innovation Graph data provided a way to assess the representativeness of the distribution of programming languages used by StackOverflow users.

  • Feng, X., Wachs, J., Daniotti, S. and Neffke, F., 2025. The building blocks of software work explain coding careers and language popularity. arXiv preprint arXiv:2504.03581.

Who is using AI to code? Global diffusion and impact of generative AI

Researchers trained a classifier to detect AI-generated Python functions, finding that AI generated 30% of Python functions committed on GitHub by US developers. This resulted in a 2.4% increase in total quarterly commit volume, which generates an estimated $9.6-14.4 billion in value annually.

  • Daniotti, Simone, Johannes Wachs, Xiangnan Feng, and Frank Neffke. “Who is using AI to code? Global diffusion and impact of generative AI.” arXiv preprint arXiv:2506.08945 (2025).

Societal Capacity Assessment Framework: Measuring Advanced AI Implications for Vulnerability, Resilience, and Transformation

Researchers developed an indicators-based approach to assessing societal resilience to advanced AI across three dimensions: structural factors that might predispose a society to AI risks (“vulnerability”); capacity to prevent, absorb, and recover from AI risks (“resilience”); and capacity to leverage AI systems to mitigate AI risks and reconfigure the society toward systemic safety (“transformation”). The Innovation Graph was cited in the prototype framework as a data source to use as a proxy to measure a society’s human capital in the domain of cyber security.

  • Milan M. Gandhi, Peter Cihon, Owen C. Larter, and Rebecca Anselmetti. 2025. Societal Capacity Assessment Framework: Measuring Advanced AI Implications for Vulnerability, Resilience, and Transformation. In ICML Workshop on Technical AI Governance (TAIG). Retrieved from https://openreview.net/forum?id=8gn9NeL0Ai.

Written by

Kevin Xu

Staff Software Engineer, CELA

Related posts

Explore more from GitHub

Docs

Docs

Everything you need to master GitHub, all in one place.

Go to Docs

GitHub

GitHub

Build what’s next on GitHub, the place for anyone from anywhere to build anything.

Start building

Customer stories

Customer stories

Meet the companies and engineering teams that build with GitHub.

Learn more

The GitHub Podcast

The GitHub Podcast

Catch up on the GitHub podcast, a show dedicated to the topics, trends, stories and culture in and around the open source developer community on GitHub.

Listen now