


by Alem Tuzlak on Apr 22, 2026.
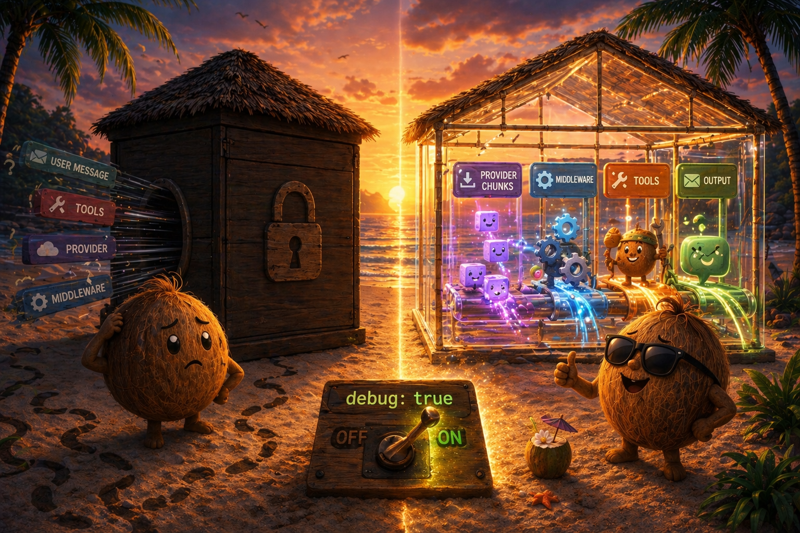
You kick off a chat() call. A chunk goes missing. A middleware you wrote last week doesn't seem to fire. A tool gets called with arguments you can't explain. Your stream finishes, the UI looks wrong, and you have no idea which layer lied to you.
Up until now your options were limited. You could wrap the SDK in a tracing platform, spend a day wiring OpenTelemetry, or sprinkle console.log into your own code and hope the problem lives where you can see it. Neither helps when the bug is inside the pipeline: a raw provider chunk that got dropped, a middleware that mutated config, a tool call the agent loop reissued.
TanStack AI now has a built-in answer. Flip one flag and the entire pipeline prints itself.
Add debug: true to any activity call:
Every internal event now prints to the console, prefixed with an emoji-tagged category so you can scan dense streaming logs without squinting:
That is the whole setup. No exporters, no sidecar, no dashboard. Just what your pipeline is actually doing, right now, in the terminal you already have open.
Most logging libraries give you debug, info, warn, error and ask you to pick one. That mapping is wrong for an AI pipeline. The noise isn't a severity, it's a source. When you're chasing a tool bug you don't want provider chunks. When you're chasing a provider bug you don't want middleware chatter.
So debug accepts a config object where every category toggles independently:
Omitted categories default to true, so the common case is "turn off the one thing that's drowning you." Every category maps to a real pipeline surface:
| Category | What it logs |
|---|---|
| request | Outgoing call to a provider (model, message count, tool count) |
| provider | Every raw chunk or frame from the provider SDK |
| output | Every chunk or result yielded to the caller |
| middleware | Inputs and outputs around every middleware hook |
| tools | Before and after tool call execution |
| agentLoop | Agent-loop iterations and phase transitions |
| config | Config transforms returned by middleware onConfig hooks |
| errors | Every caught error anywhere in the pipeline |
Chat-only categories like tools and agentLoop just don't fire for summarize() or generateImage(), because they don't exist in those pipelines. You don't have to think about it.
console.log is the right default for local work. It is the wrong default for production, where you want structured JSON going to a log shipper, not ANSI colors going to stdout.
Pass your own Logger and the entire category system routes through it:
The Logger interface is four methods. Anything that writes a line of text fits. Pino, winston, bunyan, a fetch to a logging service, a no-op that forwards to your existing observability layer. All valid.
This is the detail we lost sleep over. If your custom logger throws (a cyclic-meta JSON.stringify, a transport that rejects synchronously, a typo in a bound this), the exception should not bubble up and mask the real error that triggered the log call in the first place.
Internally, every user-logger invocation is wrapped in a try/catch. A broken logger silently drops the log line. Your actual pipeline error still reaches you through thrown exceptions and RUN_ERROR chunks, exactly where you were looking for it.
If you need to know when your own logger is failing, guard inside your implementation. The SDK will not guess how loud you want logger failures to be.
Debug logging isn't a chat-only feature. Every activity in TanStack AI accepts the same option:
Realtime session adapters (openaiRealtime, elevenlabsRealtime) take it too.
On the provider side, every adapter in every provider package is wired through the structured logger: OpenAI, Anthropic, Gemini, Grok, Groq, Ollama, OpenRouter, fal, and ElevenLabs. 25 adapters total. Zero ad-hoc console.* calls remain in adapter source code. Whether you're debugging an Anthropic text stream or an ElevenLabs realtime session, the output shape is the same.
A few calls that look cosmetic but matter once you're staring at a thousand-line log.
Emoji prefixes on both sides of the tag. 📨 [tanstack-ai:output] 📨 ... reads faster than raw brackets in a dense stream, and your eye can hop categories without parsing text.
console.dir with depth: null. Node's default console formatting stops at depth 2, so nested provider chunks render as [Object] and you lose the thing you were trying to see. Debug logs surface the entire structure. In browsers, the raw object still lands in DevTools for interactive inspection.
Errors log unconditionally. You don't have to remember to turn them on. If you really want total silence, debug: false or debug: { errors: false } does it. Otherwise errors flow through even when you haven't asked for any other category.
Internal devtools middleware is muted. If you have the TanStack AI devtools middleware installed, its own hooks don't flood the middleware category. You see the middleware you wrote, not the plumbing.
Each of these is a small call on its own. Together they're the difference between "debug output I actually read" and "debug output I pipe to /dev/null within ten seconds."
Debug logging ships in the latest @tanstack/ai. It's additive, backward-compatible, and available on every activity today. No config file, no exporter, no platform.
Upgrade, add debug: true to the call you can't explain, and read the output.
For the full reference, see the Debug Logging guide. And if you want an even faster turnaround: TanStack AI ships an agent skill under packages/typescript/ai/skills/ so your LLM-powered dev tools can discover the flag on their own.
One flag. Every chunk. Your streams are no longer a black box.
此内容由惯性聚合(RSS阅读器)自动聚合整理,仅供阅读参考。 原文来自 — 版权归原作者所有。