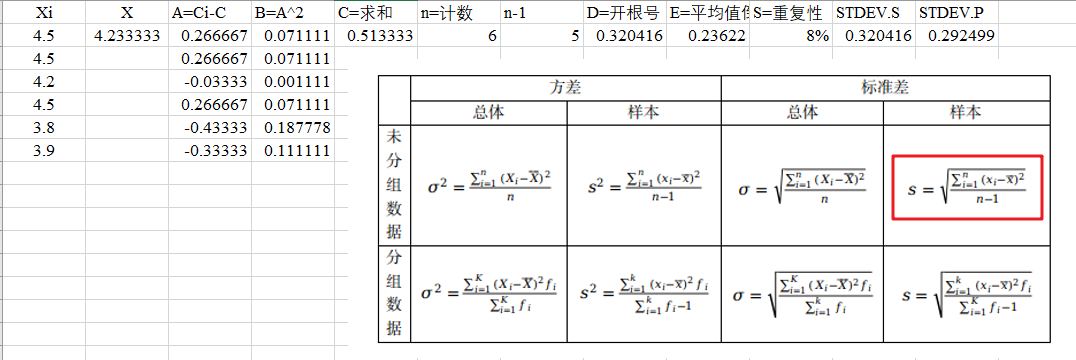
最近在统计多组数据的重复性,利用到了标准差相关的公式,自然而然想到是使用 Excel 来处理公式。总之,模板是实现了,将公式一步一步拆解,饶了一大圈,发现最后 Excel 本身就内置了求取标准差的函数,还不如不要让我知道这个结果呢,伤心: (
不过,这也带来了一些思考。自认为自己用 Excel 还算用得多的了,根本没有听过用过这样的内置函数,能不能写个简单的程序,只要将数据往里面一扔,就可以自动出来计算结果呢 —> 于是开始了折腾
这里选择社区版的 Pycharm,免费,集成开发环境用起来也方便
程序开发使用的是 PyQt 框架
刚安装完 Pycharm,会检测系统中是否已经安装好了 python,如果恰好没有安装过,那么根据软件的建议安装即可
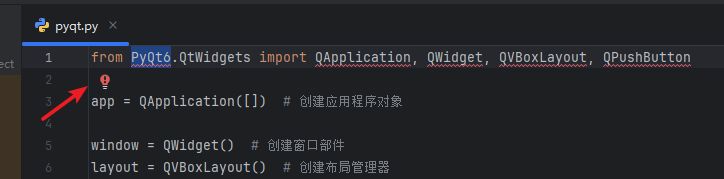
写好的代码中若检测有问题,Pycharm 会在对应的位置进行提示,如一下这段程序,刚安装的 python 肯定是没有 PyQT6 的程序包的,可以通过提示(小红灯泡处,Alt+Enter)进行安装
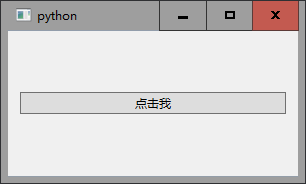
新建项目,新建 python 文件,粘贴如下代码进行测试:
1
2
3
4
5
6
7
8
9
10
11
12
13
14
from PyQt6.QtWidgets import QApplication, QWidget, QVBoxLayout, QPushButton app = QApplication([]) window = QWidget() layout = QVBoxLayout() button = QPushButton("点击我" ) layout.addWidget(button) window.setLayout(layout) window.show() app.exec ()
很好,说明各种环境已经搭建好了!
接下来尽管提需求,从开发者的角度出发,一步步给 GPT 进行引导,从易到难,功能从简单到复杂
例如我开始给 GPT 提需求:
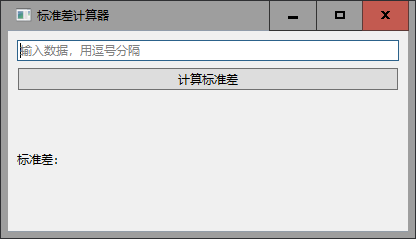
我提供一组数据,点击按钮之后,就可以在一个输出位置输出这组数据的标准差
1
2
3
4
5
6
7
8
9
10
11
12
13
14
15
16
17
18
19
20
21
22
23
24
25
26
27
28
29
30
31
32
33
34
35
36
37
38
39
40
41
42
43
44
45
46
47
48
49
50
51
52
53
54
55
56
import sys import numpy as np from PyQt6.QtWidgets import QApplication, QMainWindow, QWidget, QVBoxLayout, QPushButton, QLabel, QLineEdit class MainWindow (QMainWindow ): def __init__ (self ): super ().__init__() self.setWindowTitle("标准差计算器" ) self.setGeometry(100 , 100 , 400 , 200 ) self.central_widget = QWidget() self.setCentralWidget(self.central_widget) self.layout = QVBoxLayout() self.central_widget.setLayout(self.layout) self.data_input = QLineEdit() self.data_input.setPlaceholderText("输入数据,用逗号分隔" ) self.layout.addWidget(self.data_input) self.calculate_button = QPushButton("计算标准差" ) self.calculate_button.clicked.connect(self.calculate_standard_deviation) self.layout.addWidget(self.calculate_button) self.result_label = QLabel("标准差:" ) self.layout.addWidget(self.result_label) def calculate_standard_deviation (self ): data_text = self.data_input.text() if not data_text: self.result_label.setText("请先输入数据" ) return try : data = list (map (float , data_text.split(',' ))) except ValueError: self.result_label.setText("数据格式错误,请输入有效的数字" ) return std_dev = np.std(data) self.result_label.setText(f"标准差:{std_dev:.2 f} " ) if __name__ == "__main__" : app = QApplication(sys.argv) window = MainWindow() window.show() sys.exit(app.exec ())
好了,手动输入几组数据,确实能够计算出来标准差了,不过我们的数据来自 Excel,而且用逗号分隔数据的方式也不方便。于是就有了如下需求:
但是,你知道的,我的输入数据一般从 excel 中复制过来的,这种用逗号分隔数字的方式让我在输入的时候非常麻烦
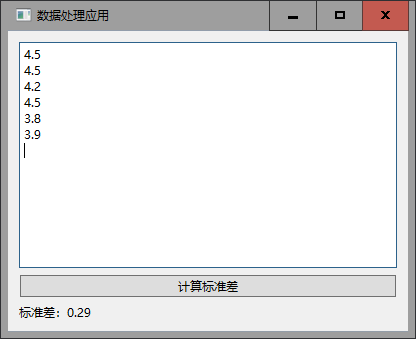
1
2
3
4
5
6
7
8
9
10
11
12
13
14
15
16
17
18
19
20
21
22
23
24
25
26
27
28
29
30
31
32
33
34
35
36
37
38
39
40
41
42
43
44
45
46
47
48
49
from PyQt6.QtWidgets import QApplication, QWidget, QVBoxLayout, QPushButton, QPlainTextEdit, QLabelimport numpy as npclass DataProcessingApp (QWidget ): def __init__ (self ): super ().__init__() self.setWindowTitle("数据处理应用" ) self.setGeometry(100 , 100 , 400 , 300 ) layout = QVBoxLayout() self.text_edit = QPlainTextEdit(self) self.text_edit.setPlaceholderText("在这里粘贴数据..." ) layout.addWidget(self.text_edit) self.calculate_button = QPushButton("计算标准差" , self) self.calculate_button.clicked.connect(self.calculate_std_dev) layout.addWidget(self.calculate_button) self.result_label = QLabel("标准差:" , self) layout.addWidget(self.result_label) self.setLayout(layout) def calculate_std_dev (self ): text = self.text_edit.toPlainText() try : data = [float (num) for line in text.splitlines() for num in line.split()] if data: std_dev = np.std(data) self.result_label.setText(f"标准差:{std_dev:.2 f} " ) else : self.result_label.setText("标准差:无效数据" ) except ValueError: self.result_label.setText("标准差:数据格式错误" ) app = QApplication([]) window = DataProcessingApp() window.show() app.exec ()
以上这组数据就是直接从 Excel 粘贴进去的。看来功能 GPT 是帮我们实现了
接下来按照上面的步骤,进一步提需求,进一步完善程序代码
当前的程序结构为
1
2
3
4
5
6
data_processor/ │ ├── main.py ├── ui.py ├── processor.py └── utils.py
main.py 1 2 3 4 5 6 7 8 9 import sysfrom PyQt6.QtWidgets import QApplicationfrom ui import DataProcessorAppif __name__ == "__main__" : app = QApplication(sys.argv) processor = DataProcessorApp() processor.show() sys.exit(app.exec ())
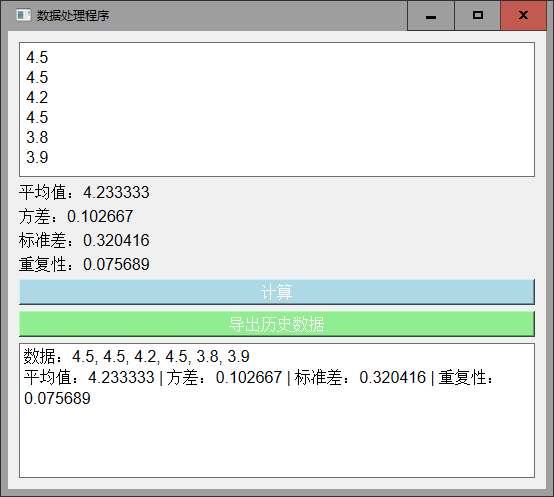
ui.py 1 2 3 4 5 6 7 8 9 10 11 12 13 14 15 16 17 18 19 20 21 22 23 24 25 26 27 28 29 30 31 32 33 34 35 36 37 38 39 40 41 42 43 44 45 46 47 48 49 50 51 52 53 54 55 56 57 58 59 60 61 62 63 64 65 66 67 68 69 70 71 72 73 74 75 76 77 78 79 80 81 82 83 84 85 86 87 88 89 90 91 92 93 94 95 96 97 98 99 100 101 102 103 104 105 106 107 108 109 from PyQt6.QtWidgets import QWidget, QVBoxLayout, QPushButton, QTextEdit, QLabel from PyQt6.QtGui import QFont, QColor from PyQt6.QtCore import Qt from PyQt6.QtGui import QPalette from processor import DataProcessor class DataProcessorApp (QWidget ): def __init__ (self ): super ().__init__() self.processor = DataProcessor() self.init_ui() def init_ui (self ): layout = QVBoxLayout() self.setStyleSheet("background-color: #f0f0f0;" ) self.setPalette(QPalette(QColor('#f0f0f0' ))) self.input_text = QTextEdit(self) self.input_text.setPlaceholderText("在这里粘贴数据,每行一个数字" ) self.input_text.setStyleSheet("font-size: 14px; padding: 10px; border: 1px solid #ccc;" ) layout.addWidget(self.input_text) self.mean_label = QLabel("平均值:" , self) self.mean_label.setStyleSheet("font-size: 16px; color: #333;" ) layout.addWidget(self.mean_label) self.variance_label = QLabel("方差:" , self) self.variance_label.setStyleSheet("font-size: 16px; color: #333;" ) layout.addWidget(self.variance_label) self.std_dev_label = QLabel("标准差:" , self) self.std_dev_label.setStyleSheet("font-size: 16px; color: #333;" ) layout.addWidget(self.std_dev_label) self.reliability_label = QLabel("重复性:" , self) self.reliability_label.setStyleSheet("font-size: 16px; color: #333;" ) layout.addWidget(self.reliability_label) process_button = QPushButton("计算标准差" , self) process_button.setStyleSheet( "background-color: #4CAF50; color: white; font-size: 14px; padding: 10px; border: none; border-radius: 5px;" ) process_button.clicked.connect(self.calculate_std_dev) layout.addWidget(process_button) reliability_button = QPushButton("计算重复性" , self) reliability_button.setStyleSheet( "background-color: #2196F3; color: white; font-size: 14px; padding: 10px; border: none; border-radius: 5px;" ) reliability_button.clicked.connect(self.calculate_reliability) layout.addWidget(reliability_button) self.history_text = QTextEdit(self) self.history_text.setPlaceholderText("历史记录" ) self.history_text.setReadOnly(True ) self.history_text.setStyleSheet("font-size: 14px; padding: 10px; border: 1px solid #ccc;" ) layout.addWidget(self.history_text) self.setLayout(layout) self.setWindowTitle("数据处理程序" ) self.setGeometry(100 , 100 , 500 , 400 ) self.setFont(QFont('Arial' , 12 )) def calculate_std_dev (self ): data = self.input_text.toPlainText().strip() try : numbers = [float (x) for x in data.split() if x.replace('.' , '' , 1 ).isdigit()] if numbers: std_dev = self.processor.calculate_std_dev(numbers) mean, variance, std_dev, _ = self.processor.calculate_reliability(numbers) self.mean_label.setText(f"平均值:{mean:.6 f} " ) self.variance_label.setText(f"方差:{variance:.6 f} " ) self.std_dev_label.setText(f"标准差:{std_dev:.6 f} " ) else : self.std_dev_label.setText("标准差:无效数据" ) self.mean_label.setText("平均值:无效数据" ) self.variance_label.setText("方差:无效数据" ) history = self.history_text.toPlainText() new_entry = f"数据:{', ' .join(map (str , numbers))} | 标准差:{std_dev:.6 f} | 平均值:{mean:.6 f} | 方差:{variance:.6 f} \n" self.history_text.setText(history + new_entry) except Exception as e: self.std_dev_label.setText(f"错误:{e} " ) self.mean_label.setText("平均值:无效数据" ) self.variance_label.setText("方差:无效数据" ) def calculate_reliability (self ): data = self.input_text.toPlainText().strip() try : numbers = [float (x) for x in data.split() if x.replace('.' , '' , 1 ).isdigit()] if numbers: mean, variance, std_dev, reliability = self.processor.calculate_reliability(numbers) self.mean_label.setText(f"平均值:{mean:.6 f} " ) self.variance_label.setText(f"方差:{variance:.6 f} " ) self.std_dev_label.setText(f"标准差:{std_dev:.6 f} " ) self.reliability_label.setText(f"重复性:{reliability:.6 f} " ) else : self.reliability_label.setText("重复性:无效数据" ) self.mean_label.setText("平均值:无效数据" ) self.variance_label.setText("方差:无效数据" ) self.std_dev_label.setText("标准差:无效数据" ) history = self.history_text.toPlainText() new_entry = f"数据:{', ' .join(map (str , numbers))} | 标准差:{std_dev:.6 f} | 重复性:{reliability:.6 f} | 平均值:{mean:.6 f} | 方差:{variance:.6 f} \n" self.history_text.setText(history + new_entry) except Exception as e: self.reliability_label.setText(f"错误:{e} " ) self.mean_label.setText("平均值:无效数据" ) self.variance_label.setText("方差:无效数据" ) self.std_dev_label.setText("标准差:无效数据" )
processor.py 1 2 3 4 5 6 7 8 9 10 11 12 13 import numpy as npclass DataProcessor : def calculate_std_dev (self, numbers ): return np.std(numbers, ddof=1 ) def calculate_reliability (self, numbers ): mean = np.mean(numbers) variance = np.var(numbers, ddof=1 ) std_dev = np.sqrt(variance) reliability = std_dev / mean return mean, variance, std_dev, reliability
想要将整个程序打包成 exe 文件,这样方便在没有 python 环境时依然可以运行,步骤如下:
安装 PyInstaller 包(可以直接在 powershell 中安装)
使用 PyInstaller 打包脚本
1、在 PowerShell 中,运行如下命令
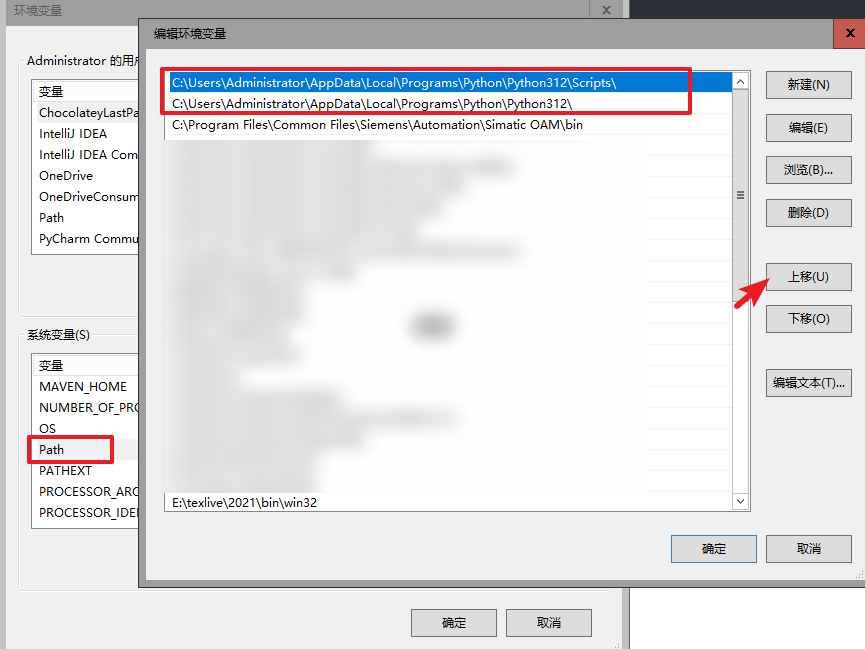
注意:前面已经安装了 python 程序,应该是可以使用 pip 命令了的。可输入 pip --version 命令查看。若该命令无法使用,很可能是没有将 python 解释器添加到环境变量中,可进行如下操作:
1
2
C:\Users\Administrator\AppData\Local\Programs\Python\Python312\ C:\Users\Administrator\AppData\Local\Programs\Python\Python312\Scripts\
这里的路径请替换为实际安装 Python 的路径
2、运行 pyinstaller 命令打包程序
1 pyinstaller --onefile --windowed your_script.py
--onefile:将所有内容打包成一个单独的 .exe 文件。--windowed:用于创建一个没有命令行窗口的图形界面应用。
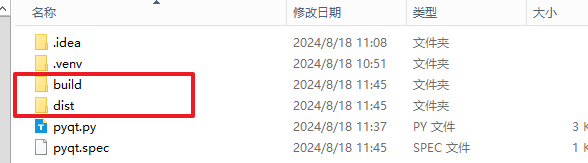
打包完成后,会生成几个文件夹:
dist 中包含生成的 exe 文件build 中包含构建过程中的临时文件,可以删除。your_script.spec 文件是 PyInstaller 的配置文件,可以根据需要进行修改。
恭喜你,得到了一款简易的小程序:)
明明程序实现的功能很简单,为什么生成的程序还那么大呢,例如生成上面的这个 exe 文件就有 50M。因为软件将一些必要的程序包(如 numpy 模块)都打包进去了,若之后再增加一些计算相关的各种功能进去,程序体积可能也只会大一丢丢吧
另外,打包时如何优化资源,排除掉一些不必要的模块还值得学学。不过,尽管文件体积大点,功能总算是实现了,还是蛮有成就感的