SQLite is an excellent database for web applications, but its default configuration is targeted at embedded systems and isn’t optimized for reads and writes from multiple processes and threads concurrently. Because of this, it needs tweaking to improve throughput and performance and reduce the number of errors you might see.
The main configuration options that I looked at and have benchmarked are:
I’ve also compared SQLite’s performance to PostgreSQL.
While this benchmark was done with Django, most ideas can be applied to other web frameworks.
WAL mode.IMMEDIATE transactions to prevent Database is Locked errors.synchronous=NORMAL and Memory-Mapped I/O had only a small impact on throughput.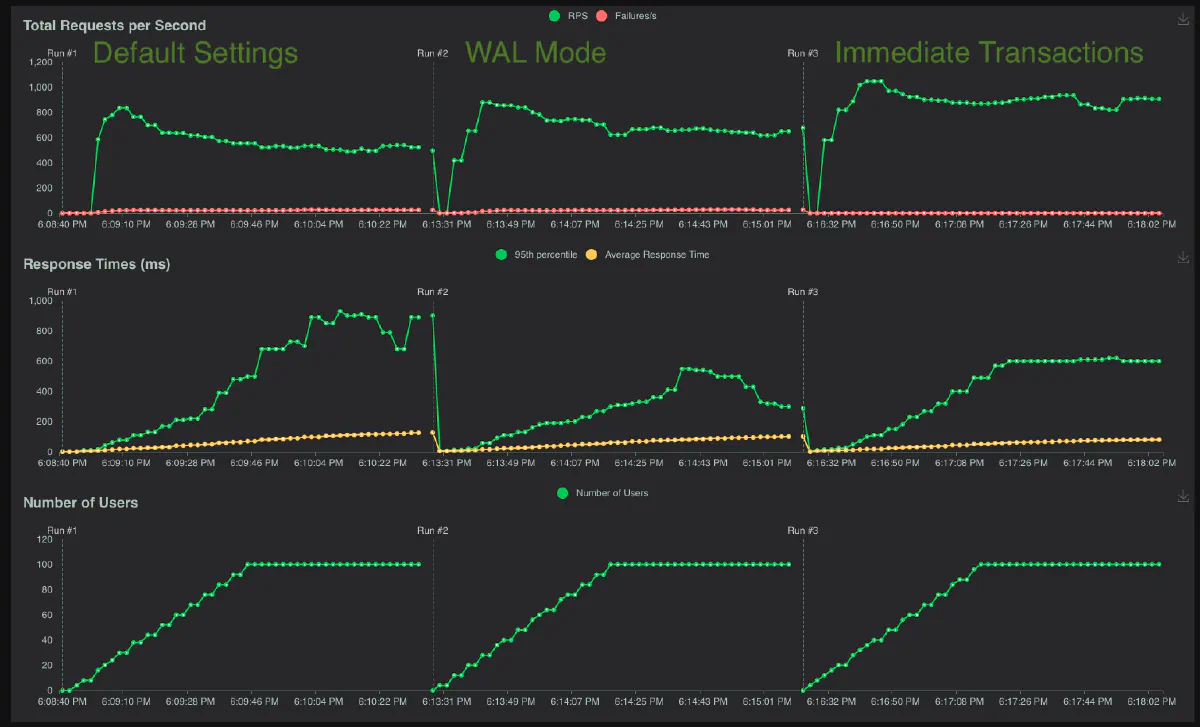
For the benchmark application, I re-used the repository from the Database is Locked errors blog post. However, I slightly changed it, inspired by Simon Willson’s SQLite benchmark.
The benchmark is write-heavy, which is the worst-case scenario for SQLite. About half of the requests write a row to the database, and the other half read ten rows from the DB. Each endpoint does a read, a write, or a combination of the two mixed in with different ways to set the transaction. You can see the request definitions in the GitHub Repository. As with every other benchmark, this could be better, so take the results with a grain of salt and run your tests on your database before applying the suggestion to production environments!
I used locust to run the benchmark with 100 concurrent users and a spawn rate of 2 users per second. I ran each benchmark for 100s, which means that for the first half of the benchmark, the number of concurrent users was increasing, and the second part was running at 100 concurrent users.
Without changing any settings and just running with whatever the default settings are in Django 5.0, we get the following results:
611.14 reqests/s
20.20  failures/s
The failures were due to the Database is Locked error. I’ve written an article about Database is Locked errors, so we won’t go into details here, but some of the settings we will change will help with this problem.
I have written about WAL mode before. By default, SQLite uses rollback journal mode, meaning any write to the database will block ALL reads. This is fine for single-thread apps, but for web applications, it can severely limit the concurrency of your requests.
This is where WAL mode comes in. With WAL, reads are no longer blocked by writes and can be executed concurrently. We can enable WAL mode with the following PRAGMA command:
sqlite3 db.sqlite3 'PRAGMA journal_mode=WAL;'
Prior to Django 5.1 there was no way to enable WAL mode in Django’s settings file. You have to remember to run the PRAGMA command manually but the PRAGMA command has to be only ran once per database!
Django 5.1 made it possible (PR, Ticket#24018) to configure PRAGMA commands when a new connection is established with the init_command option. You can use this to enable WAL mode in the settings file:
DATABASES = {
    "default": {
        "ENGINE": "django.db.backends.sqlite3",
        "NAME": BASE_DIR / "db.sqlite3",
        "OPTIONS": {
            "init_command": "PRAGMA journal_mode=WAL;",  # <- Only works in Django 5.1+
        },
    }
}
781.00 reqests/s
27.37  failures/s
We can see that the throughput has increased, but we are also getting more errors. If this was a read-heavy benchmark, we would see an even more significant increase in throughput.
By default, SQLite uses DEFFERED transactions and only promotes a read lock to a write lock when a write query is executed. This is the primary cause for the failures we’ve been seeing in the benchmark thus far, and using IMMEDIATE transactions fixes the problem. (Again, refer to Database is Locked blog post for more details about this).
Django 5.1 allows you to configure the transaction mode in the settings file:
DATABASES = {
    "default": {
        "ENGINE": "django.db.backends.sqlite3",
        "NAME": BASE_DIR / "db.sqlite3",
        "OPTIONS": {
            "transaction_mode": "IMMEDIATE",  # <- Only works in Django 5.1+
        },
    }
}
For earlier versions, you’ll need to override the DatabaseWrapper class to achieve this (example here).
998.72 requests/s
0.01   failures/s
As expected, the number of errors has decreased significantly. There was precisely one error during the benchmark. One request failed to acquire a write lock in 30 seconds (the timeout I set in the settings.py file).
It is surprising that the throughput also increased during this. I think this is because we no longer do rollbacks since there are fewer failures.
This change did make one of our read endpoints slower! The /read_transaction endpoint must now acquire a write lock even though it only executes a single SELECT statement. In DEFERRED mode, the write lock was never acquired. The logs show that the response time increased from 31ms to 118ms. This is why it is recommended not to use ATOMIC_REQUESTS in Django with IMMEDIATE transactions.
According to the SQLite pragma docs, the synchronous=NORMAL setting is a good choice for most applications running in WAL mode. We can enable it with the following PRAGMA command:
PRAGMA schema.synchronous = NORMAL;
But unlike WAL mode, it’s a per-connection setting, so you’ll need to run this command every time you open a new connection. In Django prior to 5.1, this is currently not possible without subclassing the DatabaseWrapper class and overriding the get_new_connection method.
In Django 5.1 or newer you can set the PRAGMA command in the init_command in your DATABASE settings.
1014.35 requests/s
0.00    failures/s
This increased the throughput slightly, but it isn’t as drastic a change this time, so I’d say changing this is optional.
Memory-mapped I/O can increase the performance of I/O-intensive operations, but it also has a few drawbacks, so be sure to read the SQLite documentation before enabling it.
1017.25 requests/s
0.00    failures/s
In my tests, the increase was negligible, so I’d say setting this is optional. However, your application might be very different, so I’d recommend testing it out (and let me know if it makes a difference!).
I have also run the same benchmark on a Postgres database to see how it compares to SQLite. I didn’t spend time optimizing Postgres, so assume there are a few ways to improve the numbers below!
444.21 requests/s
0.00   failures/s
We can see from the results that SQLite achieved a much higher throughput, even with the default settings (although with errors). But the requests/s don’t tell the whole story here, so let’s look at the response time percentiles for a read-and-write request:
Response time percentiles (approximated)
Type     Name                                                                                  50%    66%    75%    80%    90%    95%    98%    99%  99.9% 99.99%   100% # reqs
--------|--------------------------------------------------------------------------------|--------|------|------|------|------|------|------|------|------|------|------|------
GET      /read/                                                                                170    200    220    240    270    300    340    370    430    480    490  17067
POST     /write_read_transaction/                                                              180    210    230    240    270    300    340    370    450    460    460   1691
--------|--------------------------------------------------------------------------------|--------|------|------|------|------|------|------|------|------|------|------|------
And comparing to the best result of SQLite:
Response time percentiles (approximated)
Type     Name                                                                                  50%    66%    75%    80%    90%    95%    98%    99%  99.9% 99.99%   100% # reqs
--------|--------------------------------------------------------------------------------|--------|------|------|------|------|------|------|------|------|------|------|------
GET      /read/                                                                                  8     10     11     12     16     20     30     40     89    100    100  39024
POST     /write_read_transaction/                                                               19     37     78    110    230    510   1100   1500   3800   6400   6400   3837
Reads are, in fact, a lot faster in SQLite across all the percentiles. The Postgres instance was running on the same machine as the application, so network latency shouldn’t have been a factor. Still, the overhead of managing connections seems higher in Postgres than SQLite.
The Write percentiles tell a slightly different story. SQLite is again faster at the lower percentiles but then goes up to 6400ms at the 100th percentile, while Postgres stays at a much more comfortable 460ms.
SQLite can only have one write transaction active at a time. If another transaction tries to write while another is in progress, it’ll keep retrying until the timeout is up (assuming we are using the default busy_timeout handler). This can lead to starvation, so the response times increase.
Postgres has no single write-per-database limitation, so the response times remain consistent even under heavy load. This is usually preferred in web applications, so Postgres can be a better choice when you have hundreds of concurrent users all doing writes.
SQLite is hard to beat for mainly read workloads and even writes can perform well until you hit a certain number of concurrent requests. From a performance standpoint, running SQLite in production should only be problematic if you know your application will need horizontal scaling (although horizontally scaling reads is possible!).
Below are the locust reports for each configuration described above.
Type     Name                                                                          # reqs      # fails |    Avg     Min     Max    Med |   req/s  failures/s
--------|----------------------------------------------------------------------------|-------|-------------|-------|-------|-------|-------|--------|-----------
GET      /read/                                                                         23385     0(0.00%) |     16       2     675      8 |  233.84        0.00
GET      /read_transaction/                                                             23710     0(0.00%) |     16       2     906      9 |  237.09        0.00
POST     /read_write/                                                                    2279     1(0.04%) |    493       3   30505     50 |   22.79        0.01
POST     /read_write_transaction/                                                        2366 2009(84.91%) |     90       3     682     82 |   23.66       20.09
POST     /read_write_transaction_immediate/                                              2357     2(0.08%) |    490       3   30444     43 |   23.57        0.02
POST     /write/                                                                         2308     2(0.09%) |    587       3   30446     45 |   23.08        0.02
POST     /write_read/                                                                    2349     3(0.13%) |    529       3   30483     49 |   23.49        0.03
POST     /write_read_transaction/                                                        2362     3(0.13%) |    482       3   30470     47 |   23.62        0.03
--------|----------------------------------------------------------------------------|-------|-------------|-------|-------|-------|-------|--------|-----------
         Aggregated                                                                     61116  2020(3.31%) |    114       2   30505     11 |  611.14       20.20

Response time percentiles (approximated)
Type     Name                                                                                  50%    66%    75%    80%    90%    95%    98%    99%  99.9% 99.99%   100% # reqs
--------|--------------------------------------------------------------------------------|--------|------|------|------|------|------|------|------|------|------|------|------
GET      /read/                                                                                  8     12     15     19     36     56     94    130    290    640    680  23385
GET      /read_transaction/                                                                      9     13     16     19     38     58     94    120    260    520    910  23710
POST     /read_write/                                                                           50    130    220    370   1200   2500   4100   7300  19000  31000  31000   2279
POST     /read_write_transaction/                                                               82    100    120    130    160    190    230    280    580    680    680   2366
POST     /read_write_transaction_immediate/                                                     43    100    160    280   1200   2300   4300   6800  28000  30000  30000   2357
POST     /write/                                                                                45    120    230    380   1300   2500   5300   9300  30000  30000  30000   2308
POST     /write_read/                                                                           49    120    220    380   1300   2400   4700   6800  30000  30000  30000   2349
POST     /write_read_transaction/                                                               47    110    180    270   1100   2300   4100   6300  30000  30000  30000   2362
--------|--------------------------------------------------------------------------------|--------|------|------|------|------|------|------|------|------|------|------|------
         Aggregated                                                                             11     17     28     42     97    210   1200   2300  13000  30000  31000  61116

Error report
# occurrences      Error
------------------|---------------------------------------------------------------------------------------------------------------------------------------------
2009               POST /read_write_transaction/: "HTTPError('500 Server Error: Internal Server Error for url: /read_write_transaction/')"
3                  POST /write_read_transaction/: "HTTPError('500 Server Error: Internal Server Error for url: /write_read_transaction/')"
2                  POST /write/: "HTTPError('500 Server Error: Internal Server Error for url: /write/')"
2                  POST /read_write_transaction_immediate/: "HTTPError('500 Server Error: Internal Server Error for url: /read_write_transaction_immediate/')"
3                  POST /write_read/: "HTTPError('500 Server Error: Internal Server Error for url: /write_read/')"
1                  POST /read_write/: "HTTPError('500 Server Error: Internal Server Error for url: /read_write/')"
------------------|---------------------------------------------------------------------------------------------------------------------------------------------
Type     Name                                                                          # reqs      # fails |    Avg     Min     Max    Med |   req/s  failures/s
--------|----------------------------------------------------------------------------|-------|-------------|-------|-------|-------|-------|--------|-----------
GET      /read/                                                                         29874     0(0.00%) |     30       2     363     21 |  298.42        0.00
GET      /read_transaction/                                                             30228     0(0.00%) |     31       2     329     22 |  301.95        0.00
POST     /read_write/                                                                    2969     1(0.03%) |    317       2   30638     62 |   29.66        0.01
POST     /read_write_transaction/                                                        3106 2737(88.12%) |    161       2     821    150 |   31.03       27.34
POST     /read_write_transaction_immediate/                                              3052     1(0.03%) |    369       2   30558     67 |   30.49        0.01
POST     /write/                                                                         2930     0(0.00%) |    284       2   15446     60 |   29.27        0.00
POST     /write_read/                                                                    3001     1(0.03%) |    333       2   30627     65 |   29.98        0.01
POST     /write_read_transaction/                                                        3025     0(0.00%) |    305       2   18437     62 |   30.22        0.00
--------|----------------------------------------------------------------------------|-------|-------------|-------|-------|-------|-------|--------|-----------
         Aggregated                                                                     78185  2740(3.50%) |     91       2   30638     26 |  781.00       27.37

Response time percentiles (approximated)
Type     Name                                                                                  50%    66%    75%    80%    90%    95%    98%    99%  99.9% 99.99%   100% # reqs
--------|--------------------------------------------------------------------------------|--------|------|------|------|------|------|------|------|------|------|------|------
GET      /read/                                                                                 21     30     39     45     67     90    120    140    230    340    360  29874
GET      /read_transaction/                                                                     22     31     40     46     69     92    120    150    230    310    330  30228
POST     /read_write/                                                                           62    120    190    270    820   1500   2300   3600  12000  31000  31000   2969
POST     /read_write_transaction/                                                              150    180    210    230    290    340    420    480    630    820    820   3106
POST     /read_write_transaction_immediate/                                                     67    130    220    300    920   1500   2700   4100  18000  31000  31000   3052
POST     /write/                                                                                60    120    190    280    800   1300   2100   2900  12000  15000  15000   2930
POST     /write_read/                                                                           65    120    190    280    870   1600   2500   3600  16000  31000  31000   3001
POST     /write_read_transaction/                                                               62    120    180    250    730   1500   2500   3600  10000  18000  18000   3025
--------|--------------------------------------------------------------------------------|--------|------|------|------|------|------|------|------|------|------|------|------
         Aggregated                                                                             26     40     55     69    130    240    810   1400   5400  18000  31000  78185

Error report
# occurrences      Error
------------------|---------------------------------------------------------------------------------------------------------------------------------------------
2737               POST /read_write_transaction/: "HTTPError('500 Server Error: Internal Server Error for url: /read_write_transaction/')"
1                  POST /write_read/: "HTTPError('500 Server Error: Internal Server Error for url: /write_read/')"
1                  POST /read_write/: "HTTPError('500 Server Error: Internal Server Error for url: /read_write/')"
1                  POST /read_write_transaction_immediate/: "HTTPError('500 Server Error: Internal Server Error for url: /read_write_transaction_immediate/')"
------------------|---------------------------------------------------------------------------------------------------------------------------------------------
Type     Name                                                                          # reqs      # fails |    Avg     Min     Max    Med |   req/s  failures/s
--------|----------------------------------------------------------------------------|-------|-------------|-------|-------|-------|-------|--------|-----------
GET      /read/                                                                         38252     0(0.00%) |      8       2     169      7 |  382.27        0.00
GET      /read_transaction/                                                             38775     1(0.00%) |    118       2   30603     20 |  387.49        0.01
POST     /read_write/                                                                    3819     0(0.00%) |    108       3    9386     19 |   38.16        0.00
POST     /read_write_transaction/                                                        3887     0(0.00%) |    118       2    4078     21 |   38.84        0.00
POST     /read_write_transaction_immediate/                                              3801     0(0.00%) |    119       3    6878     21 |   37.98        0.00
POST     /write/                                                                         3727     0(0.00%) |    100       3    5860     15 |   37.25        0.00
POST     /write_read/                                                                    3824     0(0.00%) |     98       3    7363     17 |   38.21        0.00
POST     /write_read_transaction/                                                        3853     0(0.00%) |    115       3    3571     21 |   38.50        0.00
--------|----------------------------------------------------------------------------|-------|-------------|-------|-------|-------|-------|--------|-----------
         Aggregated                                                                     99938     1(0.00%) |     74       2   30603     11 |  998.72        0.01

Response time percentiles (approximated)
Type     Name                                                                                  50%    66%    75%    80%    90%    95%    98%    99%  99.9% 99.99%   100% # reqs
--------|--------------------------------------------------------------------------------|--------|------|------|------|------|------|------|------|------|------|------|------
GET      /read/                                                                                  7      8      9     10     13     17     26     36     85    130    170  38252
GET      /read_transaction/                                                                     20     50     82    110    280    600   1100   1500   3100   8400  31000  38775
POST     /read_write/                                                                           19     36     68    100    230    500   1000   1400   3800   9400   9400   3819
POST     /read_write_transaction/                                                               21     51     84    110    280    610   1100   1500   3100   4100   4100   3887
POST     /read_write_transaction_immediate/                                                     21     51     86    130    280    600   1000   1500   2900   6900   6900   3801
POST     /write/                                                                                15     32     56     86    220    490   1000   1400   4300   5900   5900   3727
POST     /write_read/                                                                           17     34     62     88    220    510    920   1300   2700   7400   7400   3824
POST     /write_read_transaction/                                                               21     51     84    120    280    600   1100   1400   2900   3600   3600   3853
--------|--------------------------------------------------------------------------------|--------|------|------|------|------|------|------|------|------|------|------|------
         Aggregated                                                                             11     18     32     52    140    340    810   1200   2700   5900  31000  99938

Error report
# occurrences      Error
------------------|---------------------------------------------------------------------------------------------------------------------------------------------
1                  GET /read_transaction/: "HTTPError('500 Server Error: Internal Server Error for url: /read_transaction/')"
------------------|---------------------------------------------------------------------------------------------------------------------------------------------
Type     Name                                                                          # reqs      # fails |    Avg     Min     Max    Med |   req/s  failures/s
--------|----------------------------------------------------------------------------|-------|-------------|-------|-------|-------|-------|--------|-----------
GET      /read/                                                                         39024     0(0.00%) |      9       2     101      8 |  389.93        0.00
GET      /read_transaction/                                                             39321     0(0.00%) |    112       2   21469     18 |  392.90        0.00
POST     /read_write/                                                                    3853     0(0.00%) |    114       2    8364     20 |   38.50        0.00
POST     /read_write_transaction/                                                        3857     0(0.00%) |    112       3    5845     19 |   38.54        0.00
POST     /read_write_transaction_immediate/                                              3839     0(0.00%) |    117       3    8388     20 |   38.36        0.00
POST     /write/                                                                         3906     0(0.00%) |    109       2    9382     18 |   39.03        0.00
POST     /write_read/                                                                    3879     0(0.00%) |    118       3    4663     21 |   38.76        0.00
POST     /write_read_transaction/                                                        3837     0(0.00%) |    110       3    6360     19 |   38.34        0.00
--------|----------------------------------------------------------------------------|-------|-------------|-------|-------|-------|-------|--------|-----------
         Aggregated                                                                    101516     0(0.00%) |     73       2   21469     12 | 1014.35        0.00

Response time percentiles (approximated)
Type     Name                                                                                  50%    66%    75%    80%    90%    95%    98%    99%  99.9% 99.99%   100% # reqs
--------|--------------------------------------------------------------------------------|--------|------|------|------|------|------|------|------|------|------|------|------
GET      /read/                                                                                  8     10     11     12     16     20     30     40     89    100    100  39024
GET      /read_transaction/                                                                     18     36     75    110    230    590   1100   1500   3300  11000  21000  39321
POST     /read_write/                                                                           20     37     71     95    230    600   1200   1600   3300   8400   8400   3853
POST     /read_write_transaction/                                                               19     37     77    110    230    600   1100   1500   3300   5800   5800   3857
POST     /read_write_transaction_immediate/                                                     20     37     76    110    230    600   1200   1700   4700   8400   8400   3839
POST     /write/                                                                                18     35     62     87    220    590   1100   1500   4300   9400   9400   3906
POST     /write_read/                                                                           21     40     78    110    240    620   1200   1600   4100   4700   4700   3879
POST     /write_read_transaction/                                                               19     37     78    110    230    510   1100   1500   3800   6400   6400   3837
--------|--------------------------------------------------------------------------------|--------|------|------|------|------|------|------|------|------|------|------|------
         Aggregated                                                                             12     18     29     42    140    290    810   1200   2900   6300  21000 101516
Type     Name                                                                          # reqs      # fails |    Avg     Min     Max    Med |   req/s  failures/s
--------|----------------------------------------------------------------------------|-------|-------------|-------|-------|-------|-------|--------|-----------
GET      /read/                                                                         39424     0(0.00%) |     10       2     101      9 |  394.23        0.00
GET      /read_transaction/                                                             38734     0(0.00%) |    111       2   18422     19 |  387.33        0.00
POST     /read_write/                                                                    4007     0(0.00%) |    126       2   10411     24 |   40.07        0.00
POST     /read_write_transaction/                                                        3965     0(0.00%) |    120       2   13399     20 |   39.65        0.00
POST     /read_write_transaction_immediate/                                              3919     0(0.00%) |    108       2    4079     20 |   39.19        0.00
POST     /write/                                                                         3889     0(0.00%) |    105       2    5862     20 |   38.89        0.00
POST     /write_read/                                                                    3868     0(0.00%) |    117       2    5023     21 |   38.68        0.00
POST     /write_read_transaction/                                                        3922     0(0.00%) |    107       2    6361     20 |   39.22        0.00
--------|----------------------------------------------------------------------------|-------|-------------|-------|-------|-------|-------|--------|-----------
         Aggregated                                                                    101728     0(0.00%) |     73       2   18422     13 | 1017.25        0.00

Response time percentiles (approximated)
Type     Name                                                                                  50%    66%    75%    80%    90%    95%    98%    99%  99.9% 99.99%   100% # reqs
--------|--------------------------------------------------------------------------------|--------|------|------|------|------|------|------|------|------|------|------|------
GET      /read/                                                                                  9     11     12     13     17     22     30     41     89     98    100  39424
GET      /read_transaction/                                                                     19     37     76    110    230    590   1100   1400   3600   9400  18000  38734
POST     /read_write/                                                                           24     52     89    130    280    600   1200   1700   3600  10000  10000   4007
POST     /read_write_transaction/                                                               20     39     79    110    260    610   1100   1500   5000  13000  13000   3965
POST     /read_write_transaction_immediate/                                                     20     41     80    110    240    590   1000   1400   2500   4100   4100   3919
POST     /write/                                                                                20     39     77    110    230    500   1000   1400   2900   5900   5900   3889
POST     /write_read/                                                                           21     42     82    110    260    610   1100   1500   3600   5000   5000   3868
POST     /write_read_transaction/                                                               20     36     73     98    230    590   1000   1300   3100   6400   6400   3922
--------|--------------------------------------------------------------------------------|--------|------|------|------|------|------|------|------|------|------|------|------
         Aggregated                                                                             13     19     30     47    140    290    810   1200   2700   6400  18000 101728
Type     Name                                                                          # reqs      # fails |    Avg     Min     Max    Med |   req/s  failures/s
--------|----------------------------------------------------------------------------|-------|-------------|-------|-------|-------|-------|--------|-----------
GET      /read/                                                                         17067     0(0.00%) |    159       7     489    170 |  170.30        0.00
GET      /read_transaction/                                                             17155     0(0.00%) |    160       8     474    170 |  171.18        0.00
POST     /read_write/                                                                    1698     0(0.00%) |    162       9     458    170 |   16.94        0.00
POST     /read_write_transaction/                                                        1771     0(0.00%) |    164      10     453    170 |   17.67        0.00
POST     /read_write_transaction_immediate/                                              1775     0(0.00%) |    166       9     457    180 |   17.71        0.00
POST     /write/                                                                         1732     0(0.00%) |    162       8     428    170 |   17.28        0.00
POST     /write_read/                                                                    1629     0(0.00%) |    166       9     411    180 |   16.25        0.00
POST     /write_read_transaction/                                                        1691     0(0.00%) |    166       9     456    180 |   16.87        0.00
--------|----------------------------------------------------------------------------|-------|-------------|-------|-------|-------|-------|--------|-----------
         Aggregated                                                                     44518     0(0.00%) |    161       7     489    170 |  444.21        0.00

Response time percentiles (approximated)
Type     Name                                                                                  50%    66%    75%    80%    90%    95%    98%    99%  99.9% 99.99%   100% # reqs
--------|--------------------------------------------------------------------------------|--------|------|------|------|------|------|------|------|------|------|------|------
GET      /read/                                                                                170    200    220    240    270    300    340    370    430    480    490  17067
GET      /read_transaction/                                                                    170    210    220    240    270    300    340    370    440    470    470  17155
POST     /read_write/                                                                          170    200    230    240    270    290    330    360    450    460    460   1698
POST     /read_write_transaction/                                                              170    210    230    240    270    300    330    360    440    450    450   1771
POST     /read_write_transaction_immediate/                                                    180    210    230    240    280    310    350    390    460    460    460   1775
POST     /write/                                                                               170    210    230    240    270    300    330    350    430    430    430   1732
POST     /write_read/                                                                          180    210    230    240    280    300    330    350    410    410    410   1629
POST     /write_read_transaction/                                                              180    210    230    240    270    300    340    370    450    460    460   1691
--------|--------------------------------------------------------------------------------|--------|------|------|------|------|------|------|------|------|------|------|------
         Aggregated                                                                            170    210    230    240    270    300    340    370    440    470    490  44518
此内容由惯性聚合(RSS阅读器)自动聚合整理,仅供阅读参考。 原文来自 — 版权归原作者所有。