惯性聚合 高效追踪和阅读你感兴趣的博客、新闻、科技资讯
阅读原文 在惯性聚合中打开

推荐订阅源

F
Full Disclosure
WordPress大学
WordPress大学
小众软件
小众软件
Cloudbric
Cloudbric
AWS News Blog
AWS News Blog
腾讯CDC
量子位
人人都是产品经理
人人都是产品经理
大猫的无限游戏
大猫的无限游戏
freeCodeCamp Programming Tutorials: Python, JavaScript, Git & More
V
Vulnerabilities – Threatpost
Scott Helme
Scott Helme
Hugging Face - Blog
Hugging Face - Blog
博客园_首页
C
CXSECURITY Database RSS Feed - CXSecurity.com
The Hacker News
The Hacker News
奇客Solidot–传递最新科技情报
奇客Solidot–传递最新科技情报
IT之家
IT之家
Jina AI
Jina AI
Attack and Defense Labs
S
SegmentFault 最新的问题
Simon Willison's Weblog
The Cloudflare Blog
阮一峰的网络日志
阮一峰的网络日志
T
Tailwind CSS Blog
Last Week in AI
Last Week in AI
博客园 - 【当耐特】
Google Online Security Blog
美团技术团队
OSCHINA 社区最新新闻
OSCHINA 社区最新新闻
V
Visual Studio Blog
罗磊的独立博客
L
LINUX DO - 最新话题
博客园 - Franky
博客园 - 叶小钗
Apple Machine Learning Research
The Last Watchdog
The Last Watchdog
J
Java Code Geeks
AI
AI
C
Cisco Blogs
酷 壳 – CoolShell
酷 壳 – CoolShell
C
Cyber Attacks, Cyber Crime and Cyber Security
Cisco Talos Blog
Cisco Talos Blog
博客园 - 三生石上(FineUI控件)
雷峰网
雷峰网
Help Net Security
Help Net Security
钛媒体:引领未来商业与生活新知
钛媒体:引领未来商业与生活新知
云风的 BLOG
云风的 BLOG
I
Intezer
S
Securelist

Luca Cavallin

AI Engineering for Developers | Blog AI Engineering for Developers Platform Engineering End-to-End | Blog Google Cloud Networking 101: The Comprehensive TLDR | Blog Google Cloud Networking 101: The Comprehensive TLDR Containers Are Not Automatically Secure | Blog Containers Are Not Automatically Secure Watery Stone Beacon | Photography Blue Iceman Suture | Photography Hidden Emerald Pool | Photography Autumn Chapel Pinnacles | Photography A Tour of eBPF in the Linux Kernel: Observability, Security and Networking | Blog A Tour of eBPF in the Linux Kernel: Observability, Security and Networking Shared Violet Pulse | Photography Kubernetes Networking from Packets to Pods | Blog An Overview of Network Protocols | Blog An Overview of Network Protocols A Quick Journey Into the Linux Kernel | Blog A Quick Journey Into the Linux Kernel OpenTelemetry: A Guide to Observability with Go | Blog I'm on the Cillers Podcast Talking About Tech and Hackathons | Blog Yet Another List of Random Opinions on Writing Readable Code and Other Rants | Blog My post about Istio is now on the Istio blog too! | Blog Tropical Jungle Escape | Photography The Istio Service Mesh for People Who Have Stuff to Do | Blog Dreamy Cartoonscape Windmill | Photography Twilight Windmill Reflections | Photography Notes I took while reading "Applied Machine Learning and AI for Engineers" and "Introducing MLOps" | Blog Things I've Learned About Terraform That I Keep Telling People About | Blog Analyzing Unsplash Photo Performance with Python | Blog I am a Top Mentor on MentorCruise! 🎉 | Blog CI/CD Observability on GitHub Actions and the Role of OpenTelemetry | Blog CI/CD Observability on GitHub Actions and the Role of OpenTelemetry Silent Water Sentinel | Photography Three Early Crosses | Photography Fiery Twilight Trails | Photography Forested Folds Flowing | Photography Majestic Snowbound Spire | Photography Shrouded Winter Peaks | Photography Space Cat Pillar | Photography I am a CNCF (Cloud Native Computing Foundation) Ambassador! | Blog Curved Valley Mist | Photography Highly Independent Tree | Photography Misty Morning Plateau | Photography Sick Shadows Fading | Photography Half Moon Blossom | Photography Serene Pedestal Swinging | Photography Sunset Clouds Reeling | Photography Aerial Nose Parking | Photography How to Structure C Projects: These Best Practices Worked for Me | Blog How to Structure C Projects: These Best Practices Worked for Me I'm on the KubeFM Podcast Talking About "Linux Containers From Scratch" | Blog I am (again) a Google Developers Expert! | Blog How to Configure OIDC with Terraform for GitHub Enterprise Server | Blog How to Configure OIDC with Terraform for GitHub Enterprise Server Modern Frontend Development: A Tooling Overview for Engineers Revisiting the Field | Blog Meet verto.sh: Your Gateway to Open-Source Collaboration. | Blog Crafting a Clean, Maintainable, and Understandable Makefile for a C Project. | Blog Crafting a Clean, Maintainable, and Understandable Makefile for a C Project. | Blog barco: Linux Containers From Scratch in C. | Blog barco: Linux Containers From Scratch in C. | Blog How to Create a Release With Multiple Artifacts From a GitHub Actions Workflow Using the Matrix Strategy | Blog How to Create a Release With Multiple Artifacts From a GitHub Actions Workflow Using the Matrix Strategy | Blog How Databases Store and Retrieve Data with B-Trees | Blog How Databases Store and Retrieve Data with B-Trees | Blog Concurrency in Go: Goroutines, Channels, Mutexes, and More | Blog Concurrency in Go: Goroutines, Channels, Mutexes, and More | Blog Club Cloud 2021: Cloud Engineering Panel Discussion | Blog Club Cloud 2021: Cloud Engineering Panel Discussion | Blog How to Prepare for the Google Cloud Engineer Associate Certification Exam | Blog How to Prepare for the Google Cloud Engineer Associate Certification Exam | Blog What is Google Cloud Deploy? | Blog What is GitOps? | Blog Club Cloud Stories #2 - News from Around the Cloud | Blog Club Cloud Stories #2 - News from Around the Cloud | Blog Club Cloud Stories #1 - The First Episode with Antoni Tzavelas & Mark van Holsteijn | Blog Club Cloud Stories #1 - The First Episode with Antoni Tzavelas & Mark van Holsteijn | Blog Quiet Oak Shining | Photography How to Read Firestore Events with Cloud Functions and Golang | Blog How to Read Firestore Events with Cloud Functions and Golang | Blog Google Cloud Pub/Sub vs NATS: An Easy-to-Understand Comparison | Blog Google Cloud Pub/Sub vs NATS: An Easy-to-Understand Comparison | Blog How to Deploy a Multi-cluster Service Mesh on GKE with Anthos | Blog How to Deploy a Multi-cluster Service Mesh on GKE with Anthos | Blog How to Safely Store Secrets in Terraform Using Cloud KMS | Blog How to Safely Store Secrets in Terraform Using Cloud KMS | Blog Designing Serverless Applications on AWS - Jacco Kulman and Luca Cavallin @ End2End LIVE | Blog Designing Serverless Applications on AWS - Jacco Kulman and Luca Cavallin @ End2End LIVE | Blog How to Use Terraform Workspaces to Manage Environment-based Configuration | Blog How to Use Terraform Workspaces to Manage Environment-based Configuration | Blog Puffy Steel Spreading | Photography How to Deploy ElasticSearch on GKE using Terraform and Helm | Blog How to Deploy ElasticSearch on GKE using Terraform and Helm | Blog Summer Windmills Spinning | Photography How to Optimize PHP Performance on Google Cloud Run | Blog How to Optimize PHP Performance on Google Cloud Run | Blog Foggy Boats Rusting | Photography How I Prepared for the Google Cloud Associate Cloud Engineer Exam | Blog How I Prepared for the Google Cloud Associate Cloud Engineer Exam | Blog Winter Kids Chasing | Photography
Analyzing Unsplash Photo Performance with Python
Luca Cavallin · 2024-06-02 · via Luca Cavallin

Photo-taking engineers, understanding how photos perform online can provide valuable insights into audience preferences and engagement. In this post, I'll walk you through a Python script I created to analyze the performance of my photos on Unsplash. This script fetches photos, calculates performance scores, identifies outliers, normalizes the scores, and generates a visualization.

You can find the full code in the repository available at lucavallin/uppa.

What Does the Script Do?

Here's a high-level overview of what the script does:

  1. Fetch Photos from Unsplash: Retrieves your photos using the Unsplash API.
  2. Calculate Performance Scores: Computes raw performance scores based on views per day and downloads per view.
  3. Identify Upper Bound Outliers: Uses the Interquartile Range (IQR) method to calculate the upper bound for outliers.
  4. Filter Upper Bound Outliers: Removes photos identified as upper bound outliers.
  5. Recalculate Min and Max Scores: Recalculates the minimum and maximum raw scores after removing outliers.
  6. Normalize Scores: Normalizes the scores of the remaining photos to a scale of 0 to 100.
  7. Output Results: Prints the normalized scores, generates a bar chart, and optionally saves the results to a JSON file.

Why I Wrote This Script

Unsplash provides views and downloads statistics for each photo, but these numbers alone are not very meaningful. To gain deeper insights into the performance of my photos, I needed to consider additional factors:

  • How many views in how many days?: This helps to understand the rate at which a photo is being viewed.
  • How many downloads in how many days?: This provides insight into the rate at which a photo is being downloaded.
  • How many views turn into downloads?: This conversion rate reflects the appeal and effectiveness of a photo.

By taking these aspects into account, the script calculates a more comprehensive performance score, allowing me to better evaluate and compare the success of my photos on Unsplash.

Prerequisites

To get started, ensure you have Python 3.x installed along with the necessary libraries:

  • requests: This library is used to make HTTP requests to the Unsplash API to fetch your photos.
  • numpy: This library is used for numerical operations, such as calculating the Interquartile Range (IQR) for identifying outliers and normalizing scores.
  • matplotlib: This library is used to generate a bar chart for visualizing the normalized scores of your photos.

You can install the required libraries using pip:

sh

pip install requests numpy matplotlib

You'll also need an Unsplash API access key, which you can get by registering as a developer on the Unsplash website.

Setting Up Environment Variables

Before running the script, set up the environment variables for your Unsplash access key and username.

On macOS/Linux

Add the following lines to your .bashrc or .bash_profile:

sh

export UNSPLASH_ACCESS_KEY='your_unsplash_access_key'
export UNSPLASH_USERNAME='your_unsplash_username'

Then, source the file to apply the changes:

sh

source ~/.bashrc  # or source ~/.bash_profile

On Windows

Set the environment variables using the command line or through the System Properties dialog:

sh

setx UNSPLASH_ACCESS_KEY "your_unsplash_access_key"
setx UNSPLASH_USERNAME "your_unsplash_username"

The Script

Here's the full Python script with explanations:

Step 1: Import Libraries and Read Environment Variables

First, we import the necessary libraries and read the access key and username from environment variables.

python

import os
import requests
import numpy as np
import json
import matplotlib.pyplot as plt
 
# Read ACCESS_KEY and USERNAME from environment variables
ACCESS_KEY = os.getenv('UNSPLASH_ACCESS_KEY')
USERNAME = os.getenv('UNSPLASH_USERNAME')
 
# Check if ACCESS_KEY and USERNAME are set
if not ACCESS_KEY or not USERNAME:
    print("Please set the UNSPLASH_ACCESS_KEY and UNSPLASH_USERNAME environment variables.")
    exit()
 
PHOTOS_FILENAME = 'photos.json'

Step 2: Fetch Photos from Unsplash

We define a function to fetch photos from the Unsplash API with pagination.

python

def get_unsplash_photos(username, access_key):
    url = f"https://api.unsplash.com/users/{username}/photos"
    all_photos = []
    page = 1
    per_page = 30
 
    while True:
        params = {
            'client_id': access_key,
            'page': page,
            'per_page': per_page,
            'stats': 'true'
        }
        response = requests.get(url, params=params)
        if response.status_code != 200:
            print(f"Error: {response.status_code}")
            break
 
        photos = response.json()
        if not photos:
            break
 
        all_photos.extend(photos)
        page += 1
 
    return all_photos

Step 3: Save and Load Photos

We create functions to save photos to a JSON file and load them from the file if it exists.

python

def save_photos_to_file(photos, filename):
    with open(filename, 'w') as f:
        json.dump(photos, f, indent=4)
 
def load_photos_from_file(filename):
    with open(filename, 'r') as f:
        return json.load(f)

Step 4: Load or Fetch Photos

To save on API requests, which can be limited and take time, we first check if a local file (photos.json) exists. If it does, we load the photos from this file. If not, we fetch the photos from Unsplash and save them to the local file for future use.

python

if (os.path.exists(PHOTOS_FILENAME)):
    photos = load_photos_from_file(PHOTOS_FILENAME)
    print("Loaded photos from photos.json")
else:
    photos = get_unsplash_photos(USERNAME, ACCESS_KEY)
    if not photos:
        print("No photos retrieved. Please check your username and access key.")
        exit()
    save_photos_to_file(photos, PHOTOS_FILENAME)
    print("Fetched photos from Unsplash API and saved to photos.json")

Step 5: Calculate Raw Performance Scores

Next, we calculate raw performance scores for each photo. This is done by considering both the number of views and the number of downloads the photo has received, and how long the photo has been online. The formula used here combines views per day and downloads per view to provide a balanced measure of performance.

We focus on photos that have been online for at least 30 days to ensure a meaningful analysis, as very recent photos might not have enough data to provide a reliable performance score.

python

W_v = 1.5
W_d = 0.5
filtered_photos = []
 
for photo in photos:
    days_online = (np.datetime64('now') - np.datetime64(photo['created_at'])).astype(int) / (24 * 60 * 60)
    if days_online >= 30:
        views = photo['statistics']['views']['total'] or 1  # Avoid division by zero
        downloads = photo['statistics']['downloads']['total']
        raw_score = (views / days_online) * W_v + (downloads / views) * W_d
        photo['days_online'] = days_online
        photo['raw_score'] = raw_score
        filtered_photos.append(photo)

Step 6: Identify and Filter Upper Bound Outliers

To ensure that our analysis is not skewed by exceptionally high-performing photos, we identify and filter out these outliers. We use the Interquartile Range (IQR) method to find the upper bound. The IQR is a measure of statistical dispersion and is used here to detect outliers.

By removing photos with scores above this upper bound, we focus on the majority of photos, providing a more accurate representation of typical performance.

python

raw_scores = np.array([photo['raw_score'] for photo in filtered_photos])
Q1 = np.percentile(raw_scores, 25)
Q3 = np.percentile(raw_scores, 75)
IQR = Q3 - Q1
upper_bound = Q3 + 1.5 * IQR
 
filtered_photos = [photo for photo in filtered_photos if photo['raw_score'] <= upper_bound]

Step 7: Normalize Scores

After filtering outliers, we normalize the raw scores to a range of 0 to 100. Normalization allows us to compare the performance of photos on a common scale, making it easier to identify top performers.

We first recalculate the minimum and maximum raw scores from the filtered data. Then, we apply the normalization formula to each photo's raw score.

python

filtered_raw_scores = np.array([photo['raw_score'] for photo in filtered_photos])
min_raw = filtered_raw_scores.min()
max_raw = filtered_raw_scores.max()
 
for photo in filtered_photos:
    photo['normalized_score'] = ((photo['raw_score'] - min_raw) / (max_raw - min_raw)) * 100
    photo['days_online'] = int(photo['days_online'])

Step 8: Sort and Display Results

We sort the photos by their normalized scores and print the results. This provides an easy way to see which photos are performing the best.

python

sorted_photos = sorted(filtered_photos, key=lambda x: x['normalized_score'], reverse=True)
for photo in sorted_photos:
    print(f"Photo URL: https://unsplash.com/photos/{photo['id']}, Days Online: {photo['days_online'] }, Views: {photo['statistics']['views']['total']}, Downloads: {photo['statistics']['downloads']['total']}, Normalized Score: {photo['normalized_score']:.2f}")

The output will look something like this:

Photo URL: https://unsplash.com/photos/kEOpys1hHkc, Days Online: 38, Views: 5035, Downloads: 58, Normalized Score: 100.00
Photo URL: https://unsplash.com/photos/wimuq4MFt34, Days Online: 38, Views: 5004, Downloads: 69, Normalized Score: 99.34
Photo URL: https://unsplash.com/photos/fNb_pAywgts, Days Online: 38, Views: 3869, Downloads: 17, Normalized Score: 75.09
Photo URL: https://unsplash.com/photos/D8ZVdmF8glM, Days Online: 114, Views: 11183, Downloads: 97, Normalized Score: 71.92
Photo URL: https://unsplash.com/photos/kHeTz2vhBQM, Days Online: 37, Views: 3395, Downloads: 27, Normalized Score: 67.27
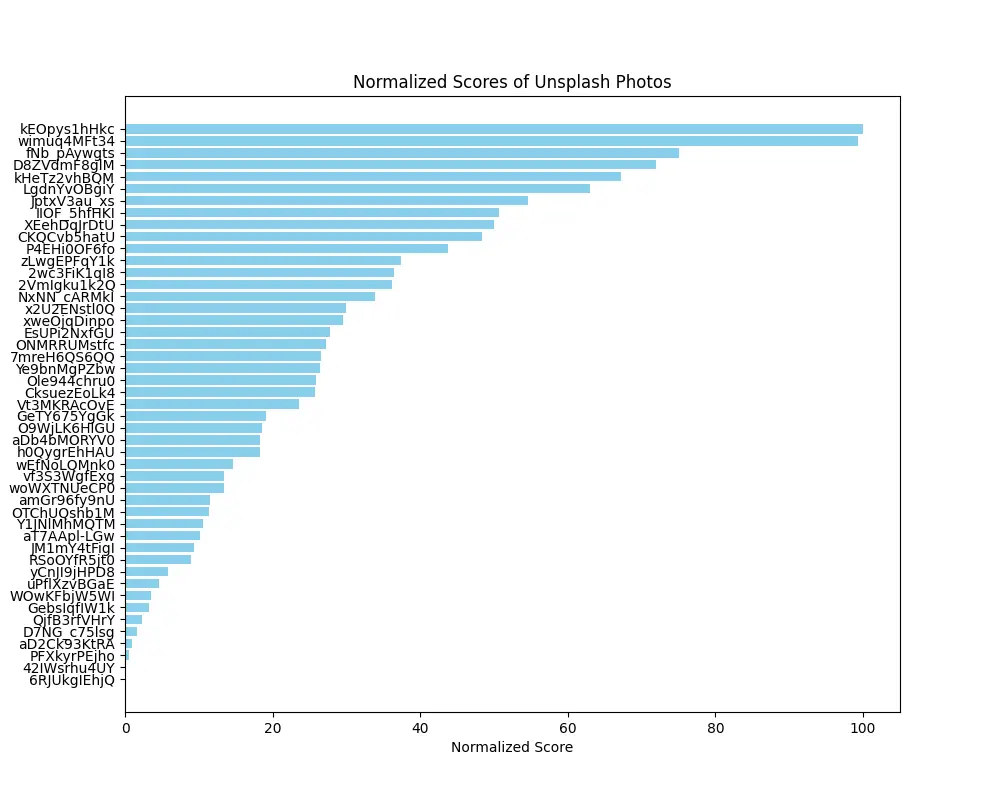
....

Step 9: Generate a Bar Chart

Finally, we generate a bar chart to visualize the normalized scores of the photos. This helps to quickly identify the top-performing photos.

python

photo_ids = [photo['id'] for photo in sorted_photos]
normalized_scores = [photo['normalized_score'] for photo in sorted_photos]
 
plt.figure(figsize=(10, 8))
plt.barh(photo_ids, normalized_scores, color='skyblue')
plt.xlabel('Normalized Score')
plt.ylabel('Photo ID')
plt.title('Normalized Scores of Unsplash Photos')
plt.gca().invert_yaxis()  # Invert y-axis to have the highest score at the top
plt.show()

This is one of the charts generated by the script:

Normalized Scores of Unsplash Photos

Running the Script

To run the script, ensure you have set the environment variables and then execute:

sh

python uppa.py

You can find the full code in the repository available at lucavallin/uppa.

Conclusion

By analyzing the performance of your photos on Unsplash, you can get extra insights into which photos do best on the website. This script provides a fairly good way (I think?) to check photo performance, helping you make "data-driven" decisions for your photography portfolio.