





惯性聚合 高效追踪和阅读你感兴趣的博客、新闻、科技资讯
阅读原文 在惯性聚合中打开

推荐订阅源

Security Archives - TechRepublic
D
Docker
D
DataBreaches.Net
V
Vulnerabilities – Threatpost
P
Palo Alto Networks Blog
cs.CL updates on arXiv.org
CTFtime.org: upcoming CTF events
奇客Solidot–传递最新科技情报
奇客Solidot–传递最新科技情报
IT之家
IT之家
L
LINUX DO - 热门话题
T
The Blog of Author Tim Ferriss
雷峰网
雷峰网
Project Zero
Project Zero
T
Threatpost
D
Darknet – Hacking Tools, Hacker News & Cyber Security
宝玉的分享
宝玉的分享
Stack Overflow Blog
Stack Overflow Blog
Cyber Security Advisories - MS-ISAC
C
CXSECURITY Database RSS Feed - CXSecurity.com
S
Securelist
Cisco Talos Blog
Cisco Talos Blog
Google DeepMind News
Scott Helme
Scott Helme
The Cloudflare Blog
Know Your Adversary
Know Your Adversary
T
Tor Project blog
博客园_首页
人人都是产品经理
人人都是产品经理
博客园 - 叶小钗
Security Latest
Security Latest
Cyberwarzone
Cyberwarzone
S
Schneier on Security
T
The Exploit Database - CXSecurity.com
H
Help Net Security
Simon Willison's Weblog
阮一峰的网络日志
阮一峰的网络日志
C
Cyber Attacks, Cyber Crime and Cyber Security
P
Proofpoint News Feed
AWS News Blog
AWS News Blog
The GitHub Blog
The GitHub Blog
P
Proofpoint News Feed
T
Troy Hunt's Blog
量子位
G
GRAHAM CLULEY
O
OpenAI News
Engineering at Meta
Engineering at Meta
博客园 - Franky
SecWiki News
SecWiki News
F
Fortinet All Blogs
让小产品的独立变现更简单 - ezindie.com

Proxmox Support Forum

[SOLVED] - Github Auth for Mirrors-Kernel Repo? [Automation] Mass migration tool for MS Win11/Server Proxmox GUI hang - not response is it possible to reject or quarantine spam based on conditions I set ? The PVENode task list in PVE9 is partially obscured due to the terminal font being too large. About 100% error reporting due to pveproxy.service hooks Kubernetes overlay networking breaks when upgrading from PVE 9.1 to PVE 9.2.3 Zentraler Speicher No space left on device Combine datastore and direct file archival to tape Kernel panic VFS: Unable to mount root fs on unknown-block (0,0) sobald ein 7.x Kernel verwendet wird. How to migrate disk of a VM from one ZFS to another Windows Server 2025 fails to boot after PVE 9.2 / Linux 7.0 Kernel upgrade Cannot Install Proxmox on T610 Poweredge with H700 PERC card sdn Config. gateway not reachable How to safely change domain/FQDN? Welche Filterquote erreicht ihr? NFS Share status unknown on 2 of 5 nodes Can't connect to PVE9 consoles [solved] Can't connect to PVE9 consoles [solved] [SOLVED] - Use secondary network for PVE commands Created cluster, one node storage gone BUG: proxmox mail gateway FROM = null bypass spam filtering Moving existing PBS from VMWare workstation to PVE cluster Does eBGP SDN fabric support external peering? Bug: PDM 1.1 not recognizing valid license status Proxmox GUI hang - not response PVE crashes unexpectedly Proxmox Backup Server 4.2 released! Advice ceph-osd crashes with kernel 6.17.2-1-pve on Dell system [META] Links on Proxmox Forum Website Hardwarer oder Software RAID Joining a cluster with already created guests VM PDM missing backup jobs from PVE / Log retention Remove VM.Monitor from all users/roles, PVE 9.2 Proxmox Freezing (new instalation) 9.2.2 - Intel 12700T No Web gui and random connection reset by peer [SOLVED] - i40e module for X710 Intel NIC Dutch Proxmox Day 2026 How pools use the space Corosync initiiert Reboot trotz Verfügbarkeit der Systeme Opt-in Linux 7.0 Kernel for Proxmox VE 9 available After PVE 8to9 upgrade, unable to check guest fs freeze status Problem with MegaRAID SAS3508 controller proxmox-kernel-7.0.2-6-pve failing network service Auto sync guest time after rollback of VM snapshot with RAM/state Broadcom BCM57504 (100G) bnxt_en TX timeout and NIC reset on Proxmox 8.1.5 — while BCM57414 (25G) works fine on same host QEMU 11.0 available on pve-test and pve-no-subscription as of now 350 MPM Solventless Lamination Machine for High-Speed Flexible Packaging Making sense of NVMe zfs and SMART errors [SOLVED] - PVE loses network connection after kernel upgrade to proxmox-kernel-7.0.0-3-pve [SOLVED] - Remove or reset cluster configuration. Proxmox 8.4.1 Fresh Install BCM57416 10G Ethernet Adapter Not Recognized PDM 1.1.1 unable to add AD realm with anonymous search [TUTORIAL] - Developer Workstation (Proxmox-VE 9) with cinnamon (LMDE7) SDN zone shows "pending" on peer nodes after node reboot (9.2.x) Cluster not quorate - extending auth key lifetime! Proxmox not rebooting properly (SOLVED) Proxmox 9 Stuck on loading initial ramdisk With new HA-Disarm Feature is there a Documentation for NUT Setup on Clusters? Proxmox 8.3 Installation Issue on ProLiant DL380 Gen9 Cluster networking setup LXC System images unavailable [SOLVED] - Fix: NVIDIA Drivers Failing after upgrade to Proxmox 9.2.2 (Kernel 7.0.2-6-pve) / NovaCore Conflict Install NUT directly on Proxmox VE and control guests from here driver usb for windows 7 System startup error and no network: Failed to start ifupdown2-pre.service - Helper to synchronize boot up for ifupdown. PBS backup space grow up constantly Proxmox Datacenter Manager 1.1 released! IPv4 not available in newly created VM Recommended Setup for Offsite Proxmox Backups? Hetzner Storage Box & Remote PBS Challenges duplicate, please delete this passthrought an USB device "by ID" to CT PDM Installer Freezes at 66% Tried PDM for the first time (version 1.1) - had issues PDM 1.1 automated install Suche Server-Provider für Proxmox connecting sdn to edge firewall SDN, IPAM & DHCP Migrating from read-only file system Ubuntu 26.04 installation fails for unknown reason Status Unbekannt nach Cluster Join Installing Proxmox Backup Server on Mac Mini (Late 2012) kernel 7.0 performance issue with zfs pools PVE becomes unreachable via ethernet but OS is running [SOLVED] - New 9.2 install - can't find 7.0.2-6-pve , not all the time [SOLVED] - Backup and dedupe a VM with LUKS Gibt es mit PVE 2.x ggf. Änderungen bei der RAM-Nutzung, bzw. deren Anzeige bei VMs? I need help for setting up backup solution Way more NAGware, very little functionality, bugs galore Root squashing virtiofsd with --uid-map Intel ixgbe Driver Update Fail Passkey Login (not 2FA) Roblox VM detection - can be overcome? [TUTORIAL] - ZFS-Autosnaptshot inkl. Rollback und Daten direkt recovern (Windows/Linux) How to stop PVE Kernel upgrade [SOLVED] - very long waiting to log in to lxc debian 11 ssh [TUTORIAL] - Configuring Fusion-Io (SanDisk) ioDrive, ioDrive2, ioScale and ioScale2 cards with Proxmox Increase maximum USB devices in vm.conf
LXC - Omada memory leak?
invalid@exam · 2026-06-18 · via Proxmox Support Forum

Proxmox newbie here, although I have been using it for Home Assistant for a couple of years, but almost a set and forget aside from updates. I recently moved Omada from my Synology NAS to Proxmox on a newish Lenovo mini because the new Omada versions won't run on a Celeron CPU. The used memory just keeps rising to the point where it maxes out and the CPU then jumps from 1.5% to 100%. A reboot brings it back to earth and it starts again.

I've looked at several threads including:

Hi All

I have a LX container with Immich.

I see this error linked potentially to memory issue :

Code:

Jan 22 15:12:16 pve kernel: immich-api invoked oom-killer: gfp_mask=0xcc0(GFP_KERNEL), order=0, oom_score_adj=0
Jan 22 15:12:16 pve kernel: CPU: 2 UID: 100999 PID: 2133645 Comm: immich-api Tainted: P           O        6.17.4-2-pve #1 PREEMPT(voluntary)
Jan 22 15:12:16 pve kernel: Tainted: [P]=PROPRIETARY_MODULE, [O]=OOT_MODULE
Jan 22 15:12:16 pve kernel: Call Trace:
Jan 22 15:12:16 pve kernel:  <TASK>
Jan 22 15:12:16 pve kernel:  dump_stack_lvl+0x5f/0x90
Jan 22 15:12:16 pve kernel...

In line with that thread, I have increased the RAM and Swap File size, but the trend is still up.
The Proxmox overview :

CPU(s)​

16 x 13th Gen Intel(R) Core(TM) i5-13400T (1 Socket)​

Kernel Version​

Linux 6.17.13-2-pve (2026-03-13T08:06Z)​

Boot Mode​

EFI (Secure Boot)​

Manager Version​

pve-manager/9.1.6/71482d1833ded40​

The Omada version is 6.1.0.19.

My Container Summary:
CPU usage 1.08% of 2 CPU(s)
Memory usage 57.60% (2.30 GiB of 4.00 GiB)
SWAP usage 0.00% (0 B of 1.00 GiB)

Memory use started at about 1.96gb. The memory limit was set at 3gb and Swap 512mb. It would fill up in about 36 hours and the swap was running at about 15% (not 0% like now)

In the past ten minutes the top -co%MEM result has gone from
MiB Mem : 4096.0 total, 1208.4 free, 2339.9 used, 547.8 buff/cache
MiB Swap: 1024.0 total, 1024.0 free, 0.0 used. 1756.1 avail Mem
to
MiB Mem : 4096.0 total, 1199.7 free, 2344.3 used, 552.1 buff/cache
MiB Swap: 1024.0 total, 1024.0 free, 0.0 used. 1751.7 avail Mem

At first I thought it was the issue with the Intel NIC offloading and tried the offloading fix but that did not help the memory issue. I have PBS running in a VM alongside the Omada container and it is fine.

I am assuming this is an Omada issue, not a Proxmox issue, but grateful for any help. Otherwise it's a reboot every two days.
wbk

Renowned Member

Hi Other7544,

For the sake of context, what is Omada?

Seeing the memory usage comes as a surprise, I guess it was running with a low limit on the Synology? Did it run virtualized there, or bare metal (I have 0 experience with Synology...)

I'd say the i5 is quite powerful. Could it be that the application was always held back by the limitations of the Celeron, thereby not claiming more RAM? Is it worth a try to allow much more RAM for the container, and see whether it plateaus at a sustainable level?

Omada is a software controller for TP-Link's range of Omada switches, router, APs etc.

It was running in Synology's version of Docker. It was v5 which uses an older version of the MongDB. Omada v6 needs a new version of MongoDB and that will not run in a Celeron, hence the move to the i5. The v5 version was running quite happily on a small allocation of RAM and I thought was quite low weight. v6 is a fairly big update. It ran without issue in the Synology "Container Manager".

BTW - since my original post memory use has jumped to 71%, including a big hop up 90 minutes ago. I can't see anything the logs to show why.

SIgh.......

- thanks for those links. I had not seen them. I might try an earlier version if I can work out how to do that.

I'd been hoping that Docker was immune but not so.

Please share the full top -co%MEM and docker stats output from inside the CT. You see what was asked in the linked thread. Provide the same here.

Last edited:

I think the guilty party is Omada as @Neobin has shown in the links. A daily reboot is probably the answer until they fix Omada.

I don't get anything from docker stats and I can't see where it was asked for in the original link.

top -co%MEM
Full Result (There's been a reboot since the original truncated results - it has jumped):

top - 10:02:26 up 14:15, 1 user, load average: 0.16, 0.17, 0.09
Tasks: 21 total, 1 running, 20 sleeping, 0 stopped, 0 zombie
%Cpu(s): 0.7 us, 0.7 sy, 0.0 ni, 98.5 id, 0.2 wa, 0.0 hi, 0.0 si, 0.0 st
MiB Mem : 4096.0 total, 340.2 free, 3087.3 used, 668.6 buff/cache
MiB Swap: 1024.0 total, 1024.0 free, 0.0 used. 1008.7 avail Mem

PID USER PR NI VIRT RES SHR S %CPU %MEM TIME+ COMMAND
289 omada 20 0 14.4g 2.7g 24928 S 1.3 66.9 11:28.42 omada -cwd /opt/tplink/EAPControl+
445 omada 20 0 3736840 337064 92996 S 0.7 8.0 5:09.70 /opt/tplink/EAPController/bin/mon+
154 mongodb 20 0 2670788 177692 87560 S 0.3 4.2 4:35.53 /usr/bin/mongod --config /etc/mon+
1 root 20 0 167624 11900 8892 S 0.0 0.3 0:00.22 /sbin/init
52 root 20 0 33016 10836 9776 S 0.0 0.3 0:00.09 /lib/systemd/systemd-journald
152 root 20 0 15460 9164 7832 S 0.0 0.2 0:00.00 sshd: /usr/sbin/sshd -D [listener+
104 systemd+ 20 0 17924 8788 7636 S 0.0 0.2 0:00.08 /lib/systemd/systemd-networkd
96 root 20 0 16604 7640 6640 S 0.0 0.2 0:00.08 /lib/systemd/systemd-logind
7876 postfix 20 0 43064 7044 6380 S 0.0 0.2 0:00.00 pickup -l -t unix -u -c
380 postfix 20 0 43108 6992 6316 S 0.0 0.2 0:00.02 qmgr -l -t unix -u
8300 root 20 0 11564 5284 3216 R 0.0 0.1 0:00.01 top -co%MEM
559 root 20 0 8012 4804 3476 S 0.0 0.1 0:00.00 -bash
92 message+ 20 0 9108 4788 4216 S 0.0 0.1 0:00.00 /usr/bin/dbus-daemon --system --a+
376 root 20 0 42680 4684 4052 S 0.0 0.1 0:00.12 /usr/lib/postfix/sbin/master -w
150 root 20 0 9140 4408 3888 S 0.0 0.1 0:00.00 /bin/login -f
93 root 20 0 5884 3564 2724 S 0.0 0.1 0:00.00 dhclient -4 -v -i -pf /run/dhclie+
91 root 20 0 6624 2660 2412 S 0.0 0.1 0:00.06 /usr/sbin/cron -f
149 root 20 0 5512 2072 1944 S 0.0 0.0 0:00.00 /sbin/agetty -o -p -- \u --noclea+

Last edited:

Please use code blocks. This is unreadable. I just assumed you use docker since it was mentioned above. Since you're not using that image please share the start parameters.

Last edited:

Sorry - formatting fixed. On start parameters I don't know how to get/display that unless it is these:
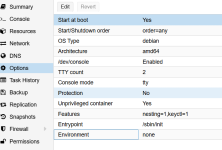
arch: amd64
cores: 2
hostname: omada
memory: 4096
net0: name=eth0,bridge=vmbr0,hwaddr=BC:24:11:56:F4:19,ip=dhcp,type=veth
onboot: 1
ostype: debian
rootfs: local-lvm:vm-101-disk-0,size=8G
swap: 512
tags: community-script;controller;tp-link
timezone: Australia/Brisbane
unprivileged: 1

[ATTACH type="full" width="523px" size="709x480"]96968[/ATTACH]

  • 1775265469389.png

    1775265469389.png

    56.2 KB · Views: 1

In case anyone's curious about those parameters

Bash:

# pgrep -af omada
6505 omada -cwd /opt/tplink/EAPController/lib -pidfile /var/run/omada.pid -home /usr/lib/jvm/temurin-21-jdk-amd64/ -cp /usr/share/java/commons-daemon.jar:/opt/tplink/EAPController/lib/*:/opt/tplink/EAPController/properties -outfile /opt/tplink/EAPController/logs/startup.log -errfile /opt/tplink/EAPController/logs/startup.log -user omada -procname omada -showversion -server -XX:MaxHeapFreeRatio=60 -XX:MinHeapFreeRatio=30 -XX:+HeapDumpOnOutOfMemoryError -XX:HeapDumpPath=/opt/tplink/EAPController/logs/java_heapdump.hprof -Djava.awt.headless=true -Djdk.lang.Process.launchMechanism=vfork com.tplink.smb.omada.starter.OmadaLinuxMain start

I tried to reproduce this (I hate working with these scripts) but if there's a leak it's not very much. The helper script doesn't appear to modify the upstream code so you probably have to wait for TP Link to fix this or restore backup of a older version or manually install it.

In case anyone's curious about those parameters

Bash:

# pgrep -af omada
6505 omada -cwd /opt/tplink/EAPController/lib -pidfile /var/run/omada.pid -home /usr/lib/jvm/temurin-21-jdk-amd64/ -cp /usr/share/java/commons-daemon.jar:/opt/tplink/EAPController/lib/*:/opt/tplink/EAPController/properties -outfile /opt/tplink/EAPController/logs/startup.log -errfile /opt/tplink/EAPController/logs/startup.log -user omada -procname omada -showversion -server -XX:MaxHeapFreeRatio=60 -XX:MinHeapFreeRatio=30 -XX:+HeapDumpOnOutOfMemoryError -XX:HeapDumpPath=/opt/tplink/EAPController/logs/java_heapdump.hprof -Djava.awt.headless=true -Djdk.lang.Process.launchMechanism=vfork com.tplink.smb.omada.starter.OmadaLinuxMain start

It appears to be claiming anything up to 0.25gb every two hours, so I have allocated more memory for headroom. But I've also set up a crontab to reboot the container every 24 hours, so that is a band-aid until TP-Link comes up with a solution. It has been raised with them and they have acknowledged it. I'll just hurry up and wait.

The memory growth is almost certainly the JVM not respecting the LXC container's memory limit. By default, Java allocates its heap based on what it sees as the system's total RAM. In an LXC container, older JVM versions (and even some newer ones depending on cgroup configuration) see the host's full memory rather than the container's allocated amount, so they happily use far more than the container allows.

Temurin 21 should support cgroup v2 memory detection, but in Proxmox LXC containers this can still be unreliable depending on the cgroup delegation setup. The safest fix is to explicitly cap the JVM heap.

Edit /opt/tplink/EAPController/jre/bin/java.conf (or wherever the Omada startup parameters are defined) and add:

This caps the heap at 512MB and starts at 256MB. Adjust based on your network size, for a small home network with under 20 devices 512MB is plenty.

If that file does not exist or is not read, you can modify the systemd service or the startup wrapper directly. For the Docker/LXC based Omada installs, the environment variable JAVA_OPTS works:

Code:

export JAVA_OPTS="-Xmx512m -Xms256m"

Then restart the Omada service. The memory usage should now stay within the cap rather than climbing indefinitely.

Also worth checking: MongoDB (which Omada uses for its database) can be equally greedy with its WiredTiger cache. If you see mongod consuming memory alongside Java, add

Code:

storage.wiredTiger.engineConfig.cacheSizeGB: 0.25

to the MongoDB config.

Thank you @RianKellyIT

Option 1 is no go, so I'll try the environment variable JAVA_OPTS path. I assume that goes into the LXC Console, not the node Shell?

Interestingly I noticed there was an Omada update to v6.2.x. This came out around the time the memory issues were being reported to TP-Link so I don't believe they have applied a fix yet. However after the upgrade RAM growth has slowed to about 0.1gb in 24 hours, rather than 0.1gb every hour or so. I will monitor the system for another day before trying your fix.

Latest version of Omada seems to have fixed the problem. It now maxes out at 3Gb. The swap file doesn't like being constrained to 500mb, so I've upped that to 768mb and it's loitering around 310mb.

I think I will declare victory.... or at least - resolved.