
January 14, 2026
Over a decade ago I got into FIRE - Financial Independence, Retire Early. I'm currently in the position where I'm closer to the end of a FIRE journey than the start, so here's a big dump of knowledge on various finance topics relevant to me. This post exists primarily so I can get it out of my head and stop thinking about it.
Please note - this is not financial advice, just the ramblings of a dork who reads too much. My circumstances are different to yours. My risk appetite is different to yours. My goals are different to yours. If you'd like to chat about any of the things I've mentioned in this post, get in touch.
Is the cash I have today enough to live off for the rest of my life without having to go back to work? If it's not enough, how much more do I need?
How much do I need per year to have a quality of life I expect? Bills, food, entertainment, medical costs, house maintenance, etc.
I've had an Excel spreadsheet for decades that outlines everything I regularly spend money on. It's accurate and I've managed to avoid "lifestyle creep" despite earning more money, so I don't see why that wouldn't continue to be relatively stable in the future. If I have my budgeted expenses plus 25% in my bank account at the start of the year I'm satisfied.
There's various withdrawal/drawdown strategies around, FiCalc has explanations of the popular ones along with a handy calculator. I personally like the constant dollar approach, adjusted for inflation.
I'm not going to waste time explaining inflation - the RBA does a good job of that along with how they measure it - but inflation for my purposes means that I need more money each year because the things I need to buy go up in price. I can't assume what costs $50,000 today will stil cost $50,000 in 10, 20 or 30 years time.
There's a few ways to measure inflation but the two main figures are the Consumer Price Index and the Selected Living Cost Index.
Other notes on inflation:
Even if I'm not working I'm taxed on the income and profits my investments make. The tax I pay changes with how that income is made and who in my family it is assigned to.
If I receive income via selling an asset (e.g: shares) and I've held it for over 12 months, only 50% of the gain is counted as income thanks to the capital gains discount - e.g: I make a profit (aka a capital gain, the difference between the purchase and sale price minus expenses) of $50,000 selling some units in a managed fund that I've owned for at least 12 months, my taxable income is $25,000.
If I get this income via distributions from an asset or bank/term deposit interest, there is no discount. So if I made $35,000 in interest from a term deposit or distributions from units in an ETF or dividends from owning shares, I'd pay tax on the full $35,000.
If the distributions (aka dividends) are "franked". The company paying the dividend has already paid tax on those profits they've giving you so you don't pay tax on that money again. This Rask Media article explains the concept of franking credits better than I ever could.
The "total return" of an investment after tax is wildly different depending on how that income was generated. Take $50,000 of income for example:
Another way to pay less tax is to share the income between multiple people. The difference in tax when one person pays it versus four people paying it is huge.
Let's say I have $1,000,000 and it generates $100,000 in income, I pay $22,788 in tax - total return of $77,212. Four people have $250,000 each and each person makes $25,000 of taxable income, they only pay $388 of tax each ($1,552 all up), for a total return of $98,448. That's $21,236 extra in our pockets. Compound that over a decade and you're saving huge amounts of money by spreading the income out over multiple people.
Huge shout-out to Pay Calculator. It makes working out tax super easy.
Some other interesting tax things:
How long these perks will last, I don't know.
There's three ways to spread income in order to pay less tax - give each person a share of the money that they own directly, use a joint account or set up a trust.
Trusts can be complicated but the core principle is simple. All the money goes into the trust. You open an account in the name of the trust and it makes (or loses) money and according to the rules of the trust you distribute the income/losses to the beneficiaries of the trust in a way that's most tax advantageous to them. For the computer nerds, I like to think of it as the virtual machine of finance. For more details on trusts, these resources helped me understand them:
A joint account is much simpler. Funds like Betashares and brokerages like Selfwealth have 3-way joint accounts. Each person has their own bank account for spending and so on, but investments can be kept in a 3-way joint account and any capital gains when selling those investments, or distributions the investment earns, are split evenly 3-ways when it comes to declaring it on your individual tax returns.
There's some great articles on Passive Investing Australia discouraging a focus on dividends:
This example of dividend investing versus total return investing highlights the difference:
$1,000,000 invested over 12 months in HVST, a Betashares ETF designed to "harvest" franked dividends with the intent of income:
$1,000,000 invested over the same 12 months in HQLT, another Betashares ETF focused on "quality" non-Australian businesses so not as "risky" as full growth like DHHF or dragged down by bonds like DBBF/DGGF/DZZF
The risk profile of HVST and HQLT is pretty similar (they're equities in businesses) but you get an extra $19,000 by not chasing dividends and selling some units instead of relying on distributions, despite the franking credits. The gap is even bigger if you used DHHF instead of HQLT (but with more volatility/risk involved).
That's not to say a dividend income strategy is bad or can't work - lots of people do it and are happy with it - but it relies on tax conditions to be beneficial so keep that in mind.
Despite my research being centered around retiring early, superannuation still has a role to play long term because of the tax benefits. Between my wife and I there's a few hundred thousand bucks compounding until we are 60. Here's some good basic info on superannuation I found:
As for where to put my super prior to turning 60 - HostPlus's Indexed Growth fund seems to be the lowest fee superannuation fund in Australia. Just $78/yr regardless of balance, then 0.02% of your balance each year. It aims to achieve more than 2.5%pa over CPI over 20 years (so if CPI is 3%, it should return 5.5%) and is basically a bunch of Aussie & international shares and 10% bonds.
Adding to super is also useful when on a low income in early retirement mode due to that Low Income Superannuation Tax Offset (LISTO) I mentioned in the tax section. As long as I do the following each year:
The government will give me $810 a year until I'm 71 years old. That $810 a year, compounded for 30 years at 6% is $64,000. If I do it, my wife does and my sister does it, that's $192,000 extra for us to live off when we are 71. Inflation in 30 years will erode a lot of it and there's no guarantee LISTO will exist in the future, but hey, I'll take it while it's there.
I started off with a simple spreadsheet:
With these numbers I will run out of money by the time I'm 74. If I increase the balance to $2.3m I'll run out when I'm 80. If I increase it to $2,572,500 I'll have $814 left when I'm 85. I can fiddle around with more numbers - lower the withdraw, increase the growth, lower inflation, add my super and pension based off inflation, add the sale of a property and so on.
The problem with this type of forecasting is that my balance won't grow at 4% or 2% or 6% every year. Sometimes it'll go up by 10%, sometimes it'll decrease by 20%, sometimes it'll decrease for multiple years in a row. Same with inflation. It'll go up and down at various rates, not a steady 3%.
A popular way to get an approximate idea of the odds of success is a Monte Carlo simulation, which has a fascinating history in weapons development and the first digital computers.
Instead of fixed figures for inflation and investment returns a Monte Carlo simulation uses a mean and standard deviation for inflation and investment returns and does it tens of thousands of times to try and predict the various scenarios that could happen to your investments and inflation.
Sounds complicated by you can do this yourself following these videos by Ronald Moy, a professor at the Tobin College of Business of St. John's University in New York. Old mate knows what he's doing in Excel better than me!
This simulation is not perfect and there's plenty of arguments around use a Monte Carlo simulation:
There's methods of improving Monte Carlo simulations to be more realistic, like bootstrapping or geometric means or whatever cool and trendy statistical techniques quant nerds cook up - but they're all simulations. What they're useful for is to build confidence in a plan. If you do all this modelling and they all say there's 50% or 60% or 45% chance of $0 after 40 years then I'm fairly confident that plan is a dud. If multiple simulation types say it's 90%, 95% or 99% successful, then I'm onto something that justifies further investigation.
Another alternative to Monte Carlo simulations are historical simulations, aka backtesting. That's where you take decades of financial history and try to pretend if similar situations happen, what would it be like if that trend was applied to the current financial situation. For example - a 40 year period between 1965-2005, or 1970-2010, or 1930-1970 and so on. There's an interesting discussion comparing Monte Carlo sims and backtesting on the Rational Reminder forums.Vanguard's Principles for Investing Success was the most useful thing I've read on the topic to help guide me on how I should invest my cash (aka allocating assets). It boils down to the following:
Understanding these topics then leads to the types of assets to invest in, which in turn asks the question, how risky do you want that investment to be? The higher the risk, the higher the reward, but also the higher the chance of losing.
The CFA's Investment Risk Profiling guide helped me really understand how to assess my tolerance for risk with my money:
There's multiple questionaires out there to help gauge your risk tolerance:
I went through a couple of those and they more or less told me the same thing - I'm at the middle/just below the middle of risk tolerance. So that means I should put the majority of my money into less risky investments, but not all of it as I need some growth to see me through 40-50 years.
This is the stuff you put your money into in the hopes you get more money back than you put in - equities, bonds, cash, commodities, real estate and so on. Lots of literature on this topic so not much point in me repeating it:
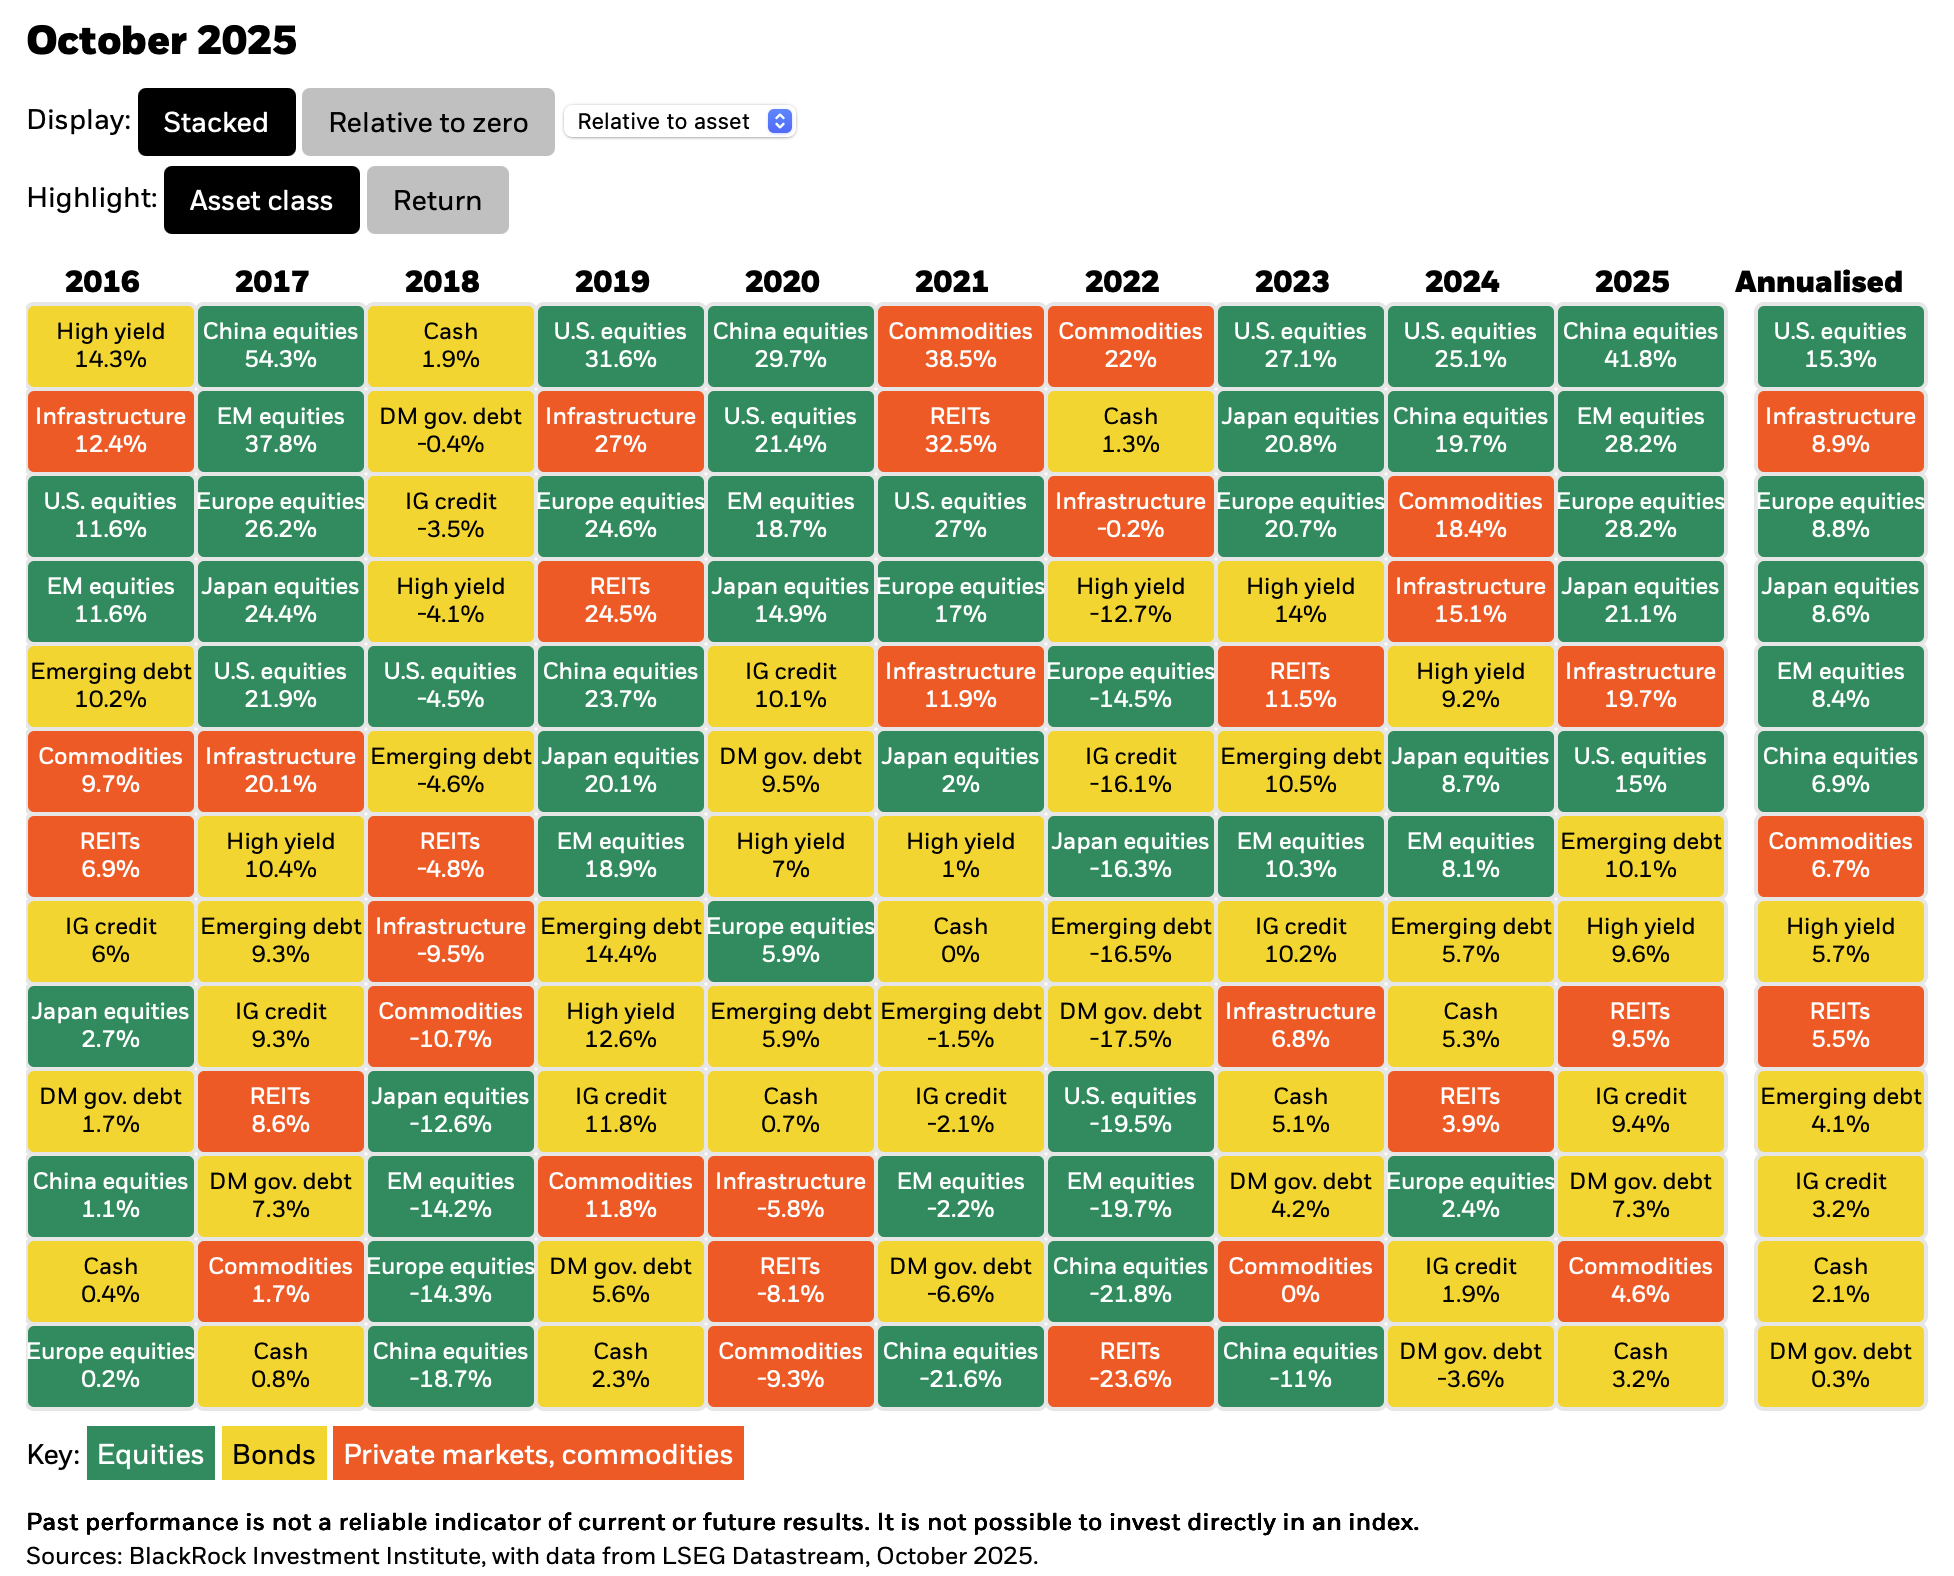
Blackrock's "asset return map" shows various asset classes and the returns they've made over the last decade.
Vanguard has an excellent chart showing the returns of $10,000 from 1995 to 2025 of various asset classes.
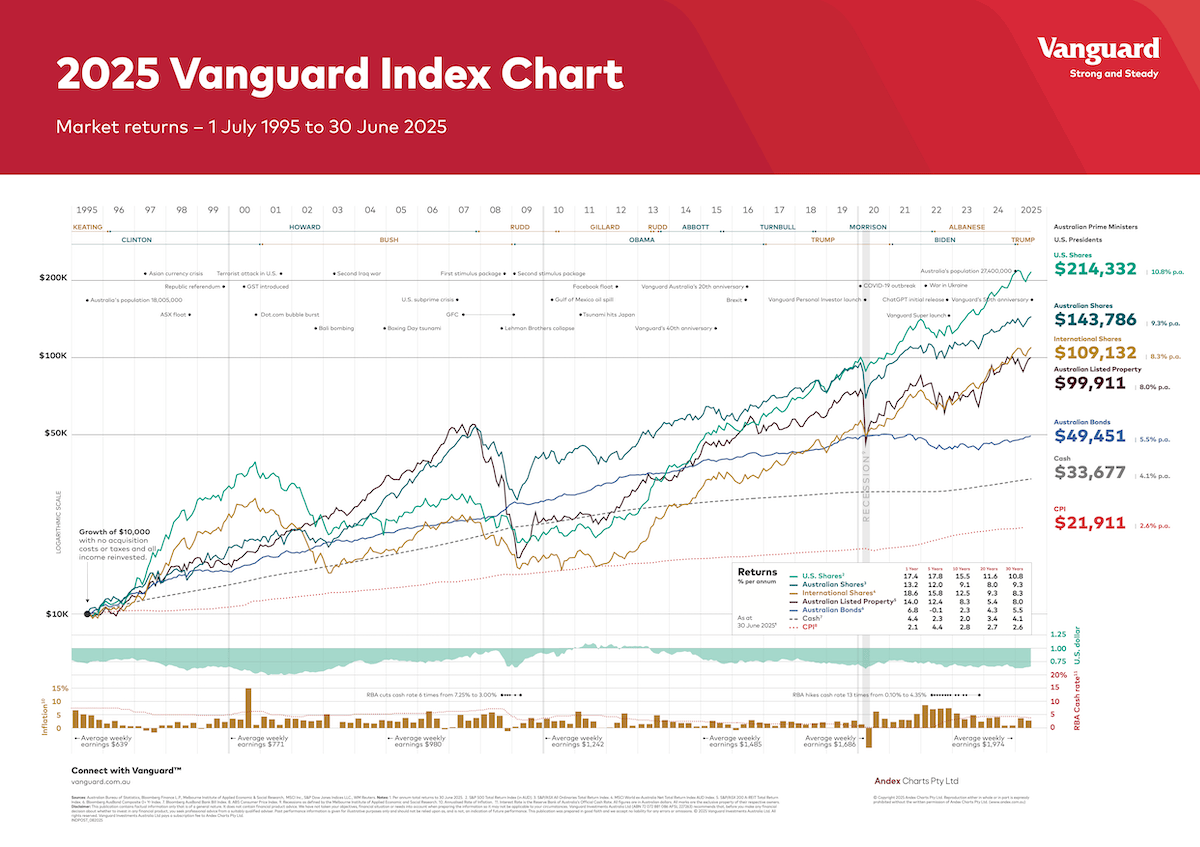
What we can learn from Blackrock's and Vanguard's charts is not how much money we can make, as what happened in the past has already happened and we don't know what will happen in the future - but how the different asset classes interact with each other.
Vanguard's chart shows that historically, when shares went down bonds didn't - a concept that Vanguard has a great article explaining - except that in 2022 and 2023 where equities and bonds went down simultaneously.
Russell Investments explores this change in the long held belief of bonds acting as a shock absorber when equities take a shit. Their assessment is to add other assets in the mix that are less prone to inflation - commodities (oil, metal, etc), real estate, infrastructure and gold, which kinda explains why the price of gold has gone to the moon lately.
On the other hand, the CFA Institute elaborates more on these "real assets" and that "broad-market, real-asset index data suggests that real assets failed to hedge the 2021 to 2023 inflation episode". Vanguard argues that the 60/40 portfolio is still solid too.
Other assets can be stuff like cryptocurrency (ugh, but it's a thing), art, classic cars, physical property, gold bars, a sneaker collection, old computers, whatever - personally I prefer using a fund to hold the assets so I don't have to manage them, but there's nothing wrong with buying the assets yourself and saving the management fee if you think you can do it better or cheaper.
Instead of buying all these shares or gold or bonds or property or even term deposits directly, there funds that you can buy portions of that hold and manage those things for you. Again, there's lots of good documents about ETFs:
The ASX has a list of all the ETFs currently available and updates it every month. You can search the internet for the name of the fund and get loads of information about each one. I like to read the factsheets to get a sense of what the fund is about. For example, OZBD, Betashare's Australian Composite Bond ETF.
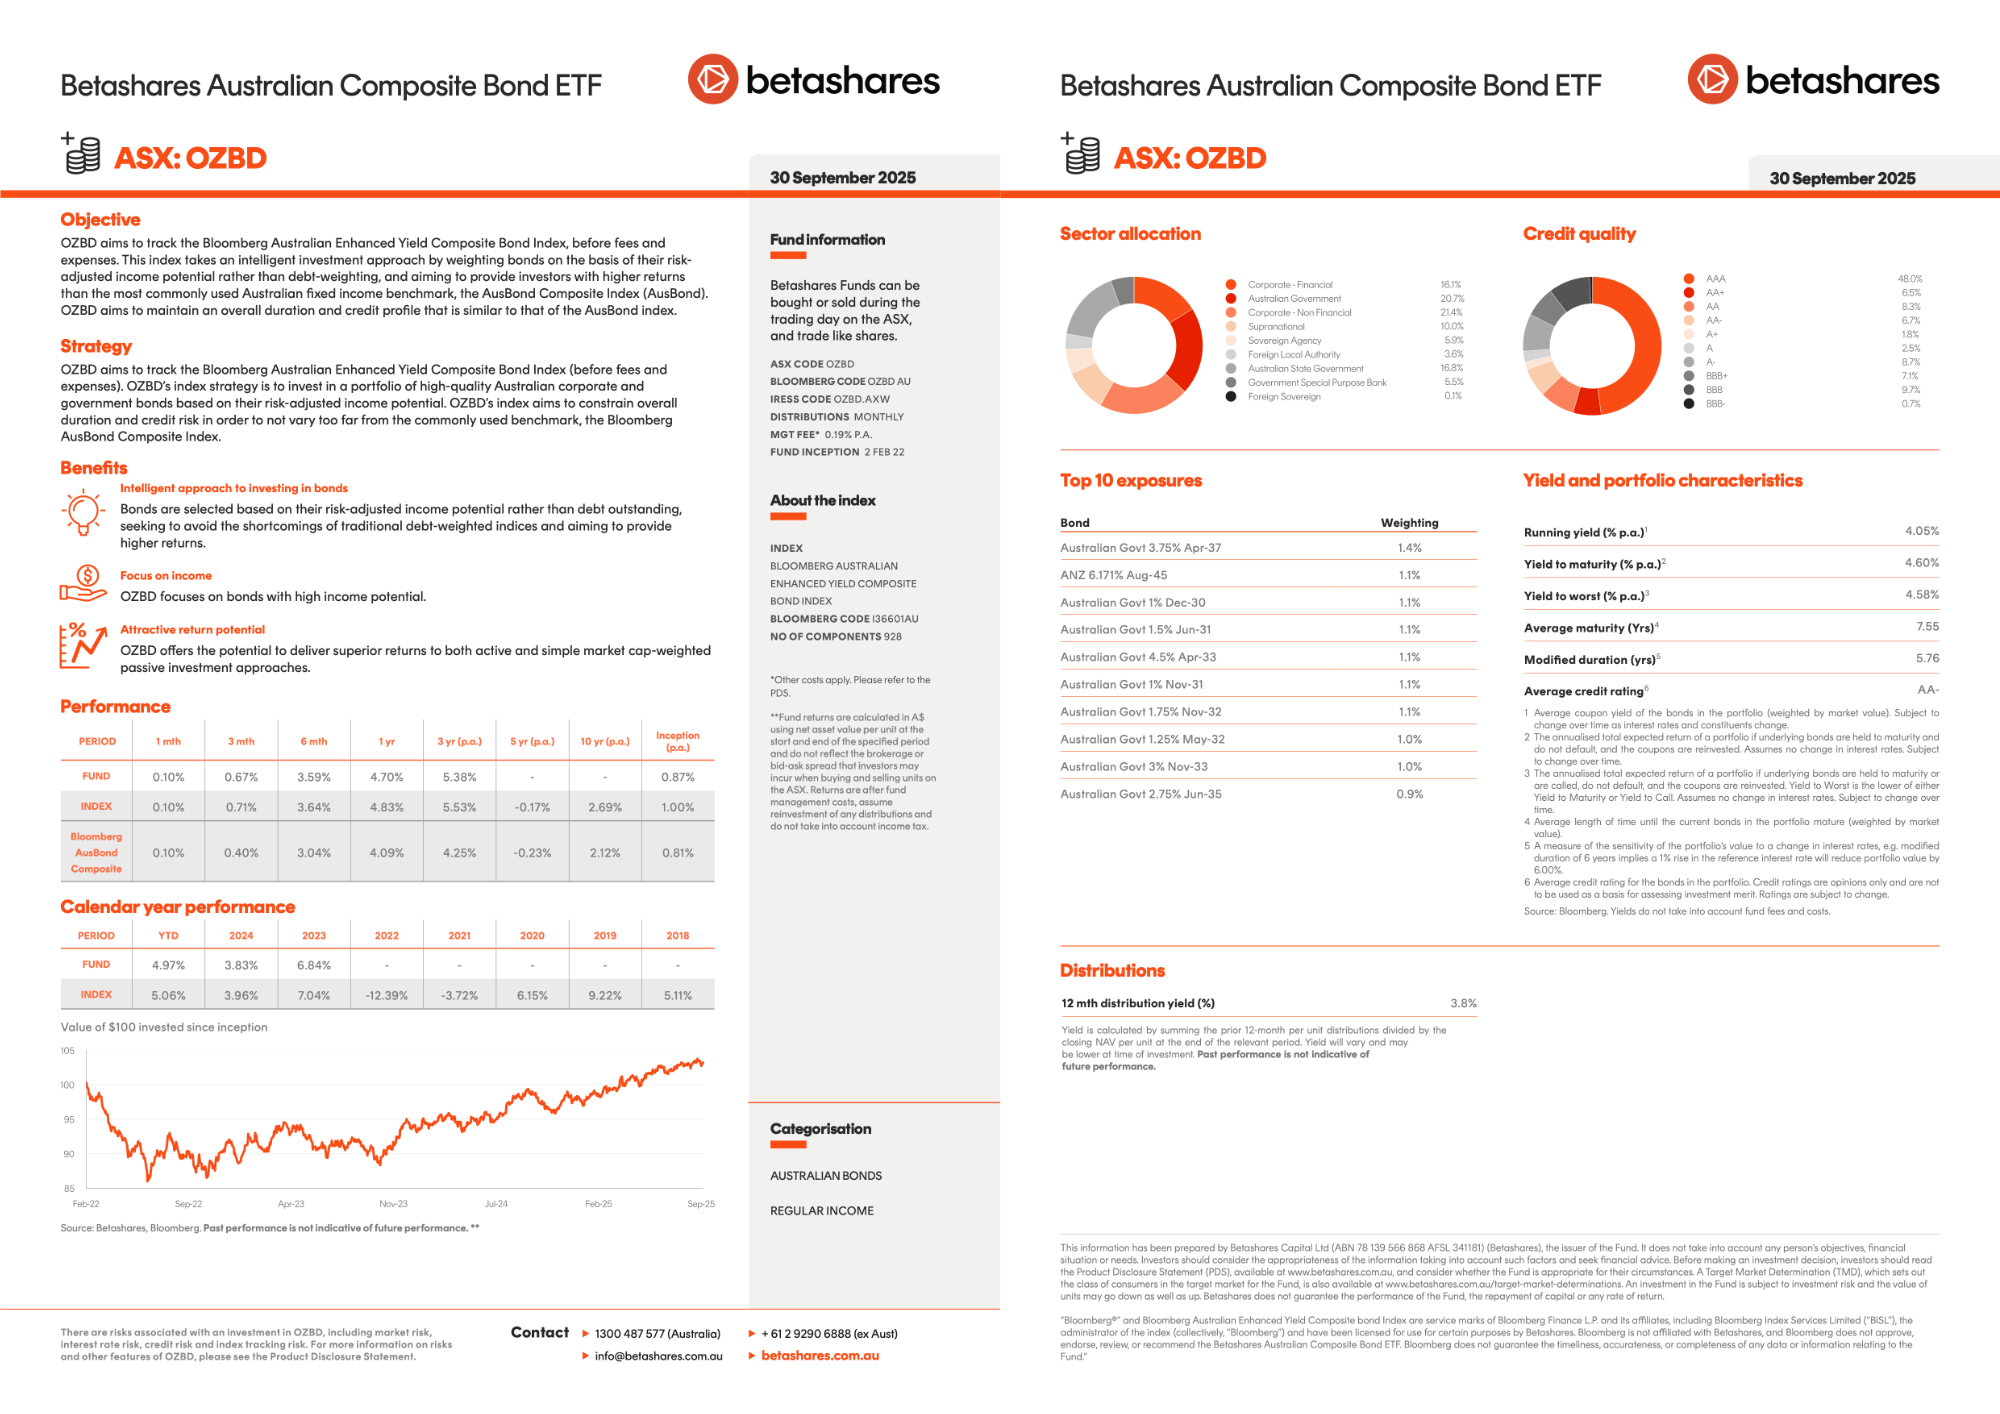
After reading the factsheet I know that OZBD:
The Product Disclosure Statement and Target Market Determination are also an important thing to read before throwing cash at it. The PDS outlines the rules of the fund (i.e: what Betashares does with your money) and the TMD tells you what Betashares thinks of the risk profile of the fund.
The funds are in trusts, Betashares, Vanguard, Blackrock, etc. don't own the money you give them, they just look after it and do with the money what they say in the PDS they will. Betashares explains what happens if they go bust:"ETFs have the same legal structure as a traditional managed fund, and this means that the assets that form the underlying ETF are held on trust for the benefit of investors, and do not form part of the assets of the product issuer. Normally, to ensure additional separation, assets will normally be held by an independent third party known as a ‘custodian’, which has been appointed by the ETF issuer, but is not part of the same organisation."
The ASX has heaps of good information about investing in general. I learned a lot going through their online courses, particularly about buying and selling Australian government bonds. Handy if I ever want to own the bond directly instead of getting it through an ETF.
You don't need to buy ETFs, many of the bigger providers let you buy them directly. I'm a fan of Betashares Direct. Super easy to use. Vanguard also has their own platform for directly buying into their funds without having to go via a broker.
Austraila has an obsession with property and for good reason - it's made a lot of dumb people very rich, so why not me? I won't explain the entire thing because Alan Kohler has written it already.
I haven't looked too much into investment property as an asset class because I don't want to be a landlord (scum), but it's a solid investment for two reasons:
Leverage - you can buy a house worth $600,000 with only $30,000 cash and a loan for the rest. Amazing amount of leverage that you just can't get with an ETF, despite geared ETFs being popular now. You can then use the equity in the property to buy more property and/or do debt recycling.
Tax benefits - the interest on the loan is tax deductible. What you spend on maintenance is tax deductible. If you move in to the house and sell it after 12 months, you pay no tax on the profits. Negative gearing is also a thing.
If I was in my 30s and had a high income, but not many assets, I would absolutely look deeply into investment property as an asset class alongside equities.
My portfolio has three aims:
Portfolio Charts is amazing for testing asset mixes. It has 20 popular portfolios, explains each in detail and lets you create a plethora of charts so you can compare them. It's overwhelming at first and very US-centric, but after playing around with it for a few weeks it's well worth the US$9/m. Just in the last week they added a new feature where you can add your own datasets - very useful for Australians.

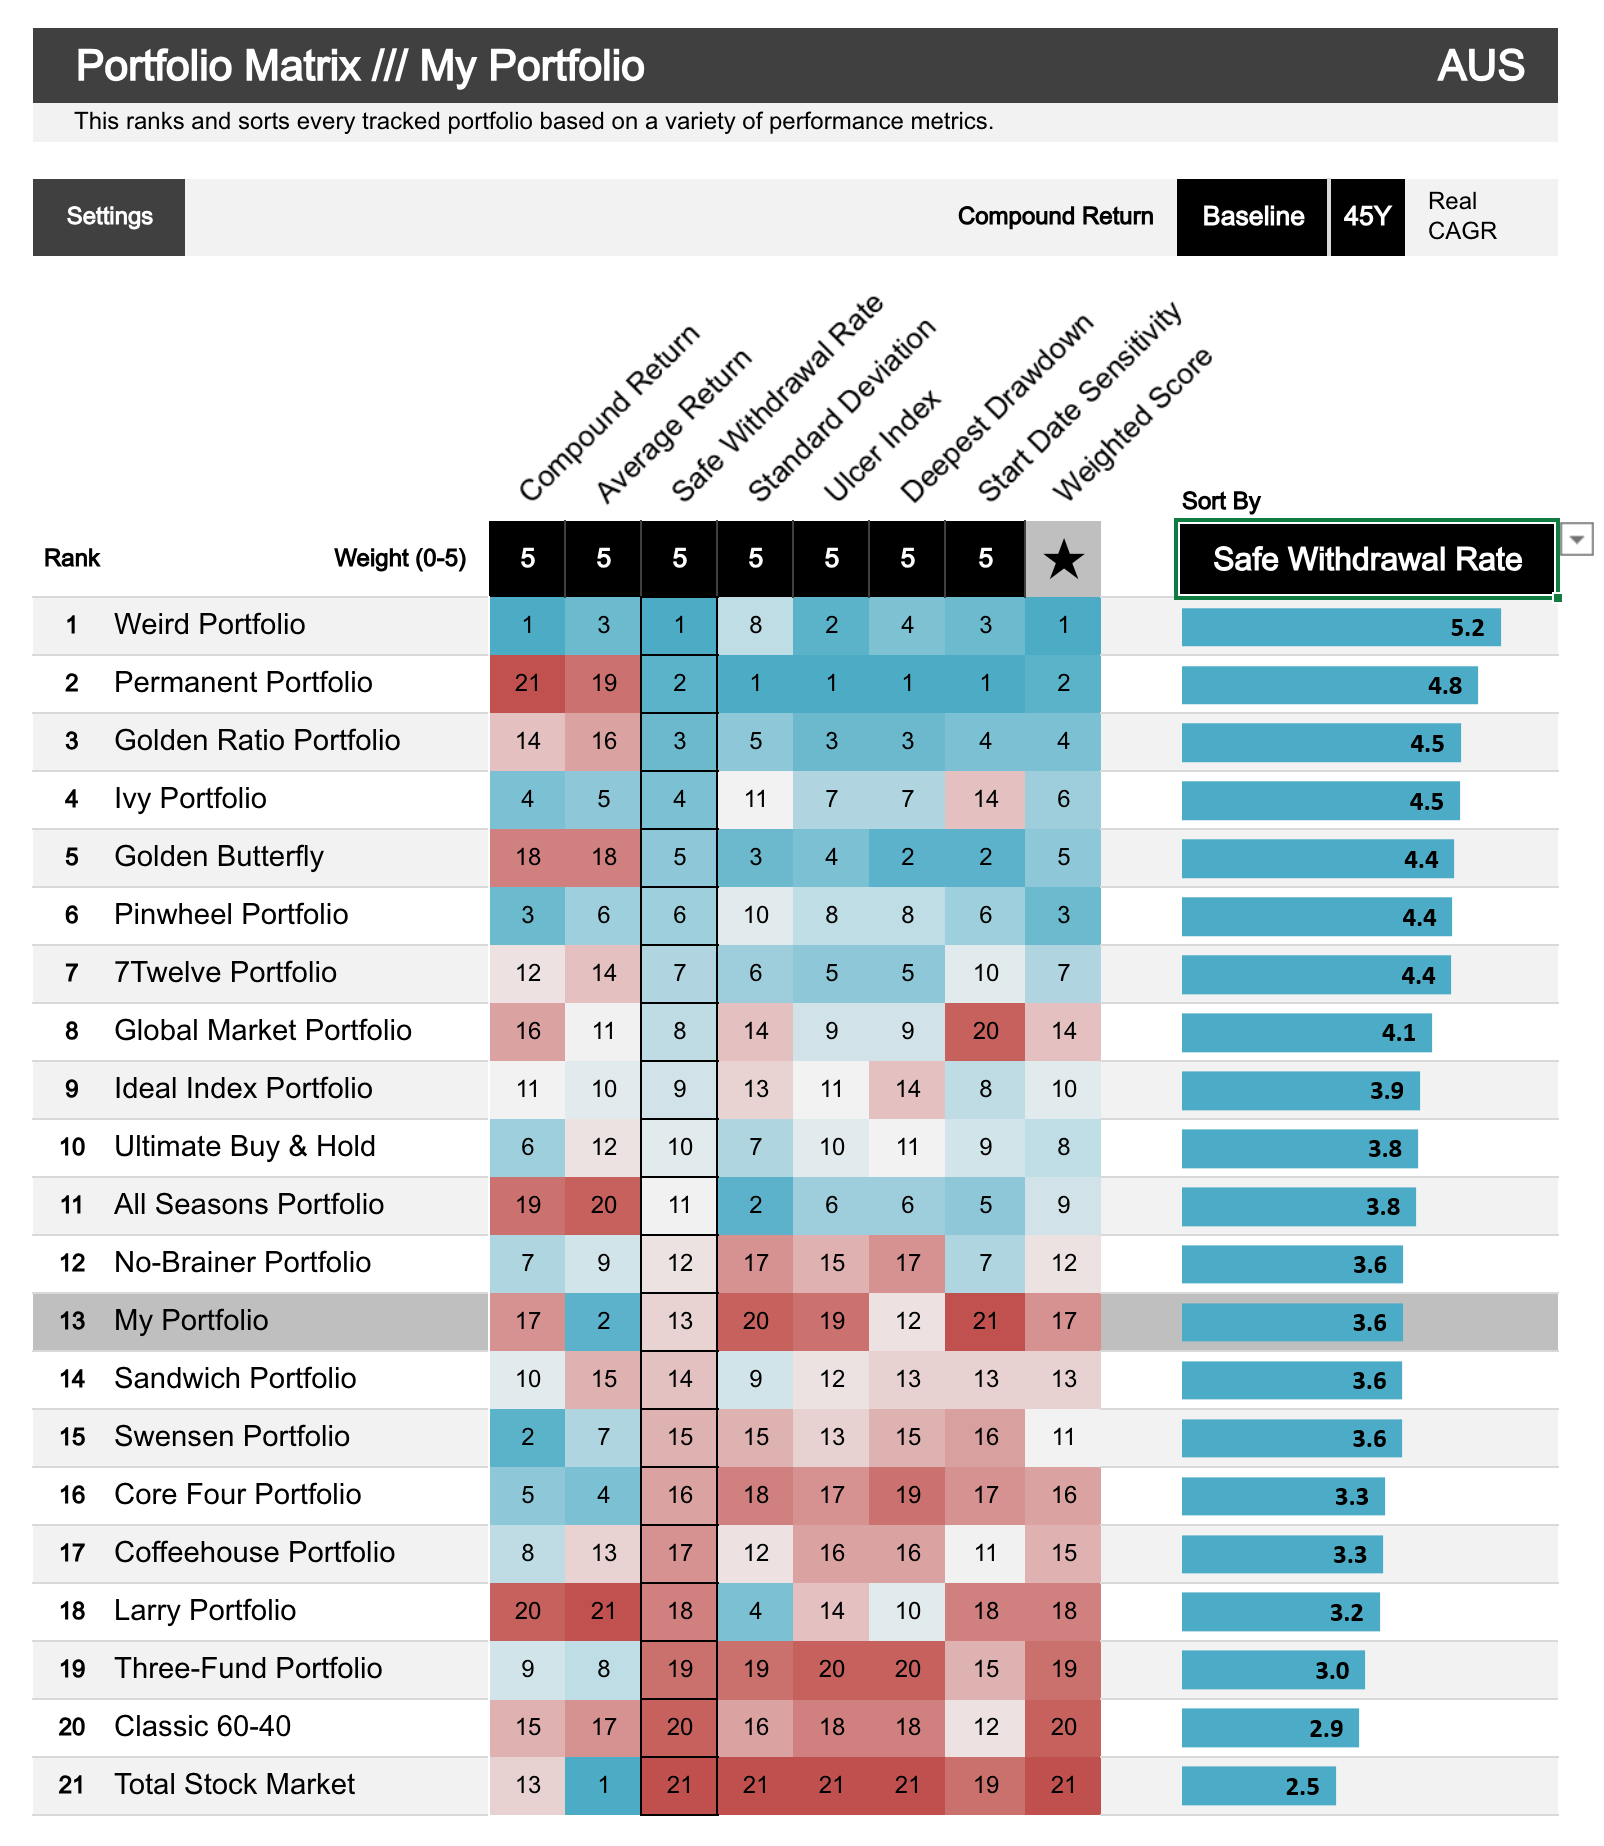
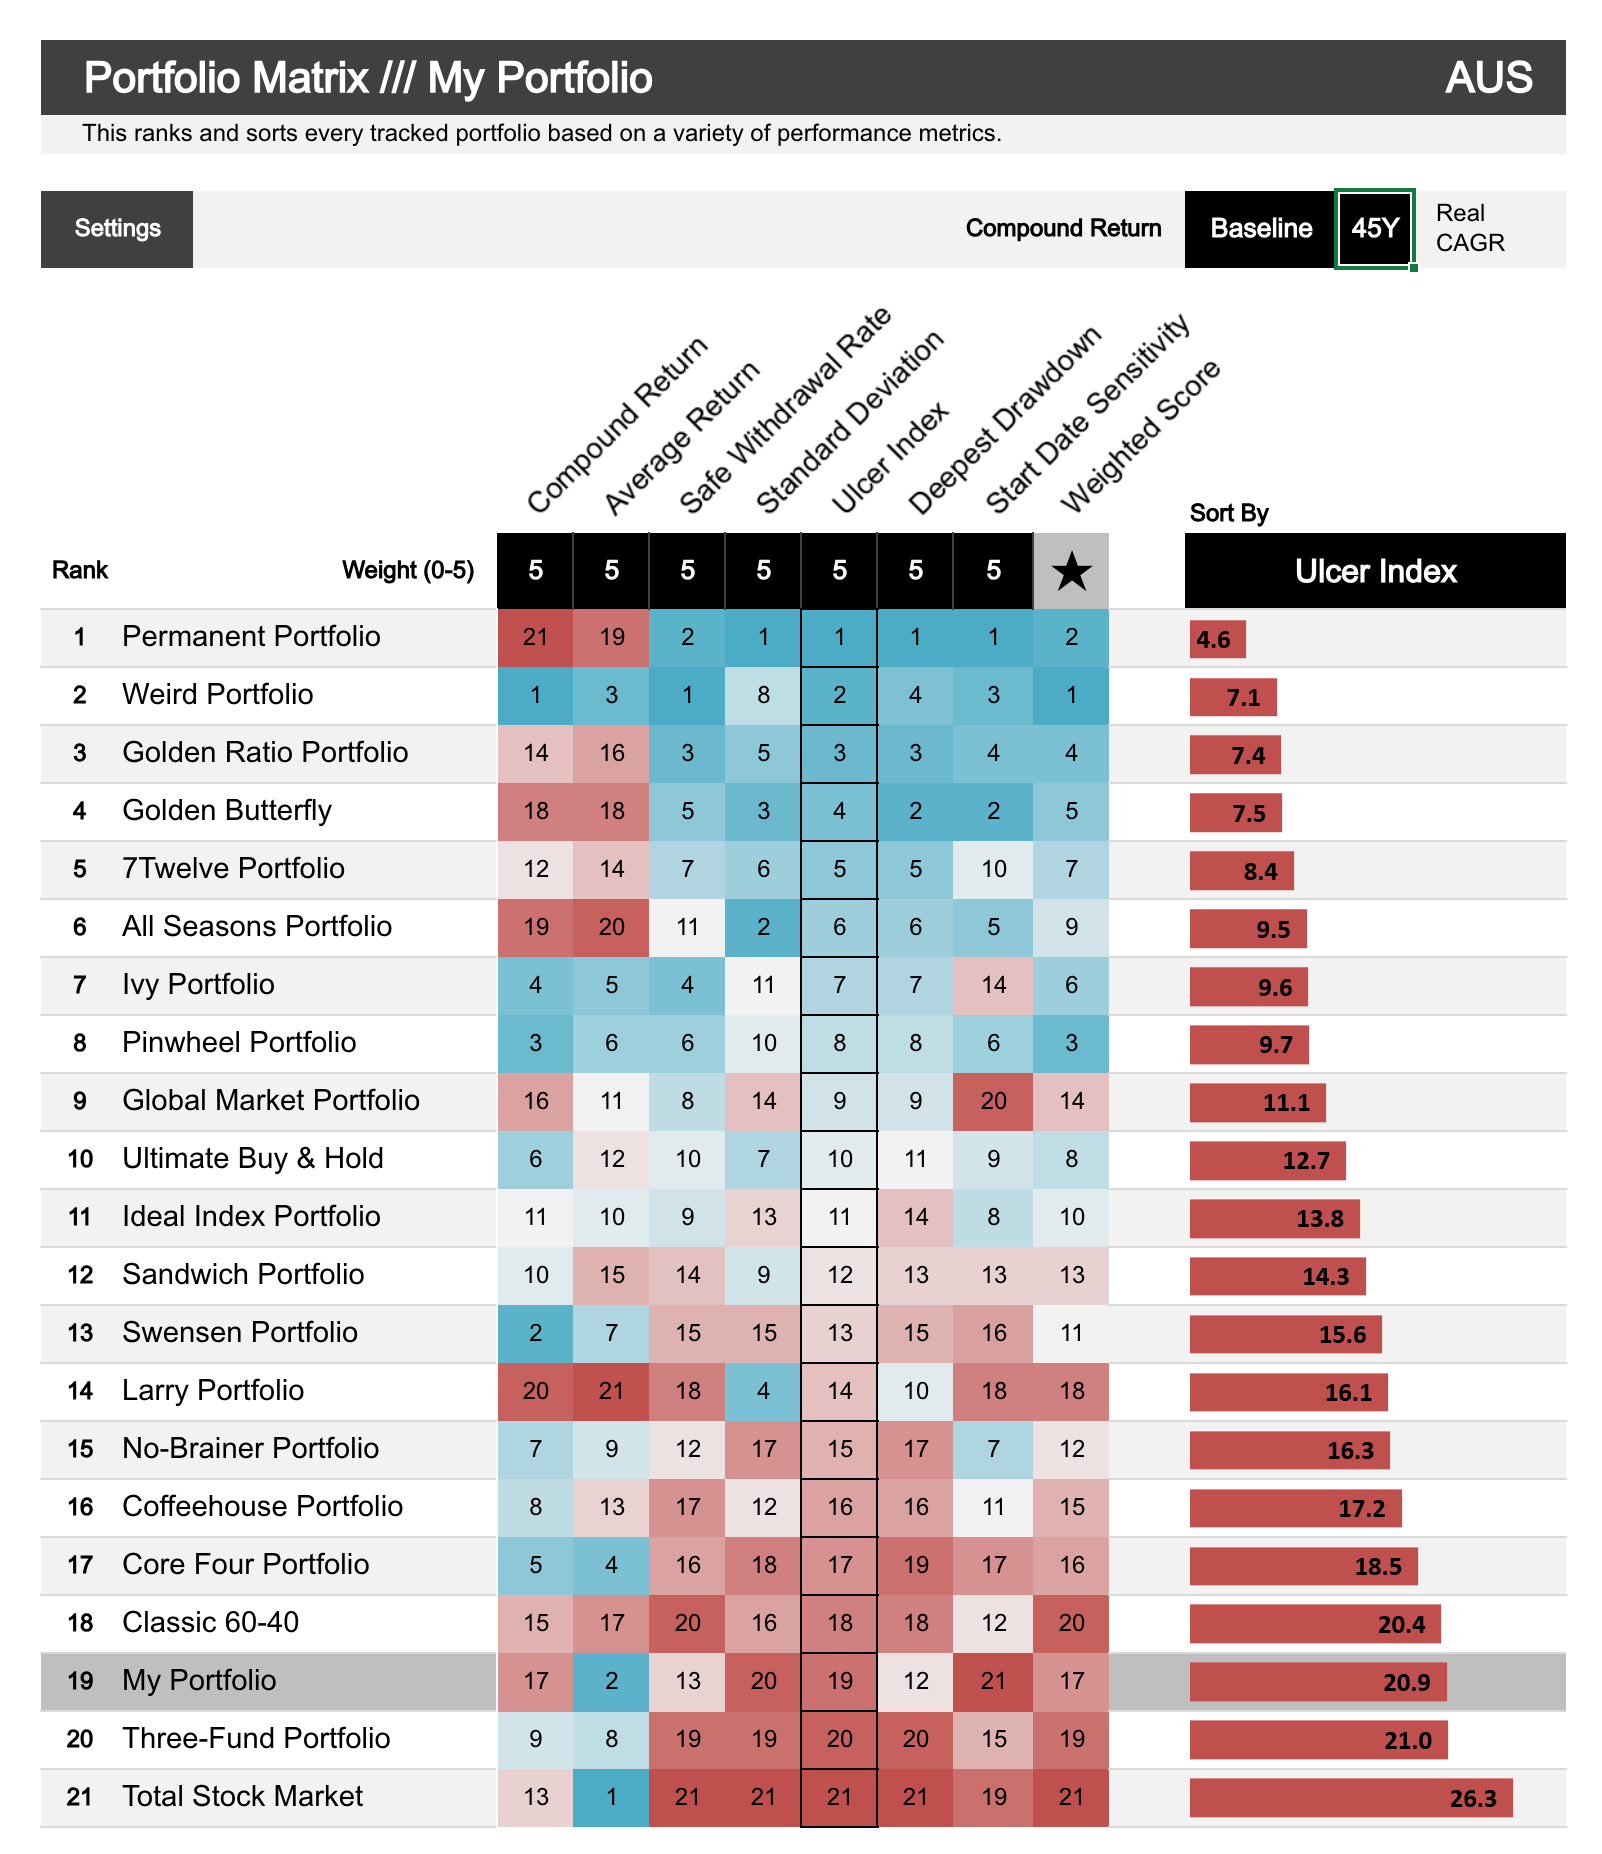
A good example of the depth of Portfolio Charts is this blog post from April 2024 from the creator of Portfolio Charts explores different portfolios in retirement. The takeaway I got from it is global diversification is good to protect yourself against one country *cough* USA *cough* taking a shit and asset diversification is good so that you don't have all your eggs in the equities basket should the stock market tank *cough* AI bubble *cough*. How that relates to an exact portfolio makeup, I'm still messing around with.
Portfolio Charts isn't the only site, there's others around that have just as useful backtesting of portfolios (unfortunately mostly US-data too):
I'm still reading and experimenting with various portfolios, but it looks like a mix of equities, bonds, cash and some sort of commodities is in my future. What that mix is, I still do not know. I think I will explore this in its own post as it's what I've been spending a lot of time on the last month.
I don't want to go into figures in this blog post, but after my research all signs point to yes and my position is even stronger once I add in superannuation when I'm 60 and a minimal amount of casual/part-time/additional income until I'm physically/mentally unable. The challenge now is deciding on a suitable portfolio that lets me sleep at night without worrying about it vaporising to the point where I'm 62 and need a job after a decade out of the workforce, while also providing enough returns after-tax that it meets my inflation adjusted expenses.
It's an Ausse take on tech news that I write daily. No ads, no tracking, no affiliate links, no AI slop. 100% subscriber-funded since 2015.

此内容由惯性聚合(RSS阅读器)自动聚合整理,仅供阅读参考。 原文来自 — 版权归原作者所有。