






In this Prometheus part, we're going to learn how to collect system metrics such as CPU, memory, and disk usage using Prometheus and Node Exporter. While Prometheus is excellent for scraping custom application metrics, it doesn’t natively support monitoring host system metrics. That’s where Node Exporter comes in.
Node Exporter is a widely-used Prometheus exporter that helps us to monitor our system-level metrics that helps serving our supercool space grocery shop application. Let’s walk through the steps to set it up using Docker, as we already said that's what the space monkeys love.
This post is part of a Prometheus series.
Prometheus Essentials: Introduction To Metric Types
Prometheus Essentials: Install and Start Monitoring Your App
Prometheus Essentials: Node exporter And System Monitoring (THIS ARTICLE)
The entire series is written in a way that beginners can easily follow along. The goal is to explain concepts in a very simple manner. Although it is beginner-friendly, it doesn’t mean it is completely free of requirements. I anticipate the following prerequisites:
Coding: You should have some coding skills, preferably in Python. This is because we have a simple Flask app, but I won’t be covering how to create virtual environments, install modules, etc. I assume you already know that.
Containers: You should be familiar with basic container techniques. Nothing too advanced, but we won’t be covering the basics either.
Computer Savvy: We don’t cover what’s considered essential computer knowledge you should already be comfortable with the basics 😂
Prometheus doesn’t have a direct plugin to monitor your system metrics, so we’ll use Node Exporter for that. Instead of installing Node Exporter directly on your system, we can easily run it using Docker. Here’s how:
docker run -p 9100:9100 prom/node-exporterThis command pulls the Node Exporter image from Docker Hub and runs it, exposing port 9100 for Prometheus to scrape metrics from.
Once Node Exporter is up and running, you can check the metrics endpoint by navigating to:
You should see metrics like CPU, memory, disk usage, and other system-level metrics. These metrics are invaluable for monitoring the health and performance of your server.
Now that Node Exporter is running, we need to configure Prometheus to scrape metrics from it. We’ll add a new job to our Prometheus configuration file, prometheus.yml, to tell Prometheus where to find Node Exporter.
Here’s the updated configuration:
global:
  scrape_interval: 15s  # Default scrape interval for all jobs

scrape_configs:
  # Scrape configuration for Flask app
  - job_name: 'flask_app'
    scrape_interval: 10s  # Custom scrape interval for the Flask app
    scrape_timeout: 5s     # Maximum time to wait for a scrape to complete
    metrics_path: '/custom-metrics'  # Custom endpoint for metrics (if you change the default)
    static_configs:
      - targets: ['host.docker.internal:5000']  # Target (your Flask app running on Docker)

  # Scrape configuration for Node Exporter
  - job_name: 'node_exporter'
    static_configs:
      - targets: ['host.docker.internal:9100']  # Target (Node Exporter for system metrics)
In this configuration, we’ve added a new job called node_exporter that tells Prometheus to scrape metrics from Node Exporter running at host.docker.internal:9100. Since we are running Prometheus in Docker, we use host.docker.internal to refer to the host machine.
If you make changes to the configuration file, you’ll need to restart Prometheus to apply those changes.
Make sure that both your app and the node exporter are running.
Then start the Prometheus container:
docker run -p 9090:9090 \
  -v ~/prometheus/config/prometheus.yml:/etc/prometheus/prometheus.yml \
  -v ~/prometheus/data:/prometheus \
prom/prometheusTo verify that Prometheus is properly scraping metrics from Node Exporter, you can access the Prometheus UI at:
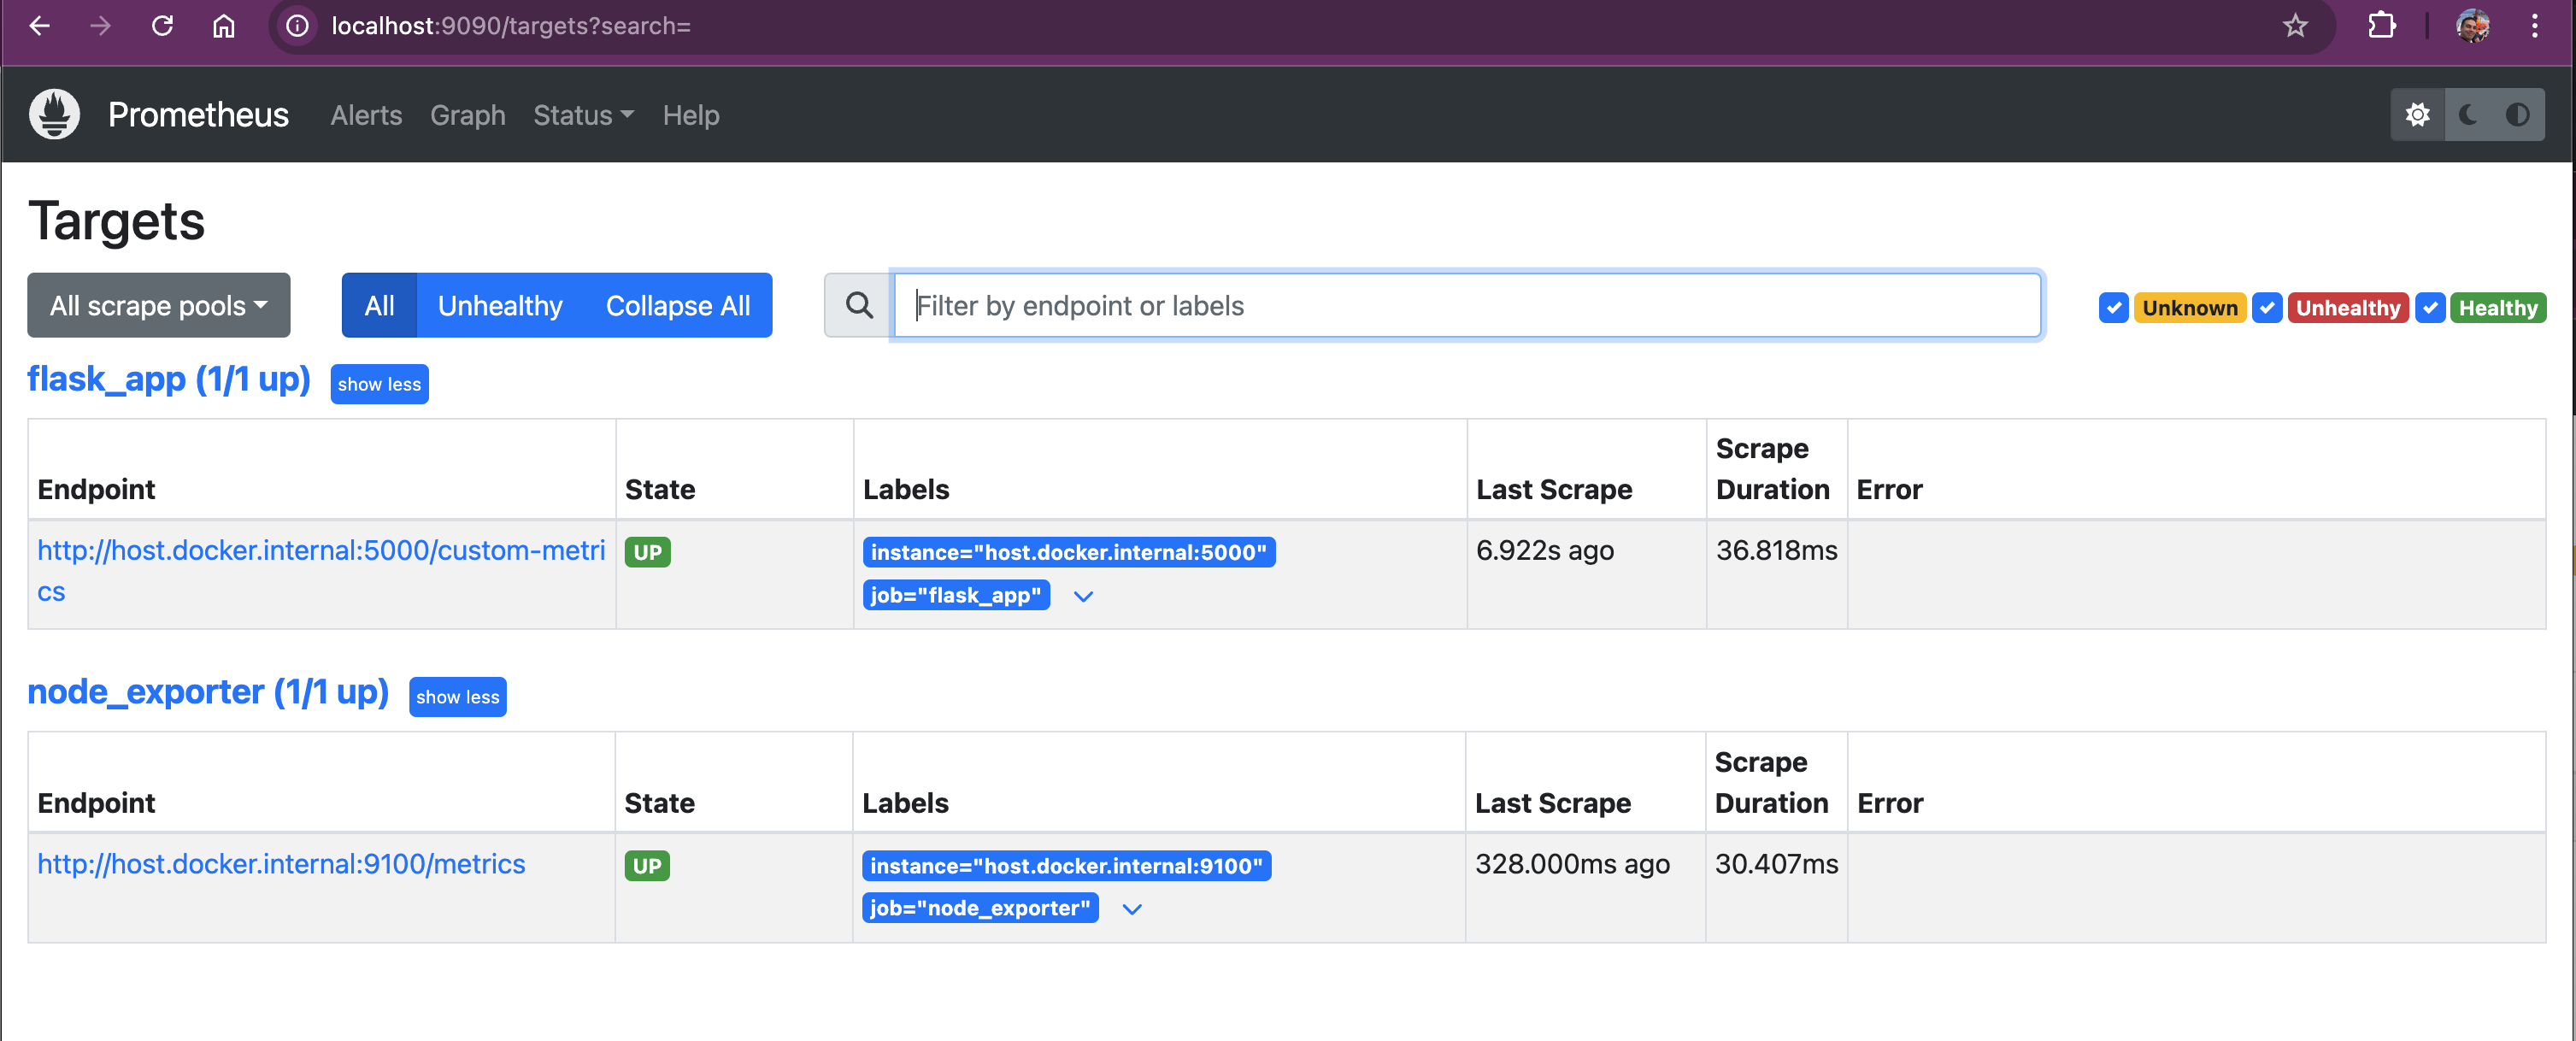
On this page, you will see a list of all configured targets, including node_exporter. The target status should show as "UP", indicating that Prometheus is successfully scraping metrics from Node Exporter.
By reaching the /metrics endpoint, we can verify that the node exporter is exposing the raw output of Prometheus metrics:
http://127.0.0.1:9100/metrics

# HELP go_gc_duration_seconds A summary of the pause duration of garbage collection cycles.
# TYPE go_gc_duration_seconds summary
go_gc_duration_seconds{quantile="0"} 3.6834e-05
go_gc_duration_seconds{quantile="0.25"} 0.000605333
go_gc_duration_seconds{quantile="0.5"} 0.001465207
go_gc_duration_seconds{quantile="0.75"} 0.001505959
go_gc_duration_seconds{quantile="1"} 0.001799
go_gc_duration_seconds_sum 0.006219209
go_gc_duration_seconds_count 6
# HELP go_goroutines Number of goroutines that currently exist.
# TYPE go_goroutines gauge
go_goroutines 8
# HELP go_info Information about the Go environment.
# TYPE go_info gauge
go_info{version="go1.22.5"} 1
# HELP go_memstats_alloc_bytes Number of bytes allocated and still in use.
# TYPE go_memstats_alloc_bytes gauge
go_memstats_alloc_bytes 2.29788e+06
# HELP go_memstats_alloc_bytes_total Total number of bytes allocated, even if freed.
# TYPE go_memstats_alloc_bytes_total counter
go_memstats_alloc_bytes_total 1.2517672e+07
---
With Node Exporter successfully integrated, you can start querying system metrics. For example:
rate(node_cpu_seconds_total[5m])This query calculates the average CPU usage over the last 5 minutes. It gives you insight into how much CPU time is being consumed.
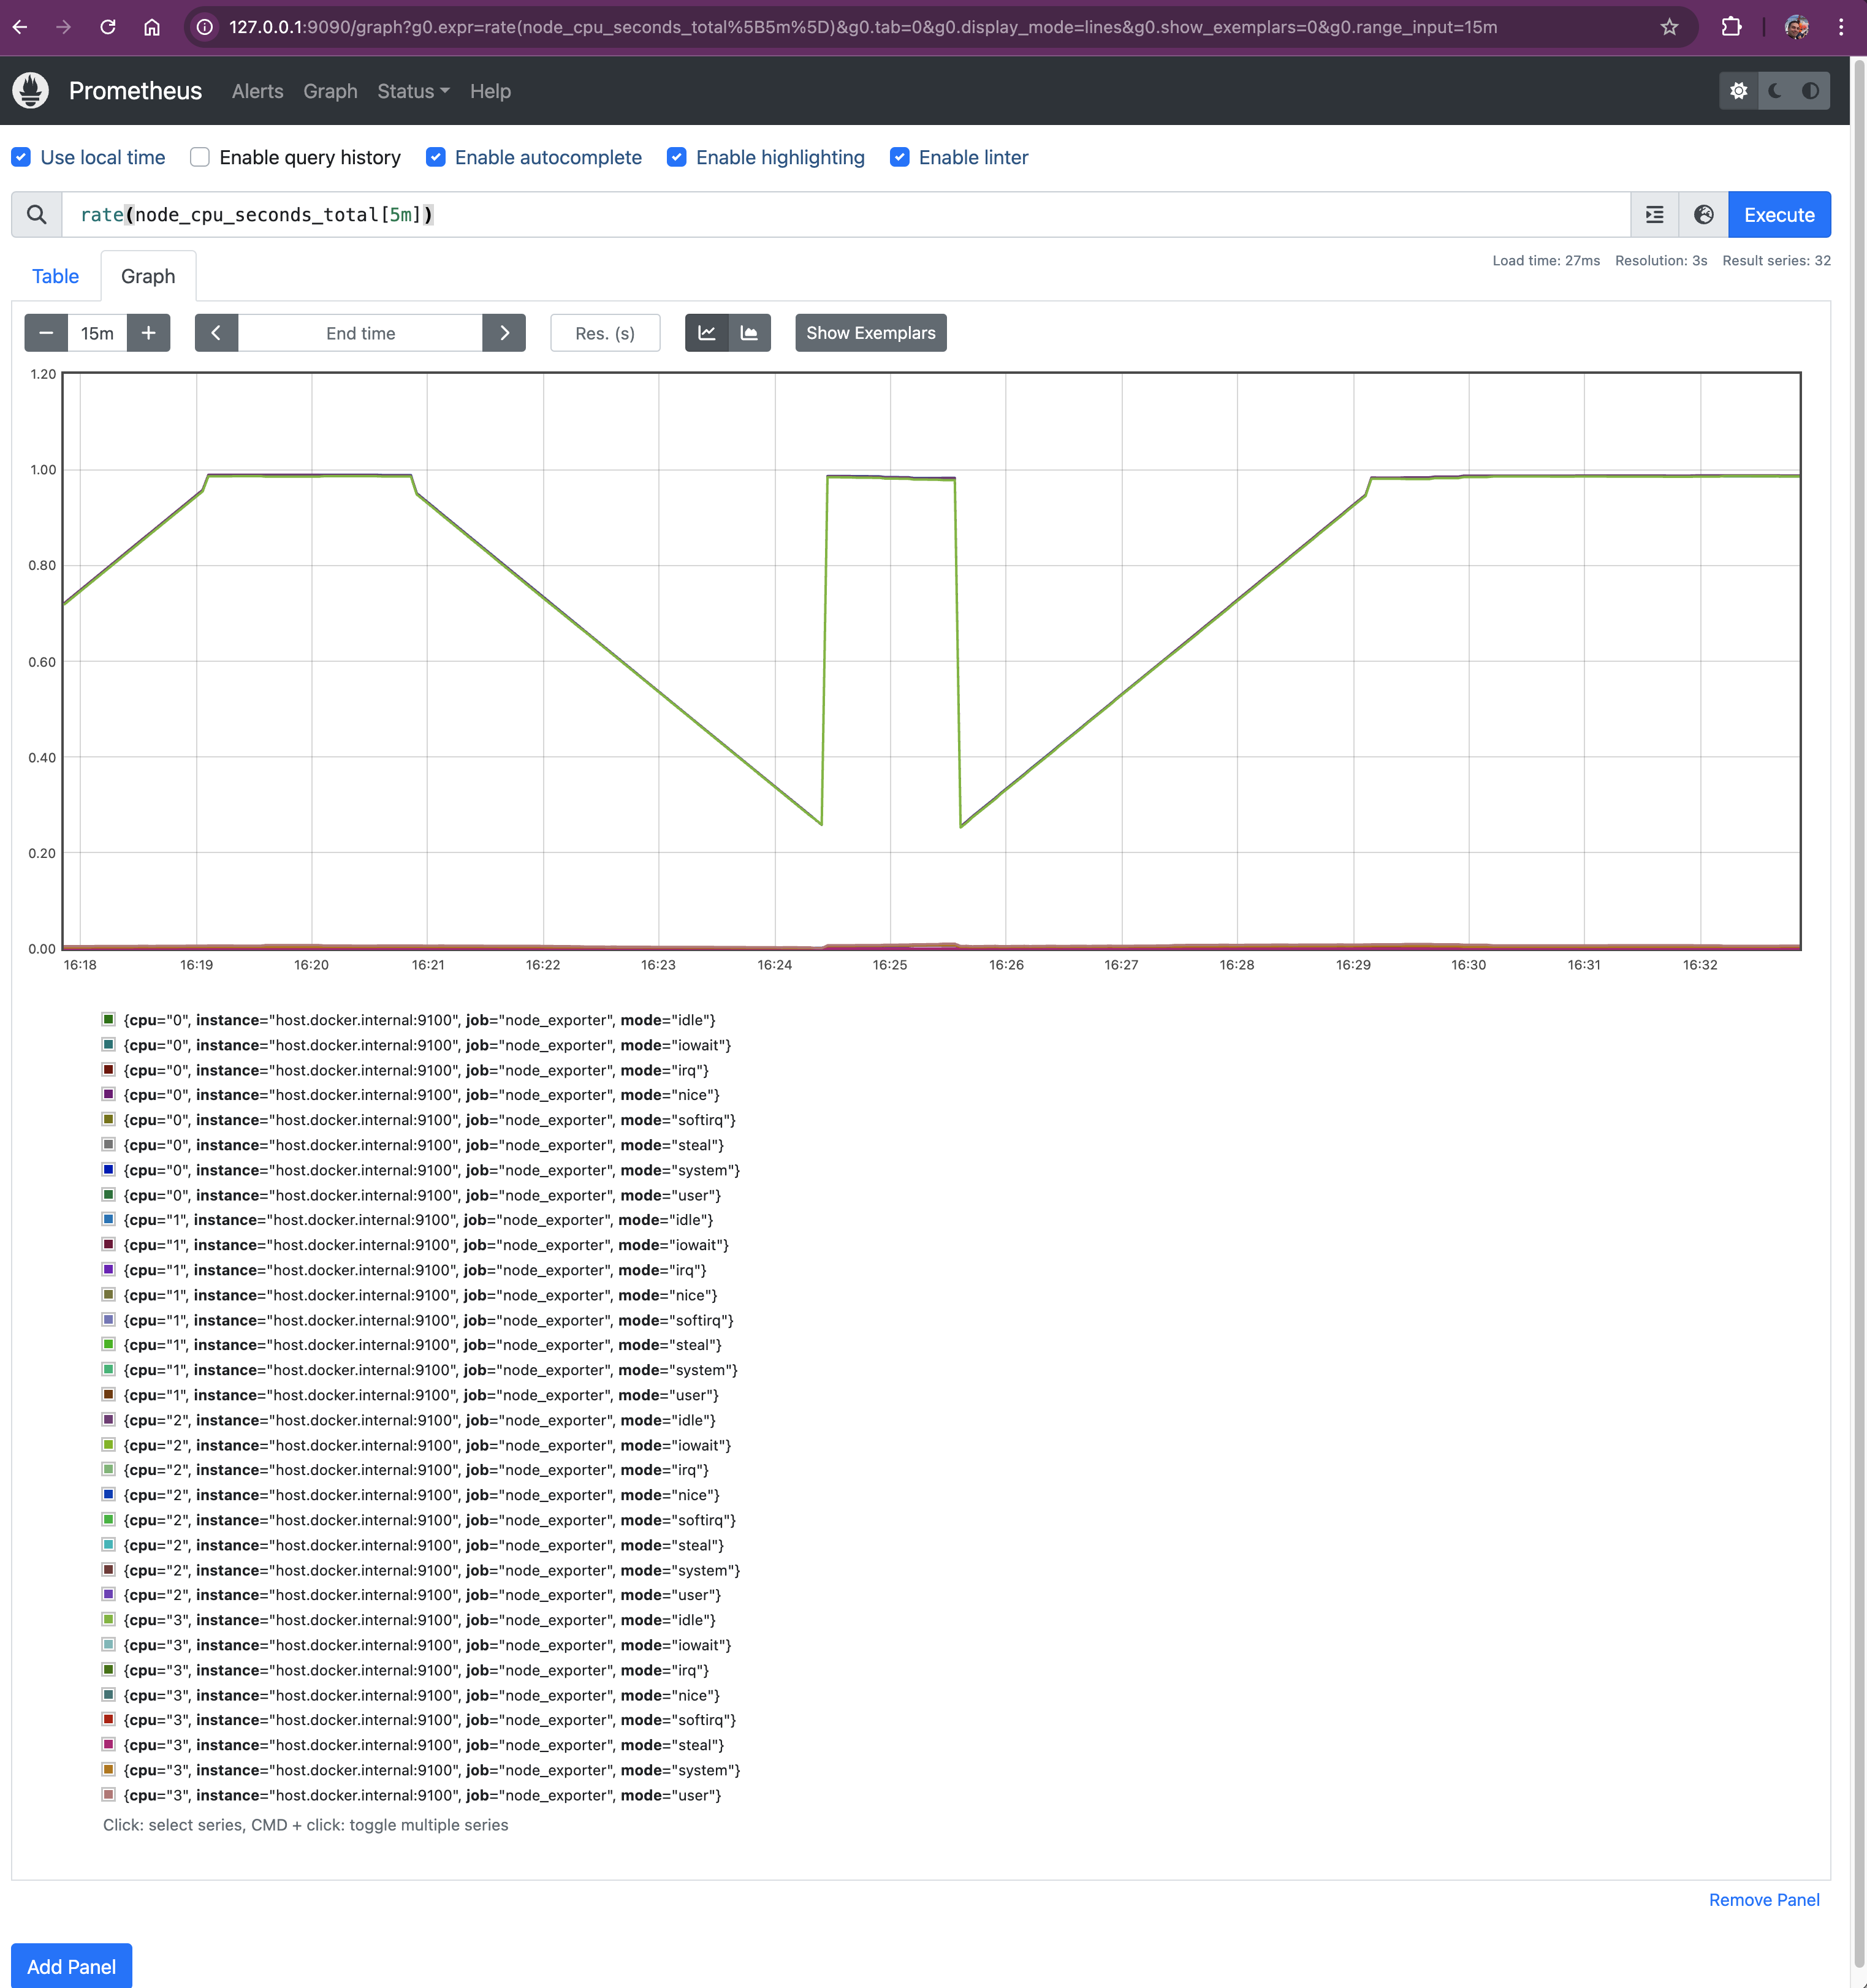
node_cpu_seconds_total:
rate():
rate(node_cpu_seconds_total[5m]) computes the average rate at which the CPU time is increasing per second over the last 5 minutes.Query: node_memory_MemTotal_bytes - node_memory_MemAvailable_bytes
This query shows the used memory by subtracting available memory from the total memory. It helps you understand how much memory is being utilized.
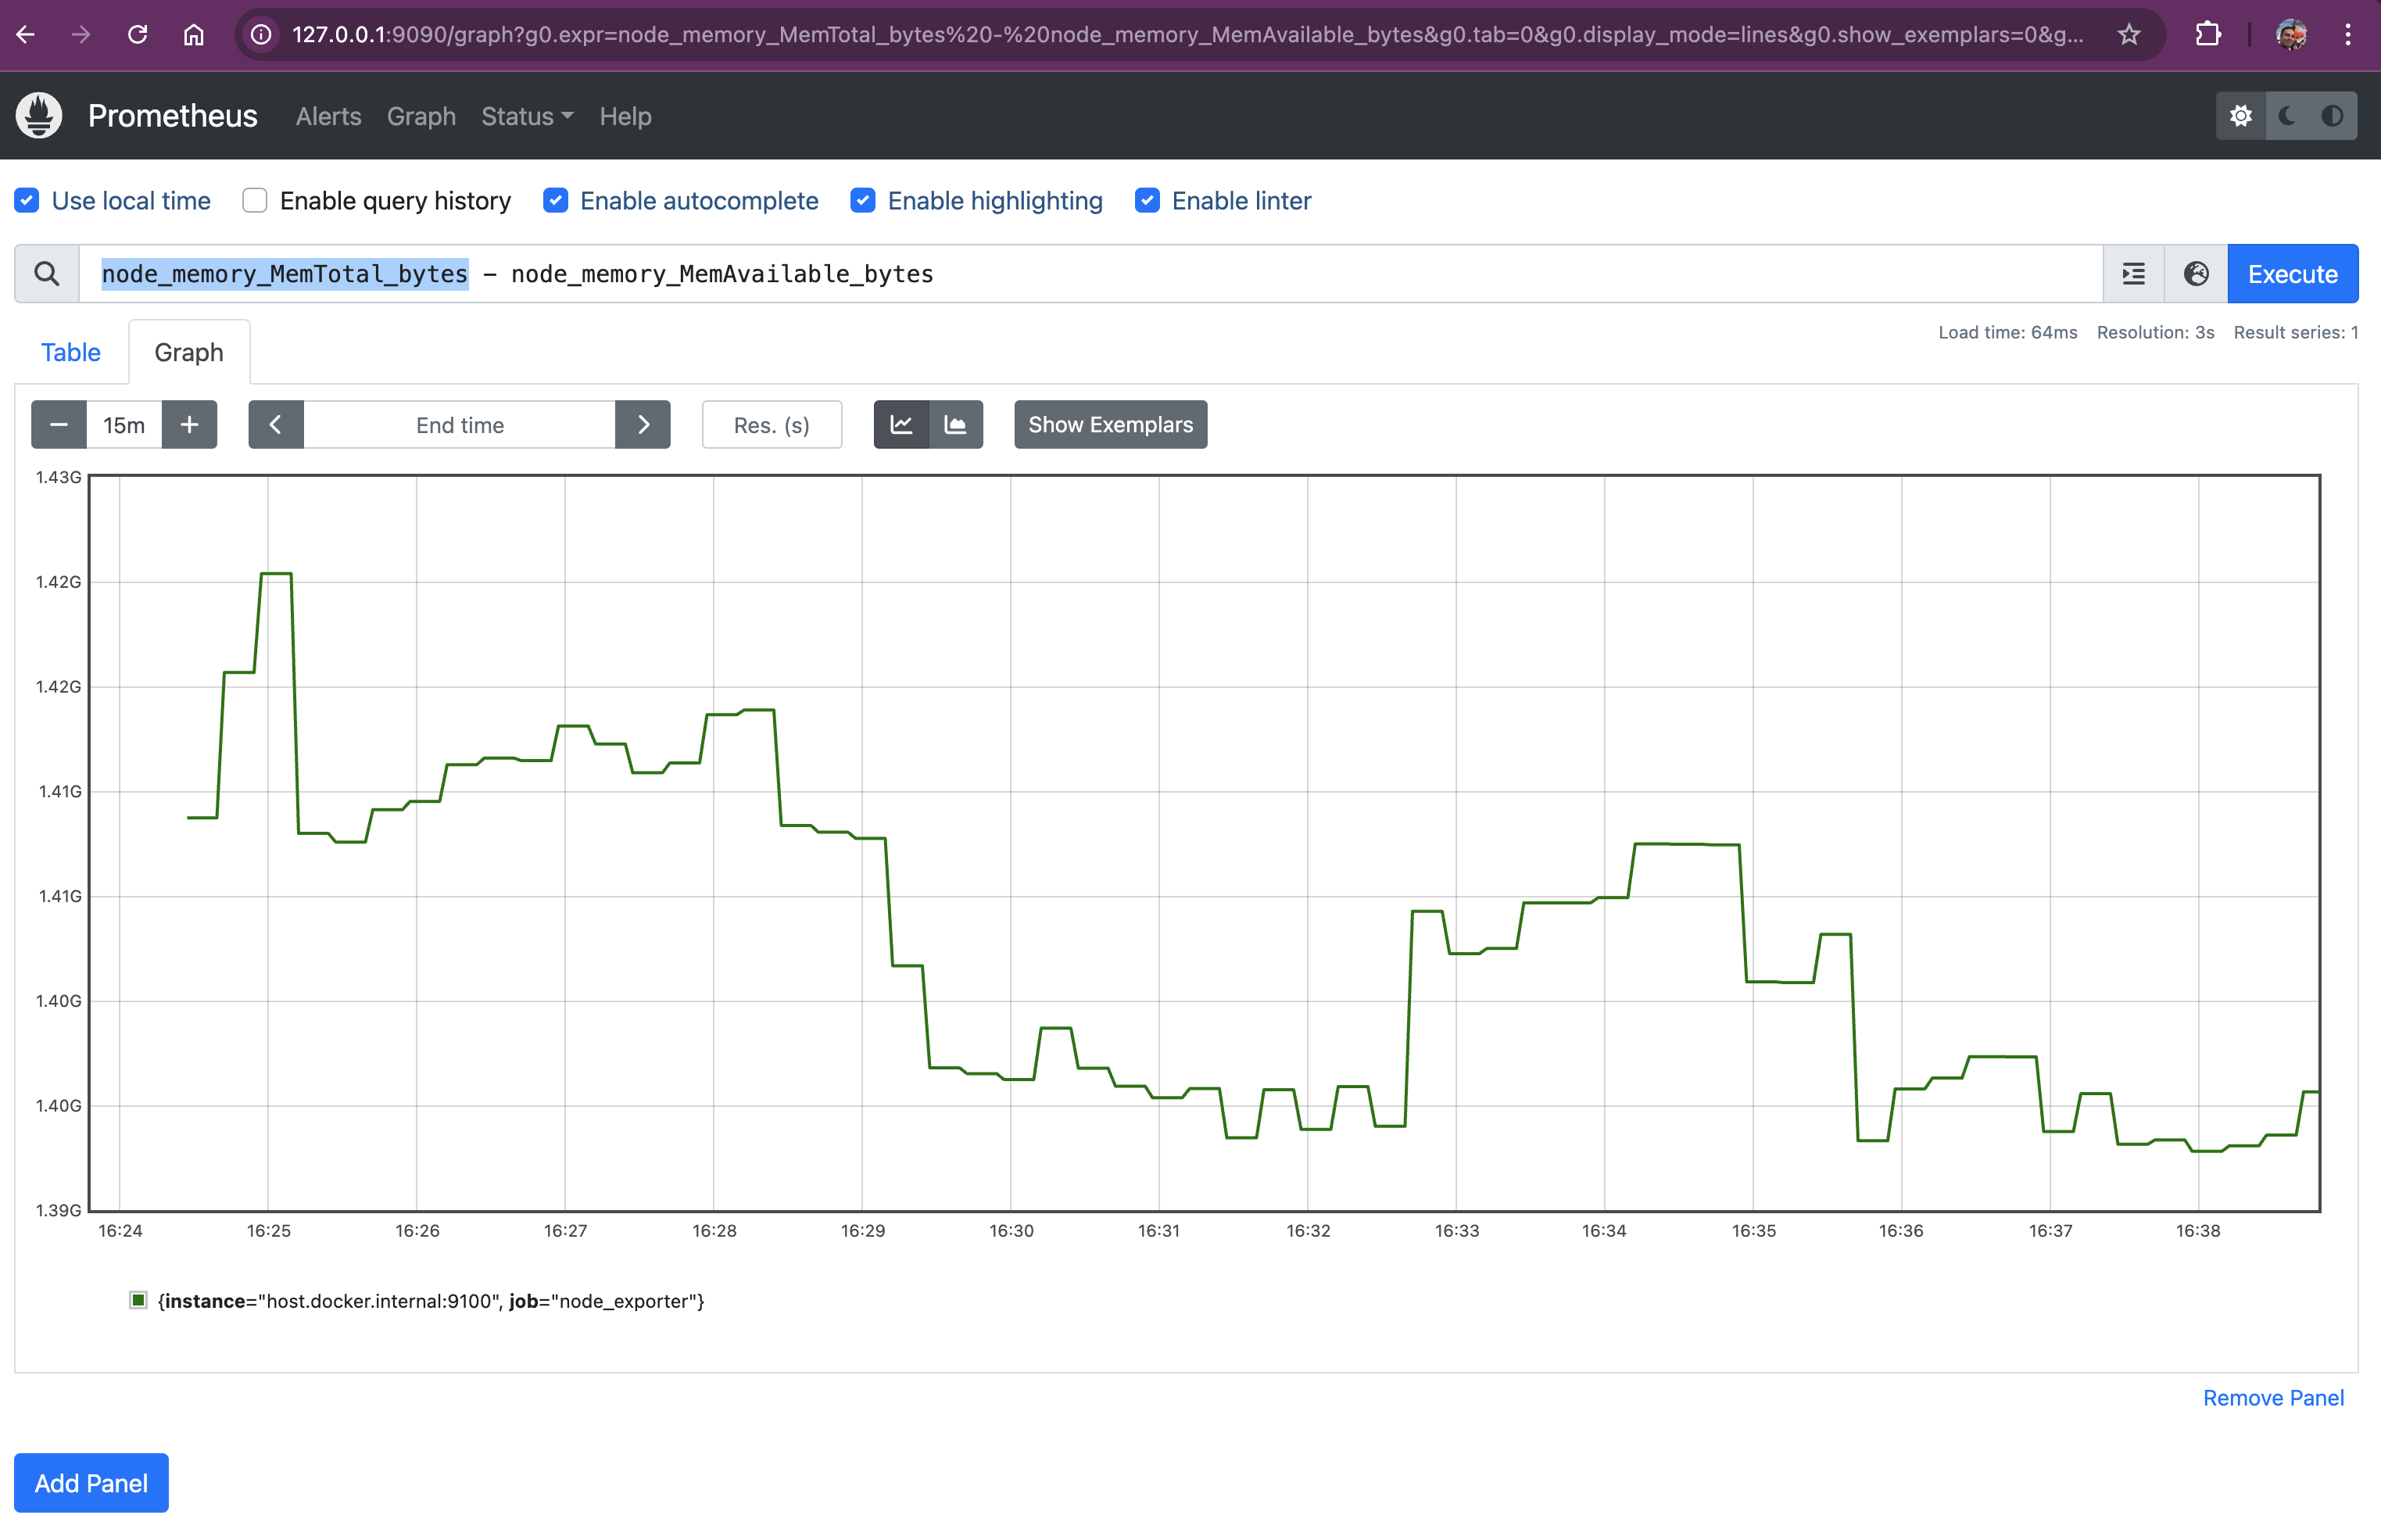
node_memory_MemTotal_bytes:
node_memory_MemAvailable_bytes:
Subtracting the Two Metrics:
node_memory_MemTotal_bytes - node_memory_MemAvailable_bytes:
Query: (node_filesystem_size_bytes{fstype!="tmpfs"} - node_filesystem_avail_bytes{fstype!="tmpfs"}) / node_filesystem_size_bytes{fstype!="tmpfs"} * 100
This query computes the disk usage percentage for all non-temporary filesystems by subtracting the available space from the total size, dividing by the total size, and multiplying by 100. Let’s break down this query to understand its components and how to interpret the results:
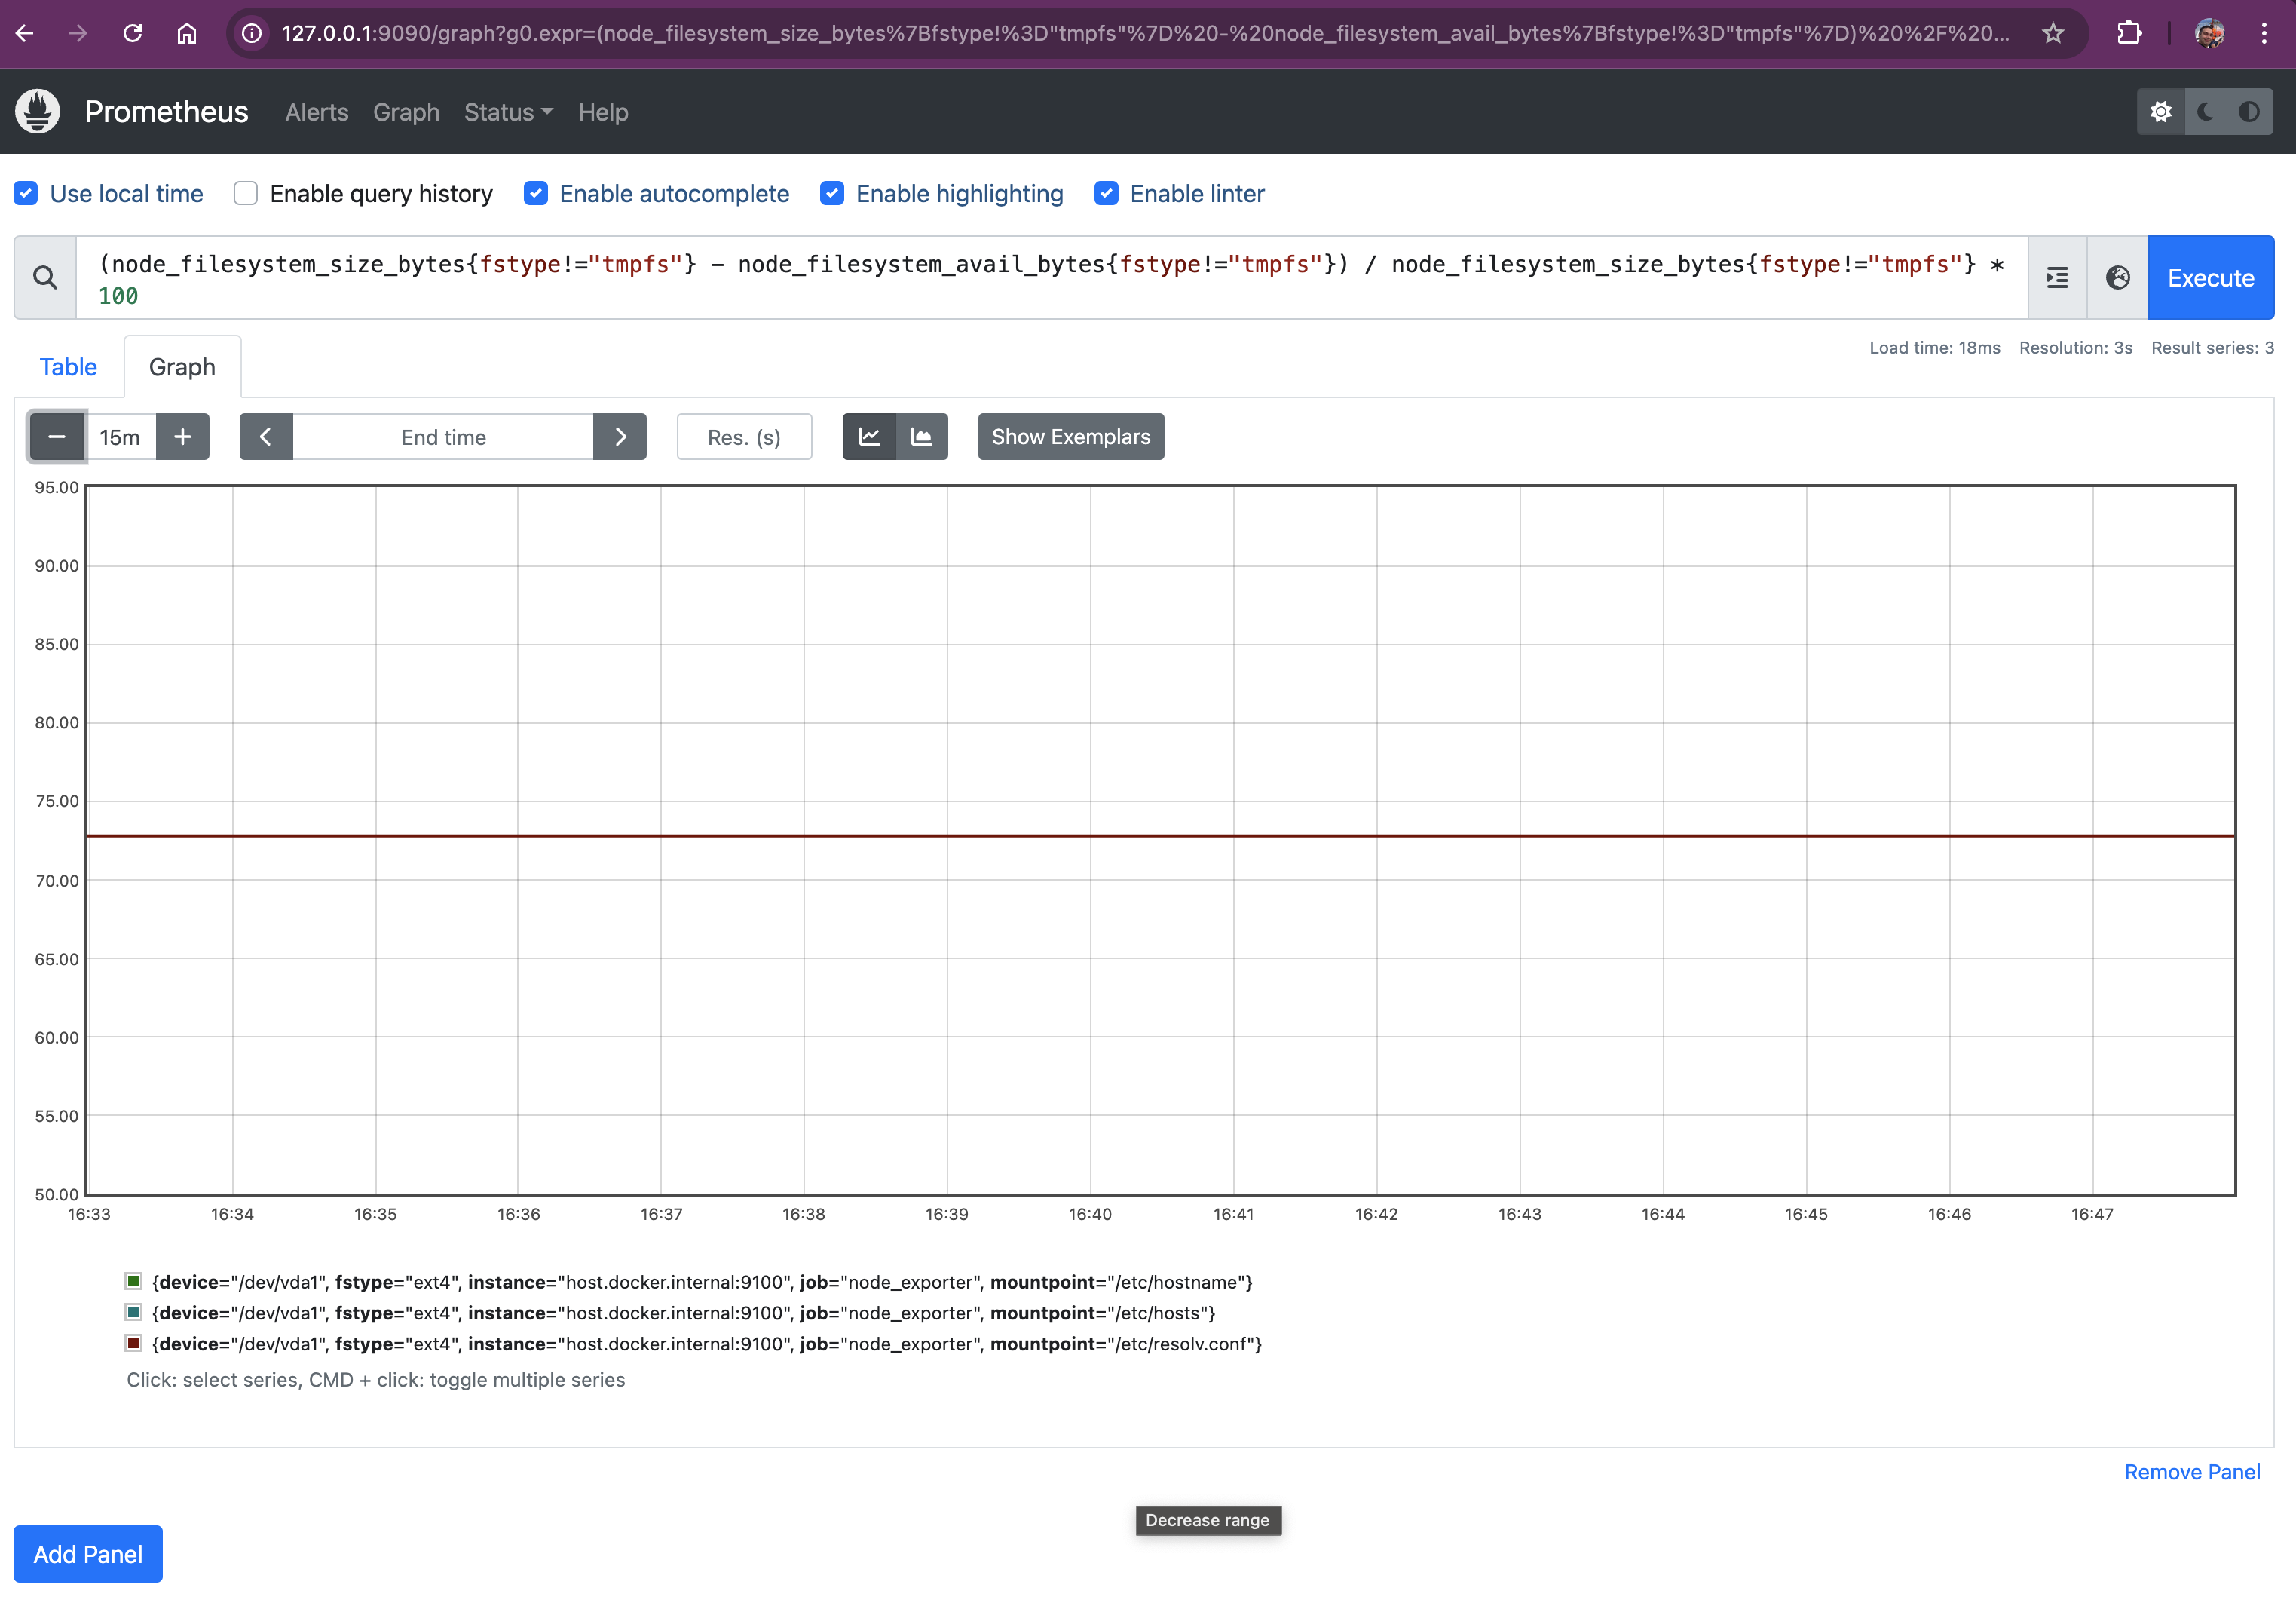 Let's break it down:
Excluding Temporary Filesystems
{fstype!="tmpfs"}: excluding temporary file systemsMetrics Used
node_filesystem_size_bytes:
Calculating Used Space
node_filesystem_size_bytes - node_filesystem_avail_bytes:
Node Exporter is a tool that allows Prometheus to collect system metrics, giving us a complete picture of both our applications and the infrastructure they run on. With this setup, you can monitor everything from CPU usage to available disk space, ensuring your environment is always performing at its best.
By setting up these metrics, we gain valuable visibility into our systems, enabling us to proactively manage resources, identify bottlenecks, and prevent potential issues before they impact our users. Monitoring is crucial for maintaining the reliability and performance of any infrastructure, and with Prometheus and Node Exporter, we cover both business and system monitoring.
If you have any questions or need further clarification, feel free to drop a comment below.
Happy Monitoring, space monkeys!
此内容由惯性聚合(RSS阅读器)自动聚合整理,仅供阅读参考。 原文来自 — 版权归原作者所有。