



Prometheus is a component of many observability stacks but comes with a hidden cost: memory usage. In enterprise-scale Kubernetes environments, this turns into a ticking time bomb. It feels like a cat-and-mouse game—whatever memory you give it, it eats it.
Here's how we uncovered and defused it.
❗This post offers a tool that helps you analyze high-cardinality metrics and labels used by your Grafana dashboards and AlertManager. It’s great if you want an easy way to see what can be safely dropped.
In the production Kubernetes cluster I worked on, Prometheus memory usage climbed past 55 GB, peaking at 60 GB, despite an already oversized node. Indeed, the environment was rapidly growing in the number of applications, but the situation was still not sustainable.
The following metric spelled the trouble:
avg_over_time(process_resident_memory_bytes{job="prometheus"}[5m])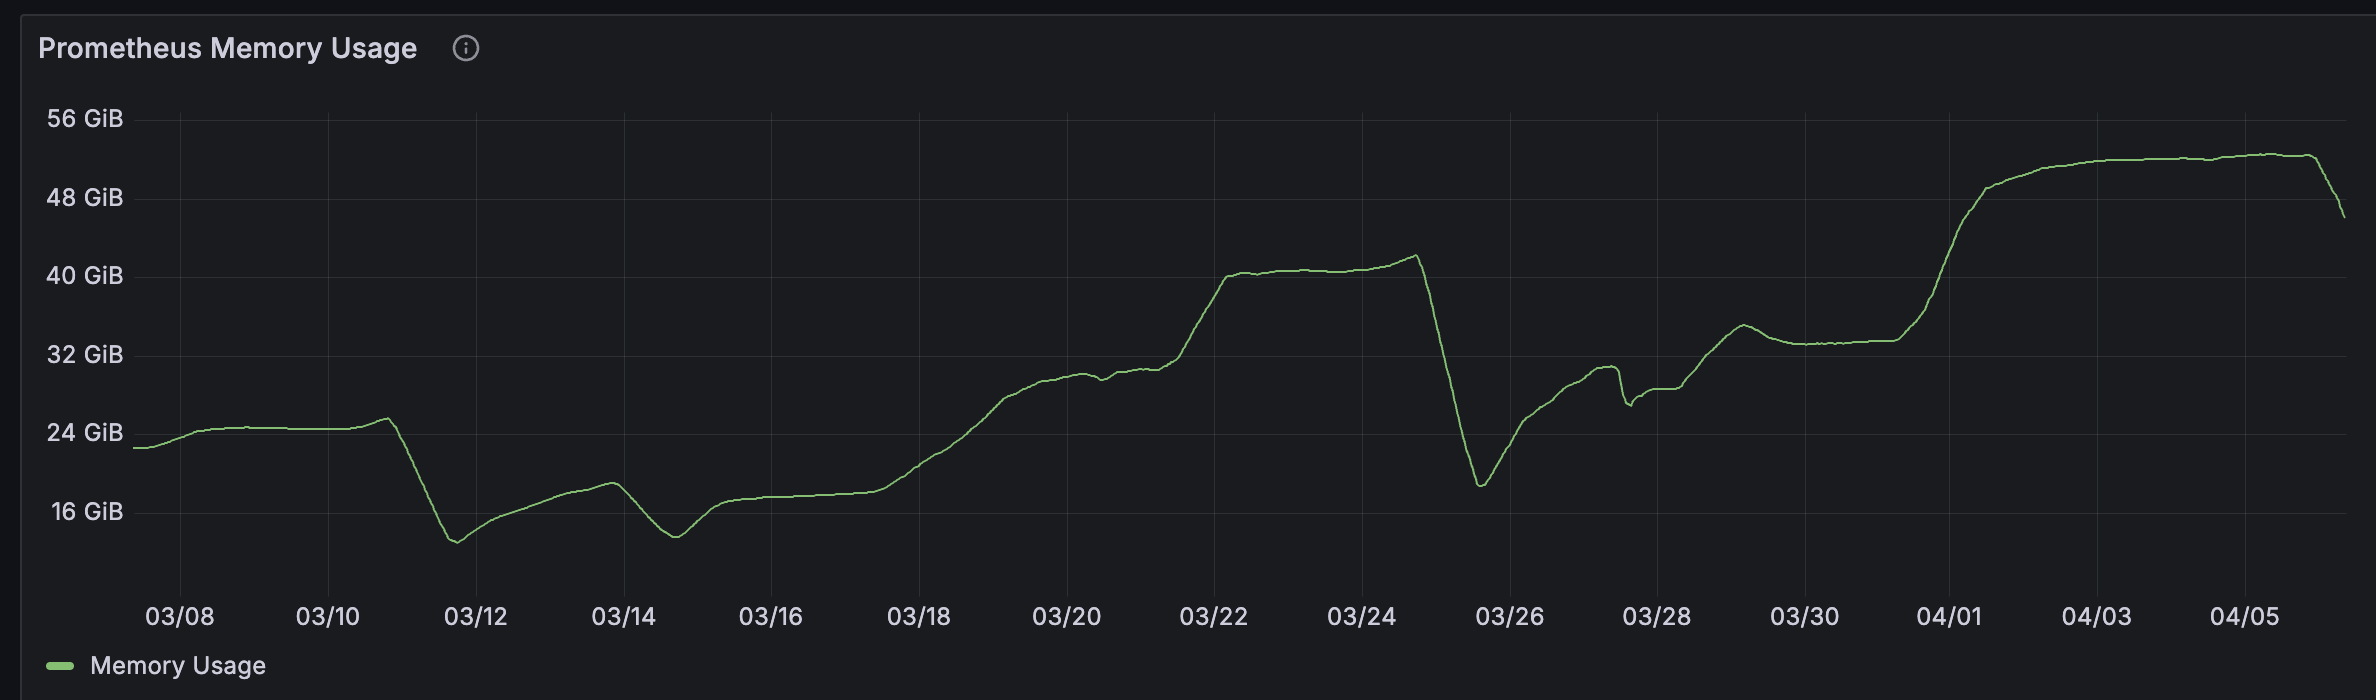
The result? Frequent OOMKilled restarts failed PromQL queries, and a shaky UI experience for observability teams.
And missing scraping due to non-working Prometheus.
To identify high-cardinality metrics and labels, I used the promtool CLI, is a utility included with Prometheus that provides validation and analysis features. You could of course write promql queries in the query analyzer , but promtool is giving you a great summary out-of-the-box in a structured way. We'll of course use both ways to get a sense of what the root cause is.
If you’re on macOS, the easiest way to install Prometheus (and get promtool) is via Homebrew:
brew install prometheusFor other platforms, you can download the appropriate binaries directly from the official Prometheus downloads page.
💡 Tip: If you’re running Prometheus as part of the kube-prometheus-stack (like I do), then promtool is already available inside the Prometheus container.
We will come back to how to use analyze the high-cardinality metrics and labels with promtool cli
While long-term metrics storage is handled (in our case) via Thanos, which uploads the compacted TSDB blocks to an S3 bucket every 2 hours, it’s important to remember:
Before metrics hit persistent storage, they live entirely in memory.
This is where memory pressure comes from — the Prometheus “head block” keeps all incoming series in memory until they’re compacted and written to disk.
To check how many time series are currently held in memory, run:
avg_over_time(prometheus_tsdb_head_series{job="prometheus"}[1h])Result:

*_bucket.
You can imagine that if our application has hundreds or thousands of unique paths, each one combined with other labels like method, status_code, or instance, can quickly explode the number of time series. For example:
method="GET", path="/home" → 1 time seriesmethod="POST", path="/api/users" → another onemethod="GET", path="/api/users/123" → yet another oneIf the paths are dynamic (e.g., include user IDs or UUIDs), this could lead to millions of distinct combinations, and each of them is a time series that Prometheus needs to track in memory.
To pinpoint which metrics are consuming the most memory in our Prometheus instance, we used the following query:
topk(10, count by (__name__)({__name__=~".+"}))This returns the top 10 metrics by number of active time series. Here’s what stood out:
nginx_ingress_controller_request_duration_seconds_bucket{}      xx
nginx_ingress_controller_response_duration_seconds_bucket{}     xx
nginx_ingress_controller_connect_duration_seconds_bucket{}      xx
nginx_ingress_controller_request_size_bucket{}                  xx
nginx_ingress_controller_response_size_bucket{}                 xx
nginx_ingress_controller_header_duration_seconds_bucket{}       xx
nginx_ingress_controller_bytes_sent_bucket{}                    xx
The following is an example of the high-cardinality labels (using promtool cli):
Highest cardinality labels:
20614 replicaset
10831 id
8705 name
7860 container_id
7586 owner_name
7149 uid
6514 pod
4810 created_by_name
4791 workload
3554 ip
3549 pod_ip
3080 address
3055 mountpoint
2868 interface
2783 job_name
2686 deployment
2680 device
2595 pod_uid
2220 container
2121 __name__
Root Cause:
The explosion in the series count was due to high-cardinality metrics and labels.
In my case, it mostly boiled down to the NGINX metrics.
Double-Scraping Detected:
While investigating the source of high metric cardinality, we discovered that Prometheus was scraping ingress-nginx metrics from two different paths:
This revealed that the same metrics were being ingested twice — once from the service and once from the pods — doubling the number of time series:
count by (job) (nginx_ingress_controller_request_duration_seconds_bucket)Showing
{job="ingress-nginx-controller-metrics}
{job="kubernetes-pods"}
From Prometheus’s point of view, the same metric name with different job or instance labels is a different time series. This led to metric duplication and a significant increase in memory usage.
promtoolThis time we will use promtool to perform the analysis.
If running Prometheus in Kubernetes environment, the promtool cli is already available in the Prometheus container.
We could simply run promtool tsdb analyze /prometheus inside the pod:
kubectl exec -it prometheus-kube-prometheus-stack-prometheus-0 -- promtool tsdb analyze /prometheusUnderstanding which metrics and labels are causing high cardinality is essential for tuning Prometheus to use memory more efficiently.
Block ID: 01JR8T05B2Q6G0HCY3S8BPPWZP
Duration: 1h59m59.998s
Total Series: 3769527
Label names: 361
Postings (unique label pairs): 128083
Postings entries (total label pairs): 54613781
Here are two tables summarizing the highest cardinality metrics and labels found in the Prometheus TSDB block analysis
| Metric Name | Series Count |
|
nginx_ingress_controller_request_duration_seconds_bucket |
533292 |
|
nginx_ingress_controller_response_size_bucket |
488851 |
|
nginx_ingress_controller_request_size_bucket |
488851 |
|
container_tasks_state |
53390 |
|
nginx_ingress_controller_response_size_count |
44441 |
|
nginx_ingress_controller_request_size_sum |
44441 |
|
nginx_ingress_controller_requests |
44441 |
|
nginx_ingress_controller_response_size_sum |
44441 |
|
nginx_ingress_controller_request_duration_seconds_count |
44441 |
| Label | Unique Values |
|---|---|
|
replicaset |
20135 |
|
id |
10247 |
|
name |
8282 |
|
container_id |
7627 |
|
owner_name |
7401 |
|
uid |
7045 |
|
pod |
6422 |
|
created_by_name |
4682 |
|
workload |
4670 |
To estimate how much RAM Prometheus consumes due to high series cardinality, use the following formula:
We can use this when estimating how much RAM Prometheus consumes due to high series cardinality:memory_usage_bytes = active_series_count × avg_memory_per_series
typical assumption:
avg_memory_per_series = ~3000-4000 bytes
For the nginx_ingress_controller_request_duration_seconds_bucket metric, here is an example:
nginx_ingress_controller_request_duration_seconds_bucket = 256,548 series
= 256,548 × 3000 bytes = ~770 MB RAM
This formula gives a lower-bound estimate. Actual process_resident_memory_bytes can be 2× higher due to Go heap, mmaped chunks, and query workload.
Just because something we tagged as High Cardinality, it doesn't mean it's not being used, so it might bring some value after all. It becomes a problem when it provides little value
We used the following criteria to decide if we should remove something or not:
❌ Drop unused metrics that are not part of the Grafana dashboards or alert rules.
❌ Drop noisy labels if you don’t need granularity at that level.
✅ Retain labels essential for filtering in alerts and visualizations.
What I knew we shouldn't do is break any dashboards and alerts currently being used.
In Prometheus query, I ran the following query to get all the nginx metrics:
count by (__name__)({__name__=~".*nginx.*"})By comparing the metrics used in Grafana with the result, the conclusion was we were not using the following metrics (despite them being very large in series count):
❌ *_duration_seconds_bucket (excluding request_duration_seconds_bucket)
	•	nginx_ingress_controller_connect_duration_seconds_bucket
	•	nginx_ingress_controller_header_duration_seconds_bucket
	•	nginx_ingress_controller_response_duration_seconds_bucket
...
Now you might ask: how did you find this out what is being used? It’s a painful process, I know, but there’s a tool at the end of this article that might help.
Now it's time to clean up a bit.
We'll begin with the Prometheus config.
Since we scraped the nginx metrics both from the pods and also via the ServiceMonitor config, we realized this was unnecessary. The following rule tells Prometheus: "Don't scrape any pods that are running in the ingress-nginx namespace":
      - job_name: 'kubernetes-pods'
        kubernetes_sd_configs:
          - role: pod
        relabel_configs:
          - source_labels: [__meta_kubernetes_namespace]
            regex: ingress-nginx
            action: drop
Now let's verify the jobs:
count by (job) (nginx_ingress_controller_request_duration_seconds_bucket)The result is:
job="ingress-nginx-controller-metrics"}Earlier we had two jobs. But now it means we don't scrape the nginx metrics from the pods anymore, but we do it from the ServiceMonitor.
❗When Prometheus scrapes metrics, each combination of metric name + label values becomes a separate time series. If you’re not careful, things like histograms and dynamic labels (e.g., host, path, method) can explode into millions of series, consuming large amounts of memory.
The metric_relabel_configs section in Prometheus lets us filter, transform, or drop metrics before they’re ingested into storage.
In our ServiceMonitor for ingress-nginx, we did the following change:
  metricRelabelings:
    - action: labeldrop
      # 🎯 Drop high-cardinality labels not used in dashboards
      regex: 'path|replicaset|controller_revision_hash|owner_name'
What it does:
This rule removes the specified labels from matching metrics during ingestion.
Why:
Labels like path and replicaset often have very high cardinality (many unique values). While they might add granularity, they also dramatically increase memory usage, especially on histogram metrics like in my case, nginx_ingress_controller_request_duration_seconds_bucket.
By dropping these labels, we reduce the number of label permutations, which can lead to fewer time series being generated, thereby improving memory efficiency.
⚠️ The labeldrop action removes the label, it doesn’t drop the time series. But if two time series only differ by the label you’re dropping, they’ll become identical. That causes a conflict, and Prometheus will throw an ingestion error because it doesn’t allow duplicate series. So before using labeldrop, make sure those labels aren’t essential to uniquely identify each time series.
  - sourceLabels: [__name__]
    # 🎯 Drop unused histogram metrics (keep only request duration buckets)
    regex: 'nginx_ingress_controller_(response_duration_seconds_.*|connect_duration_seconds_.*|header_duration_seconds_.*|bytes_sent_.*)'
    action: drop
What it does:
Drops histogram metrics that track response/connect durations, bytes, and sizes.
Why:
These are memory-heavy and often not used in dashboards or alerts. Dropping them saves resources.
This is showing the complete ServiceMonitor file:
apiVersion: monitoring.coreos.com/v1
kind: ServiceMonitor
metadata:
  annotations:
    meta.helm.sh/release-name: ingress-nginx
    meta.helm.sh/release-namespace: ingress-nginx
  labels:
    app.kubernetes.io/component: controller
    app.kubernetes.io/instance: ingress-nginx
    app.kubernetes.io/managed-by: Helm
    app.kubernetes.io/name: ingress-nginx
    app.kubernetes.io/part-of: ingress-nginx
    app.kubernetes.io/version: 1.12.1
    release: kube-prometheus-stack
  name: ingress-nginx-controller
  namespace: ingress-nginx
spec:
  endpoints:
    - interval: 30s
      port: metrics
  metricRelabelings:
    - action: labeldrop
      # 🎯 Drop high-cardinality labels not used in dashboards
      regex: 'path|replicaset|controller_revision_hash|owner_name'

    - sourceLabels: [__name__]
      # 🎯 Drop unused NGINX metrics
      regex: 'nginx_ingress_controller_(connections|requests_per_host|admission_.*|orphan_ingress|leader_election_status|check_.*|requests_per_host|top_504_errors_by_host)'
      action: drop

    - sourceLabels: [__name__]
      # 🎯 Drop unused histogram metrics (keep only request duration buckets)
      regex: 'nginx_ingress_controller_(response_duration_seconds_.*|connect_duration_seconds_.*|header_duration_seconds_.*|bytes_sent_.*)'
      action: drop

  namespaceSelector:
    matchNames:
      - ingress-nginx
  selector:
    matchLabels:
      app.kubernetes.io/component: controller
      app.kubernetes.io/instance: ingress-nginx
      app.kubernetes.io/name: ingress-nginx
After the changes rolled out, we immediately saw a drop in Prometheus memory usage:
We have improved our memory.
This directly reflects the working memory consumption of Prometheus. Before optimization, memory usage was in the 52–60 GB range — a significant improvement.
avg_over_time(process_resident_memory_bytes{job="prometheus"}[5m])The result:
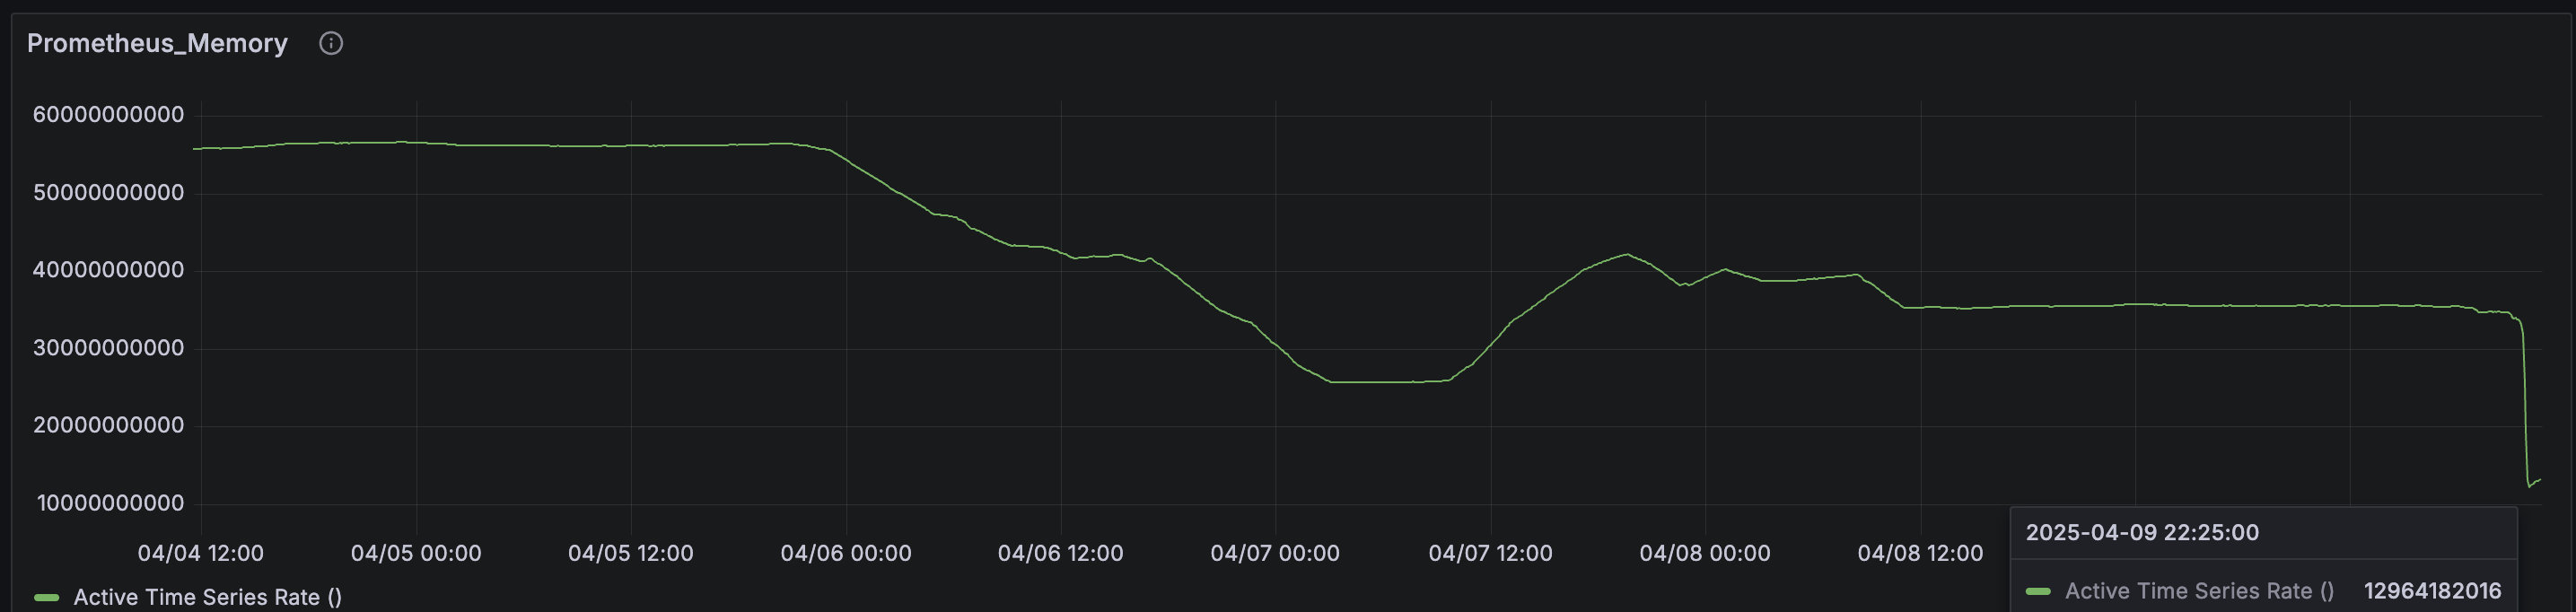
Dropped from almost 60GB to 18-25GB!
The following metric shows the number of active time series held in memory at any given time:
avg_over_time(prometheus_tsdb_head_series{job="prometheus"}[1h])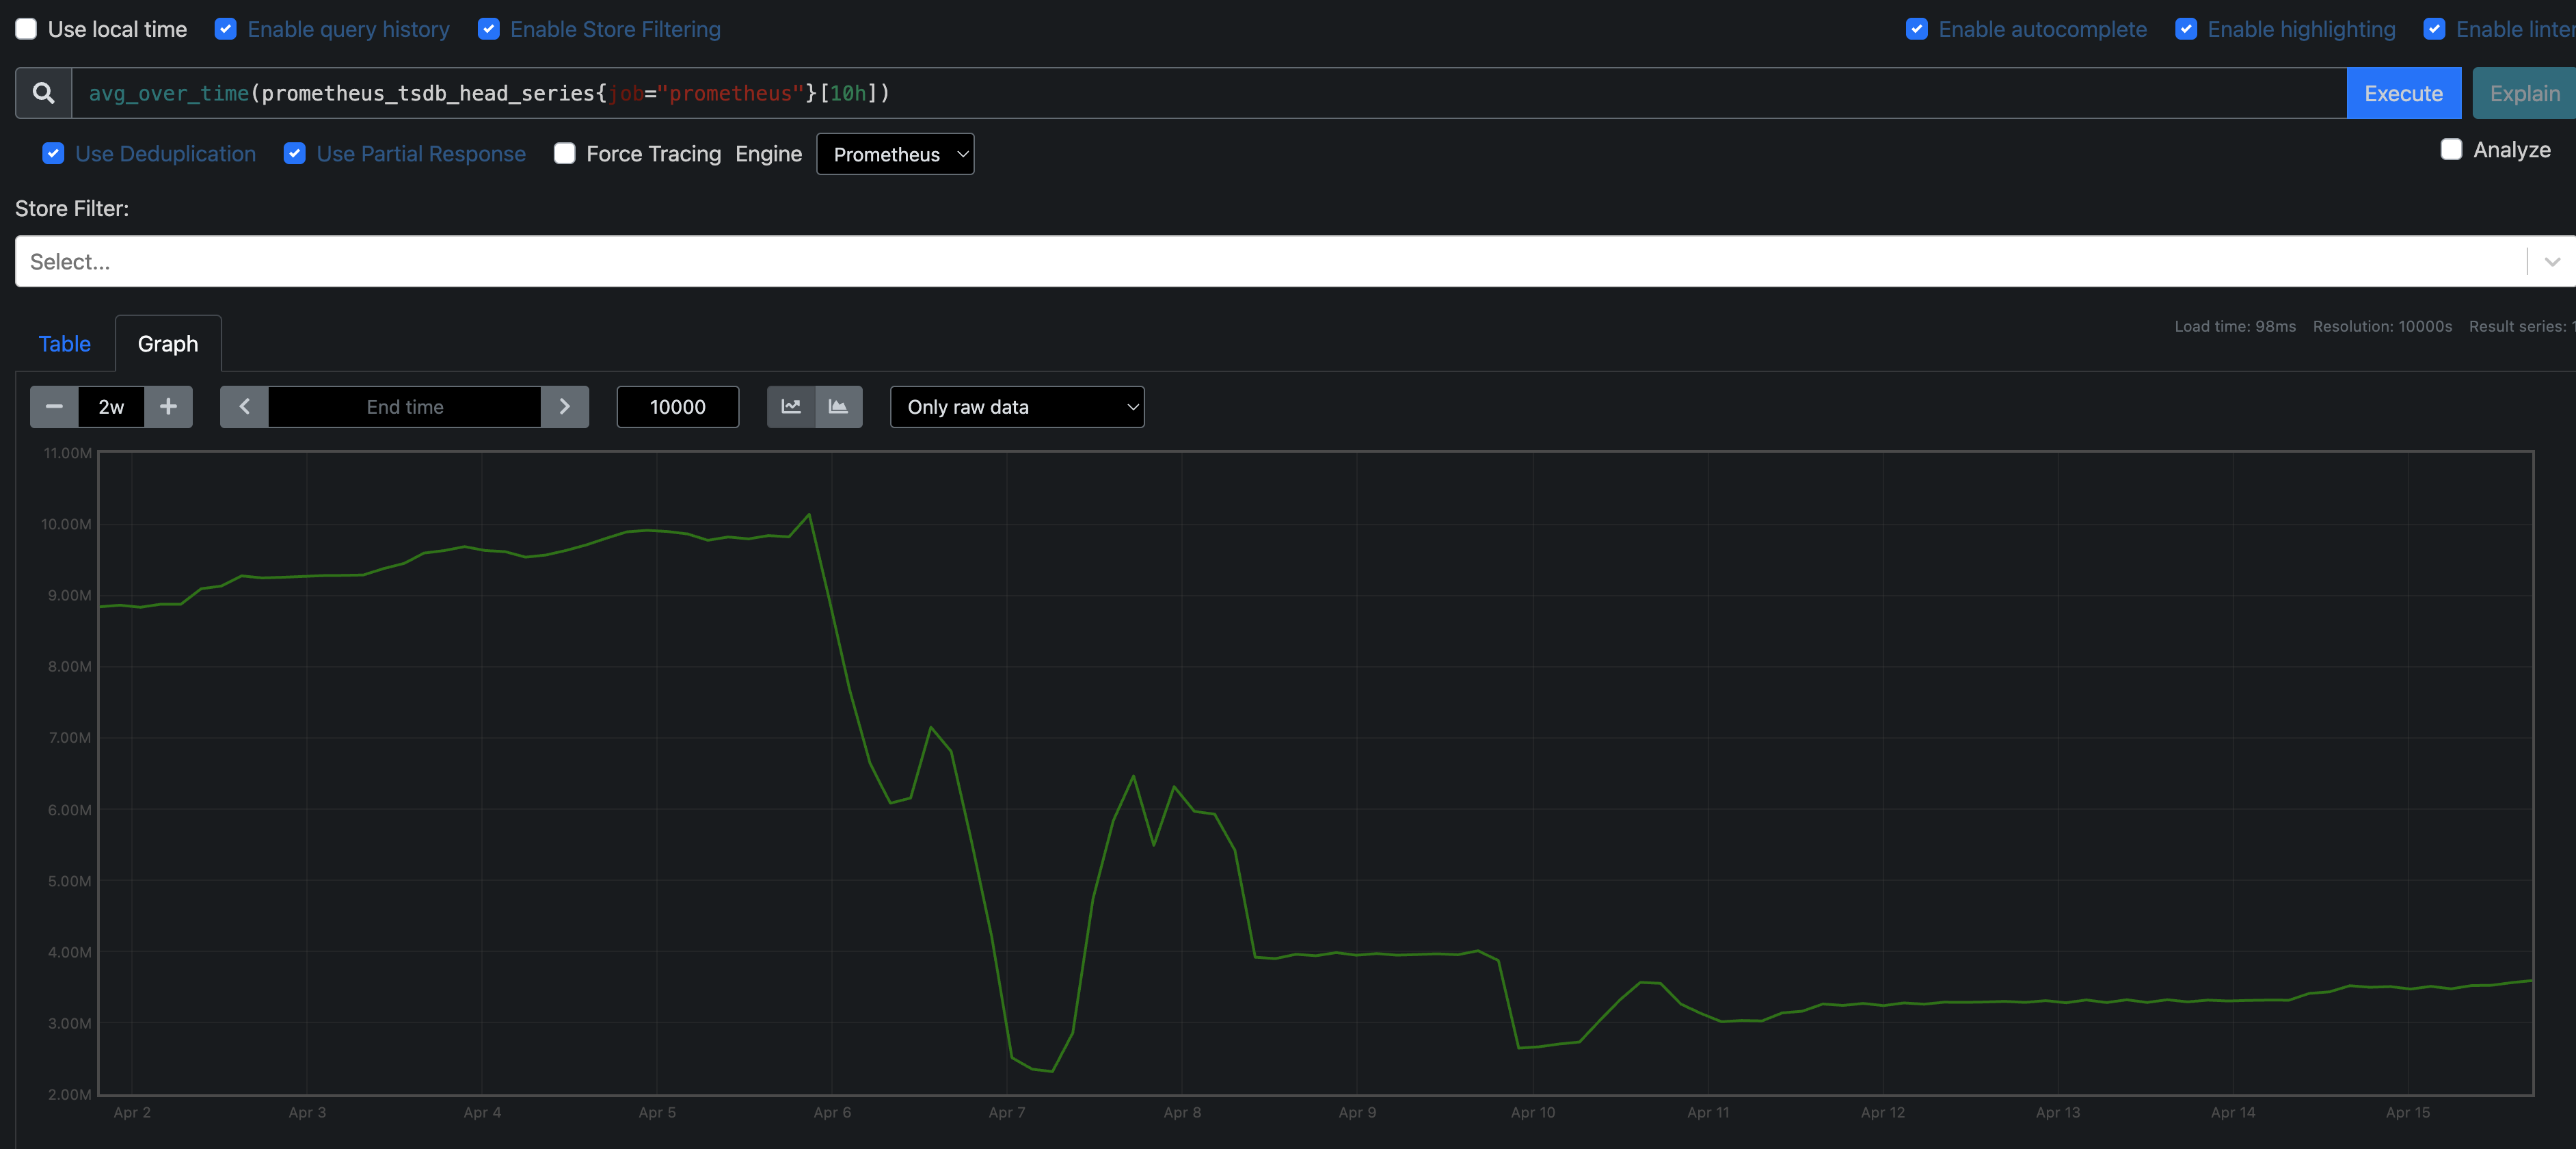 Dropped from around 10 million to < 4 million
To avoid breaking the dashboards or alerts when optimizing Prometheus memory usage, it’s critical to know what’s actually being used.
I’ve built two scripts to make this process safe and simple:
You can find the tool on GitHub here:
🔗 metrics-labels-extractor-from-prometheus
get_all_dashboards.pyThe first script does the following:
$ python get_all_dashboards.py
✅ Saved dashboards metadata to dashboards.json
Fetching dashboard: Platform - Kubernetes Namespaces (UID: k8ns001)
Fetching dashboard: Platform - Node Health (UID: node001)
Fetching dashboard: Platform - NGINX Metrics (UID: ngx002)
Fetching dashboard: Platform - Prometheus Usage (UID: prom002)
Fetching dashboard: Services - Web Traffic Stats (UID: web003)
Fetching dashboard: Services - Windows Infrastructure (UID: win004)
Fetching dashboard: Services - Pod Resources (UID: pod005)
Fetching dashboard: Cluster - Overview Dashboard (UID: clst006)
Fetching dashboard: Storage - Redis Overview (UID: red007)

✅ Extracted 340 PromQL queries.
💾 Saved to grafana_promql_queries.txt

Do you want to get a specific metric from the queries? (y/n): y
Enter the metric name: nginx
Found 26 queries with metric 'nginx':
💾 Saved to grafana_specific_metric.txt

Do you want to get alerts from AlertManager? (y/n): y
✅ Saved raw AlertManager alerts to alertmanager_alerts.json
✅ Full PromQL expressions written to alertmanager_promql_expressions.txt
✅ Cleaned up folder: grafana_dashboards
✅ Cleaned up file: alertmanager_alerts.json
The files will be saved in the results/ folder.
The tool also asks you a question if you want to check a specific metric.
When you specify a word, for example, typing nginx as I did, the script will match all metrics that contain that keyword. The more specific your input, the more precise the metric match will be.
Example Output if just specifying nginx word:
Platform Ops - Kubernetes Namespaces: sum by (status) (rate(nginx_ingress_controller_requests{status=~"2..|3..|4..|5..", exported_namespace=~"$namespace", exported_service=~"app-crm-$namespace-svc"}[$__rate_interval]))
Platform Ops - Kubernetes Namespaces: sum by(status) (increase(nginx_ingress_controller_requests{status=~"4..|5..", exported_namespace=~"$namespace", exported_service=~"app-crm-$namespace-svc"}[$__rate_interval]))
Gateway Team - NGINX Ingress Controller: round(sum(irate(nginx_ingress_controller_requests{controller_pod=~"$controller",controller_class=~"$controller_class",namespace=~"$namespace"}[2m])), 0.001)
Gateway Team - NGINX Ingress Controller: sum(avg_over_time(nginx_ingress_controller_nginx_process_connections{controller_pod=~"$controller",controller_class=~"$controller_class",controller_namespace=~"$namespace",state="active"}[2m]))
Gateway Team - NGINX Ingress Controller: sum(rate(nginx_ingress_controller_requests{controller_pod=~"$controller",controller_class=~"$controller_class",namespace=~"$namespace",status!~"[4-5].*"}[2m])) / sum(rate(nginx_ingress_controller_requests{controller_pod=~"$controller",controller_class=~"$controller_class",namespace=~"$namespace"}[2m]))
Gateway Team - NGINX Ingress Controller: avg(irate(nginx_ingress_controller_success{controller_pod=~"$controller",controller_class=~"$controller_class",controller_namespace=~"$namespace"}[1m])) * 60
Gateway Team - NGINX Ingress Controller: count(nginx_ingress_controller_config_last_reload_successful{controller_pod=~"$controller",controller_namespace=~"$namespace"} == 0)
Gateway Team - NGINX Ingress Controller: round(sum(irate(nginx_ingress_controller_requests{controller_pod=~"$controller",controller_class=~"$controller_class",controller_namespace=~"$namespace",exported_namespace=~"$exported_namespace",ingress=~"$ingress"}[2m])) by (ingress), 0.001)
Gateway Team - NGINX Ingress Controller: sum(rate(nginx_ingress_controller_requests{controller_pod=~"$controller",controller_class=~"$controller_class",namespace=~"$namespace",exported_namespace=~"$exported_namespace",ingress=~"$ingress",status!~"[4-5].*cardinality_analysis_script.pyTo reduce Prometheus memory usage, we need to identify high-cardinality metrics that aren’t actively used in dashboards or alerting.
The cardinality_analysis_script.py performs this analysis and depends on the results from get_all_dashboards.py, which extracts all PromQL queries from Grafana dashboards and optionally from AlertManager rules.
Verifies that Prometheus is healthy and queryable.
Fetches the top n highest-cardinality metrics via PromQL.
For each metric, it:
Analyzes the number of time series (series_count)
Lists the label keys, their cardinality (number of unique values), and whether they’re in use
Checks if the metric is used in:
Any dashboard queries (grafana)
Any alert rules (alertmanager)
A specific metric filter file from script 1 (specific)
$ python cardinality_analysis_script.py
Prometheus is healthy. Proceeding with cardinality analysis...
Fetching top 10 high-cardinality metrics via PromQL...
Analyzing labels for 440004 series...
Found 17 unique labels.
...

High-cardinality metrics in use:
nginx_ingress_controller_request_duration_seconds_bucket: 439980 series - ✅ USED (grafana, specific)
nginx_ingress_controller_request_size_bucket: 403315 series - ❌ UNUSED (not used)
...

💾 Saved metric summary to results/metric_cardinality_summary.json
Output example:
metric_cardinality_summary.json
This file contains detailed information about each high-cardinality metric:
{
  "metric": "nginx_ingress_controller_request_duration_seconds_bucket",
  "series_count": 439980,
  "in_use": true,
  "used_in": ["grafana", "specific"],
  "labels": {
    "host": {
      "cardinality": 1104,
      "in_use": false
    },
    "status": {
      "cardinality": 27,
      "in_use": true
    }
  }
}
Each entry represents a high-cardinality metric and contains several fields that help us understand its impact and relevance.
The metric field contains the name of the Prometheus metric being analyzed.
The series_count indicates how many unique time series are associated with this metric. A high value here can significantly contribute to memory consumption.
The in_use field tells you whether this metric is actively used, either in Grafana dashboards, AlertManager alerting rules, or in the specific metric queries you chose to inspect.
The used_in list details exactly where the metric was found. If it includes "grafana", the metric appears in at least one Grafana dashboard. If it includes "alertmanager", it is used in an alert rule. "specific" refers to a match against the subset of queries filtered by a keyword or metric name in the first script.
The labels object contains information about each label associated with the metric. For each label:
The cardinality tells you how many unique values that label takes across all time series.
The in_use flag indicates whether this label is used in any PromQL expression from your dashboards or alerts.
This structured view allows us to quickly spot which metrics and labels are contributing to high memory usage but may not be actively used, helping you prune them without affecting the observability stack.
One way to reduce real-time query stress is through recording rules, which compute and store frequently used queries.
record: job:nginx_requests:rate1m
expr: rate(nginx_ingress_controller_requests[1m])
This approach lowers memory usage during dashboard and alert evaluations by avoiding live computation of heavy expressions.
These settings helped further reduce memory and disk usage:
storage.tsdb.retention.time: 15d
storage.tsdb.retention.size: 20GB
storage.tsdb.wal-compression: true
What they do:
Shorter retention (retention.time): Keeps fewer data blocks in TSDB, reducing both memory pressure (from active blocks) and disk usage.
Storage cap (retention.size): Enforces a disk usage ceiling — Prometheus deletes older data once this limit is hit.
WAL compression: Compresses write-ahead log entries, saving disk I/O and improving memory efficiency during WAL replay.
additionalArgs:
  - name: storage.tsdb.min-block-duration
    value: 1h
  - name: storage.tsdb.max-block-duration
    value: 2h
Smaller block durations allow faster compaction and lower memory peaks during ingestion-heavy periods.
· Cardinality is costly: Histogram metrics + dynamic labels = memory chaos
· Smarter scraping > more scraping: Collect only what you need
· Recording rules and retention tuning go a long way in preventing bloated Prometheus instances
· Service discovery noise matters: Disabling redundant pod-level scraping was key
We brought our Prometheus memory usage down by ~ 50% through targeted drop of metrics and labels not been used. We haven't experienced any major feature loss.
This kind of cleanup is critical before scaling your monitoring stack.
Aleksandro Matejic, a Cloud Architect, began working in the IT industry over 20 years ago as a technical specialist, right after his studies. Since then, he has worked in various large companies and industries in various system engineer and IT architect roles. He currently works on designing Cloud solutions, Kubernetes, and other DevOps technologies.
此内容由惯性聚合(RSS阅读器)自动聚合整理,仅供阅读参考。 原文来自 — 版权归原作者所有。