


惯性聚合 高效追踪和阅读你感兴趣的博客、新闻、科技资讯
阅读原文 在惯性聚合中打开

推荐订阅源

freeCodeCamp Programming Tutorials: Python, JavaScript, Git & More
cs.AI updates on arXiv.org
雷峰网
雷峰网
博客园 - 叶小钗
C
Check Point Blog
F
Fortinet All Blogs
A
About on SuperTechFans
Y
Y Combinator Blog
Vercel News
Vercel News
IT之家
IT之家
V
V2EX
T
Tailwind CSS Blog
Cyber Security Advisories - MS-ISAC
The GitHub Blog
The GitHub Blog
Jina AI
Jina AI
Blog — PlanetScale
Blog — PlanetScale
罗磊的独立博客
云风的 BLOG
云风的 BLOG
U
Unit 42
博客园_首页
量子位
M
MIT News - Artificial intelligence
G
Google Developers Blog
小众软件
小众软件
N
Netflix TechBlog - Medium
P
Palo Alto Networks Blog
S
Schneier on Security
T
Tor Project blog
F
Full Disclosure
C
Cyber Attacks, Cyber Crime and Cyber Security
T
Tenable Blog
T
The Blog of Author Tim Ferriss
Spread Privacy
Spread Privacy
Engineering at Meta
Engineering at Meta
GbyAI
GbyAI
Microsoft Azure Blog
Google DeepMind News
T
Threat Research - Cisco Blogs
Know Your Adversary
Know Your Adversary
P
Proofpoint News Feed
Security Latest
Security Latest
D
Darknet – Hacking Tools, Hacker News & Cyber Security
博客园 - 司徒正美
AWS News Blog
AWS News Blog
Simon Willison's Weblog
Recorded Future
Recorded Future
L
Lohrmann on Cybersecurity
I
Intezer
L
LangChain Blog
L
LINUX DO - 热门话题

VictoriaMetrics: Simple & Reliable Monitoring for Everyone on VictoriaMetrics

Operator now has Long-Term Support (LTS) version Multi-tiered Observability: A Practical Way to Handle Diverse Workloads VictoriaMetrics April 2026 Ecosystem Updates Not All Telemetry Requires Premium Pricing VictoriaMetrics at KubeCon Amsterdam: Community Highlights What's new in VictoriaMetrics Anomaly Detection (Q1 2026) What's New in VictoriaMetrics Cloud Q1 2026? Logs, MCP Server, Better Alerting, and... a Secret Project VictoriaMetrics at KubeCon: Optimizing Tail Sampling in OpenTelemetry with Retroactive Sampling VictoriaMetrics March 2026 Ecosystem Updates Observability Lessons From OpenAI Benchmarking Kubernetes Log Collectors: vlagent, Vector, Fluent Bit, OpenTelemetry Collector, and more VictoriaMetrics February 2026 Ecosystem Updates VictoriaMetrics at FOSDEM, Cloud Native Days France, and CfgMgmtCamp Ghent VictoriaLogs in VictoriaMetrics Cloud: Fast, Cost-Effective Log Management is Here What’s new in VictoriaMetrics Anomaly Detection (2025) VictoriaMetrics January 2026 Ecosystem Updates VictoriaLogs Basics: What You Need to Know, with Examples & Visuals Vibe coding tools observability with VictoriaMetrics Stack and OpenTelemetry How a US Software Provider Improved Traffic Alerting with VictoriaMetrics Anomaly Detection VictoriaMetrics 2025 Developer Experience: A Year in Review Spotify’s performance & control across large monitoring environments with VictoriaMetrics VictoriaMetrics Achieves Red Hat OpenShift Operator Certification Our latest updates across the VictoriaMetrics Observability ecosystem New Capacity Tiers in VictoriaMetrics Cloud Announcing 1B+ Downloads & Product Development With Logs, Traces, Metrics AI Agents Observability with OpenTelemetry and the VictoriaMetrics Stack Discarding gRPC-Go: The Story Behind OTLP/gRPC Support in VictoriaTraces What's New in VictoriaMetrics Cloud Q3 2025? From new region in Asia to proactive alerts How DreamHost Slashed Memory Usage by 80% and Scaled to 76 Million Time Series Upcoming Conferences & Meetups: Where to Meet Our Team VictoriaMetrics Long-Term Support (LTS): H2 2025 Update Creating a Sustainable Open Source Business Model - Introduction Full-Stack Observability with VictoriaMetrics in the OTel Demo Alerting Best Practices vmanomaly Deep Dive: Smarter Alerting with AI (Tech Talk Companion) VictoriaLogs Practical Ingestion Guide for Message, Time and Streams Monotonic and Wall Clock Time in the Go time package Hello Singapore! VictoriaMetrics Cloud Expands to Asia Pacific MCP Server Integration & Much More: What's New in VictoriaMetrics Cloud Q2 2025 FIPS 140-3 Compatible Builds for VictoriaMetrics Enterprise Components VictoriaLogs Unleashed: Cluster Version Now Available for Exceptional, Linear Scaling Integrations made easy with VictoriaMetrics Cloud Developer's Note: Research on Distributed Tracing, Comparing With Tempo and ClickHouse vmagent: Key Features Explained in Under 15 Minutes Go synctest: Solving Flaky Tests vmalert: Maximize Your Monitoring (Tech Talk Companion) Celebrating 14K Stars on GitHub: Spring Update vmalert: Maximize Your Monitoring VictoriaMetrics Connects with the Open Source Community at LinuxFest Northwest 2025 Graceful Shutdown in Go: Practical Patterns VictoriaLogs: Gaps, Gains & Growth Prometheus Monitoring: Functions, Subqueries, Operators, and Modifiers VictoriaMetrics Cloud: What's New in Q1 2025? Don’t default to microservices: You’ll thank us later! Container CPU Requests & Limits Explained with GOMAXPROCS Tuning gRPC in Go: Streaming RPCs, Interceptors, and Metadata From Chaos to Clarity with VictoriaLogs Prometheus Alerting 101: Rules, Recording Rules, and Alertmanager Heading to London: Meet Our Team at KubeCon Europe 2025 Inside vmselect: The Query Processing Engine of VictoriaMetrics Meet Our Team at Scale 22x Practical Protobuf - From Basic to Best Practices VictoriaLogs Status Update: Heading Towards the Cluster Version 24th of February 2025 Statement: VictoriaMetrics Stands with Ukraine! Prometheus Metrics Explained: Counters, Gauges, Histograms & Summaries Prometheus Monitoring: Instant Queries and Range Queries Explained 300%+ Growth in 2024: Join Our Team in 2025! FOSDEM 2025 recap How Protobuf Works—The Art of Data Encoding OpenTelemetry, Prometheus, and More: Which Is Better for Metrics Collection and Propagation? How vmstorage Handles Query Requests From vmselect How vmstorage's IndexDB Works VictoriaMetrics Tech Talk Stream: A Deep Dive into Blackbox Monitoring How HTTP/2 Works and How to Enable It in Go VictoriaMetrics Cloud: What's New in Q4 2024? How vmstorage Processes Data: Retention, Merging, Deduplication,... How vmstorage Handles Data Ingestion From vminsert When Metrics Meet vminsert: A Data-Delivery Story From net/rpc to gRPC in Go Applications VictoriaMetrics helps IHI Terrasun Win Big in Vegas on $1.2B Clean Energy Project Piros | VictoriaMetrics Partner Allenta | VictoriaMetrics Partner CloudRaft | VictoriaMetrics Partner Sensedia & VictoriaMetrics: API-compatible Efficient Storage Scalable Prometheus: Why DSV Chose VictoriaMetrics Sensor Factory | VictoriaMetrics Partner Erythix | VictoriaMetrics Partner Groove X & VictoriaMetrics: Faster Device Health Monitoring Scaled & Performant Monitoring at Spotify with VictoriaMetrics Grammarly & VictoriaMetrics: 10× Lower Costs & Direct Access Zelarsoft | VictoriaMetrics Partner DFKI & VictoriaMetrics: Efficient Long-Term Metric Storage Niubits | VictoriaMetrics Partner Megazone Cloud | VictoriaMetrics Partner Cogito Software | VictoriaMetrics Partner Bajau | VictoriaMetrics Partner Find Out Why Dig Security Chose VictoriaMetrics! Ness | VictoriaMetrics Partner Alpha Data | VictoriaMetrics Partner SIOS Technology | VictoriaMetrics Partner
What's New in VictoriaMetrics Cloud Q4 2025? New tiers, more deployment options, IaC and alerting rules.
Jose Gomez-Selles · 2026-01-13 · via VictoriaMetrics: Simple & Reliable Monitoring for Everyone on VictoriaMetrics

2025 has been quite a year! As we enter into 2026, we want to share all the great features that VictoriaMetrics Cloud has brought in the last quarter.

Remember that this Quarterly Live Update is available in video format as well here:

Let’s get to it!

New VictoriaMetrics Single Tiers

#

One of the main changes of this last quarter of 2025 has been the introduction of new Capacity Tiers for VictoriaMetrics Single type instances in VictoriaMetrics Cloud. In a nutshell, after a benchmarking exercise, we’ve adjusted our tiers so they follow a linear progression in computing power, quotas/limits and costs for our users. We believe this work gives more flexibility while easing the price model progression as users scale their Observability needs.
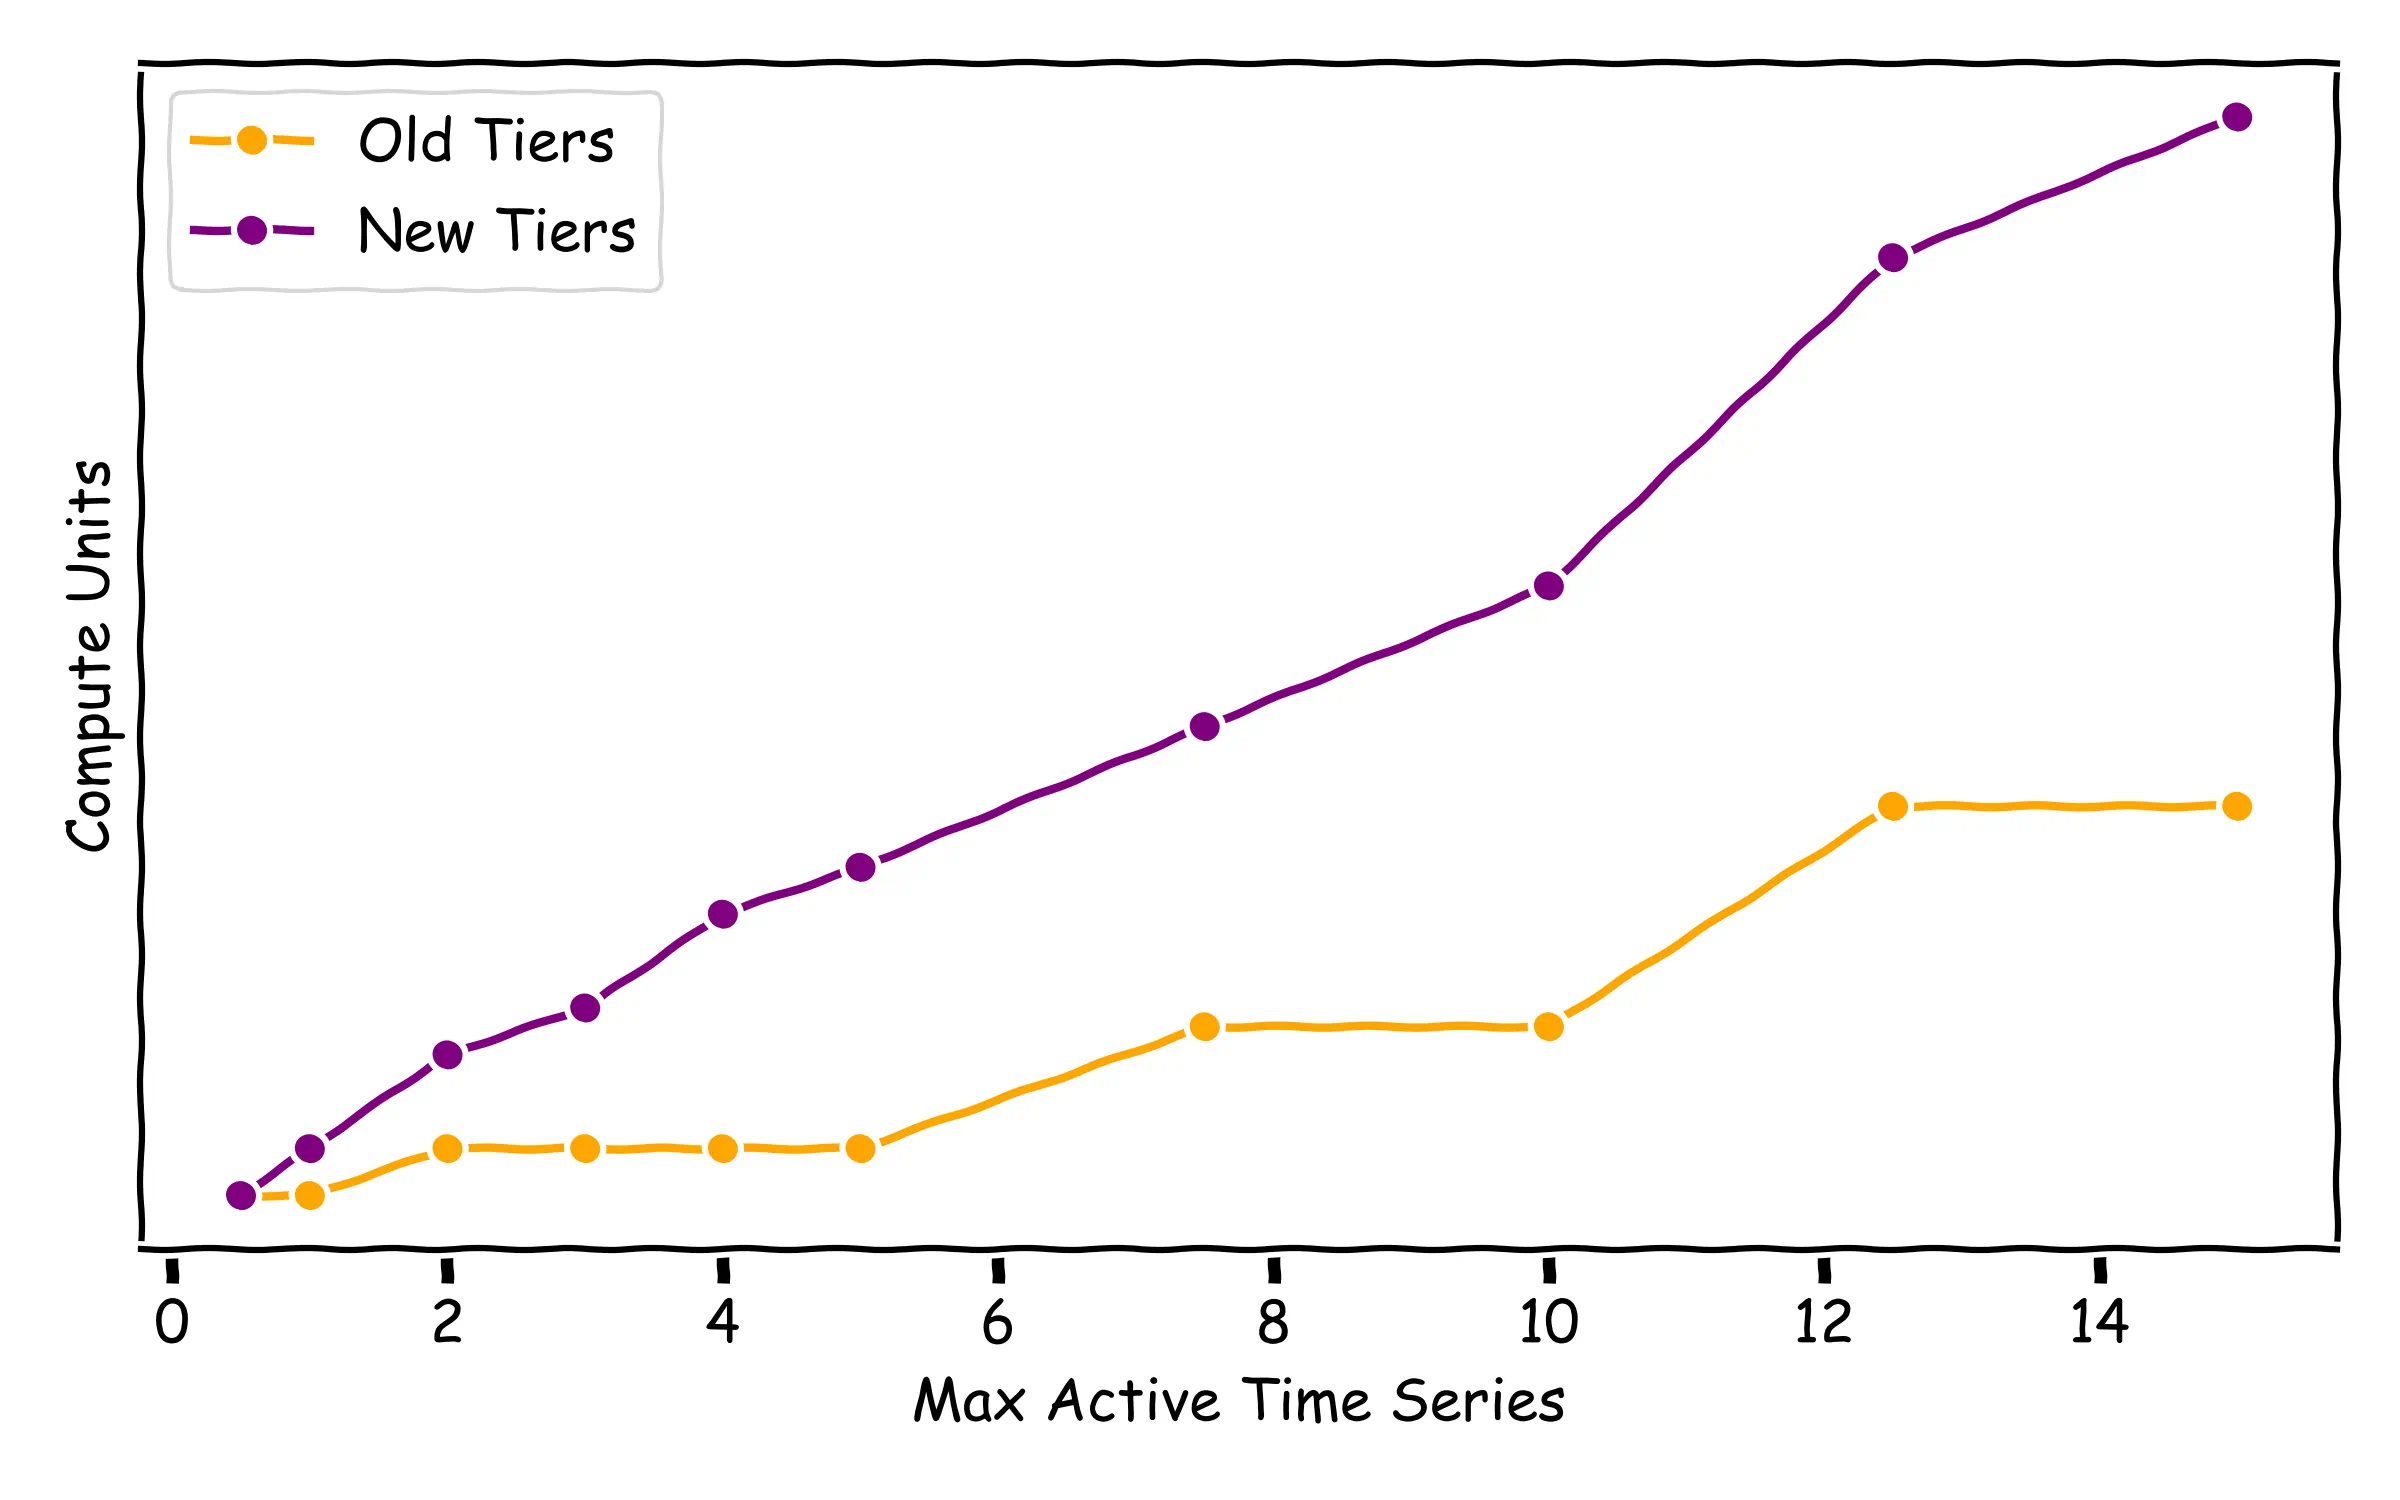
Apart from adding more power and adjusting prices, the UI for instance creation has been simplified and the benchmark results have been published.

For Cluster type deployments (which provide higher SLAs and multitenancy), the main change is that interested users can now open a request for a PoC in which our team will tailor an instance for their requirements, adapting to their needs.

Learn more about the new tiers in the full announcement here.

New US region available: us-east-1 (N.Virginia)

#

VictoriaMetrics Cloud keeps expanding thanks to the fact that more and more users are relying on our platform. It was not long ago that we opened a new region in Singapore, and now we are happily announcing that we are also open for business in the AWS us-east-1 (N.Virginia) region.

This region is special because it is one of the most used worldwide, and we definitely didn’t want to miss the party (with all the fun it entails)! We believe this is great news for those who are already in this region and want to benefit from AWS PrivateLink and lower latency for their observability data.
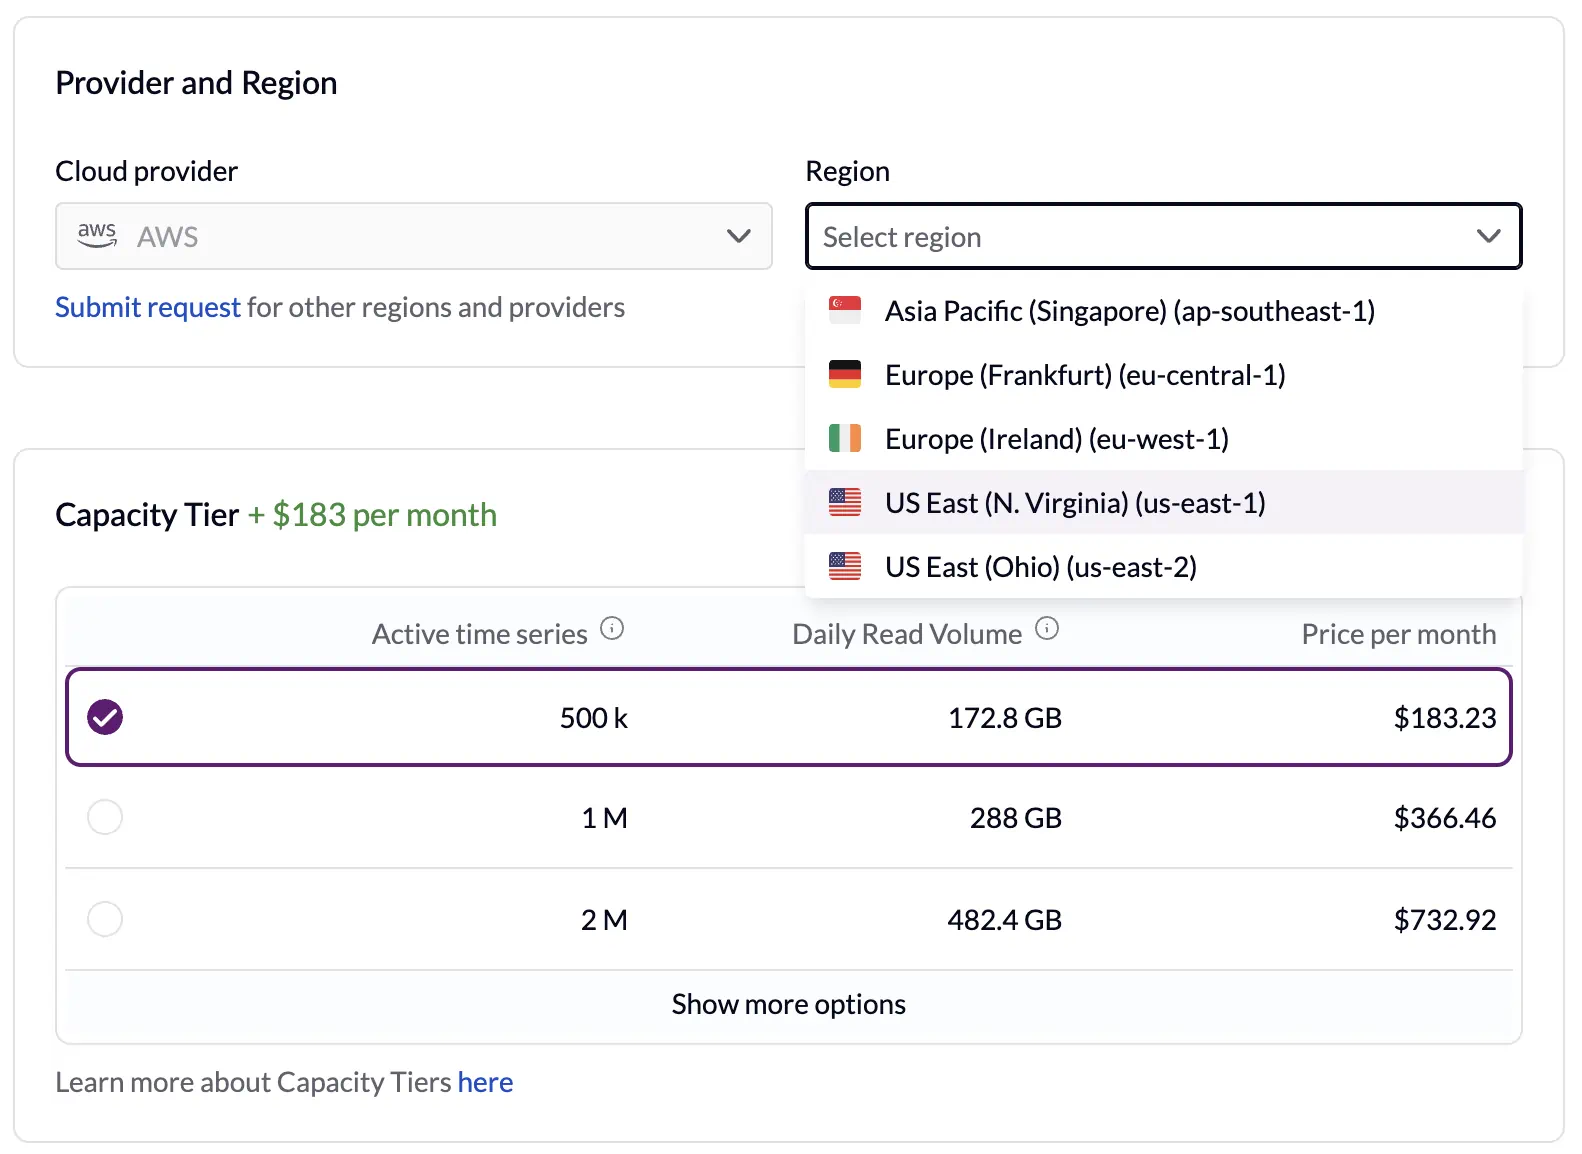
Feel free to give it a go whether you already are a VictoriaMetrics Cloud user, or are just considering VictoriaMetrics Cloud. In this case, let me kindly remind you that a simple Sign Up gives you a free trial for a month (without requiring you to add a payment method).

As usual, contact us if you’d like to see us in other regions!

Notification groups

#

We’ve been after improving our notifications system for quite a while now. That’s why we are very excited to rollout an improved system that helps your team stay informed about critical events, product updates, and account activities, while giving the ability to customize them within different groups. In this way, different users can define how (and what!) to get notified. Notifications are divided into the following interest groups:
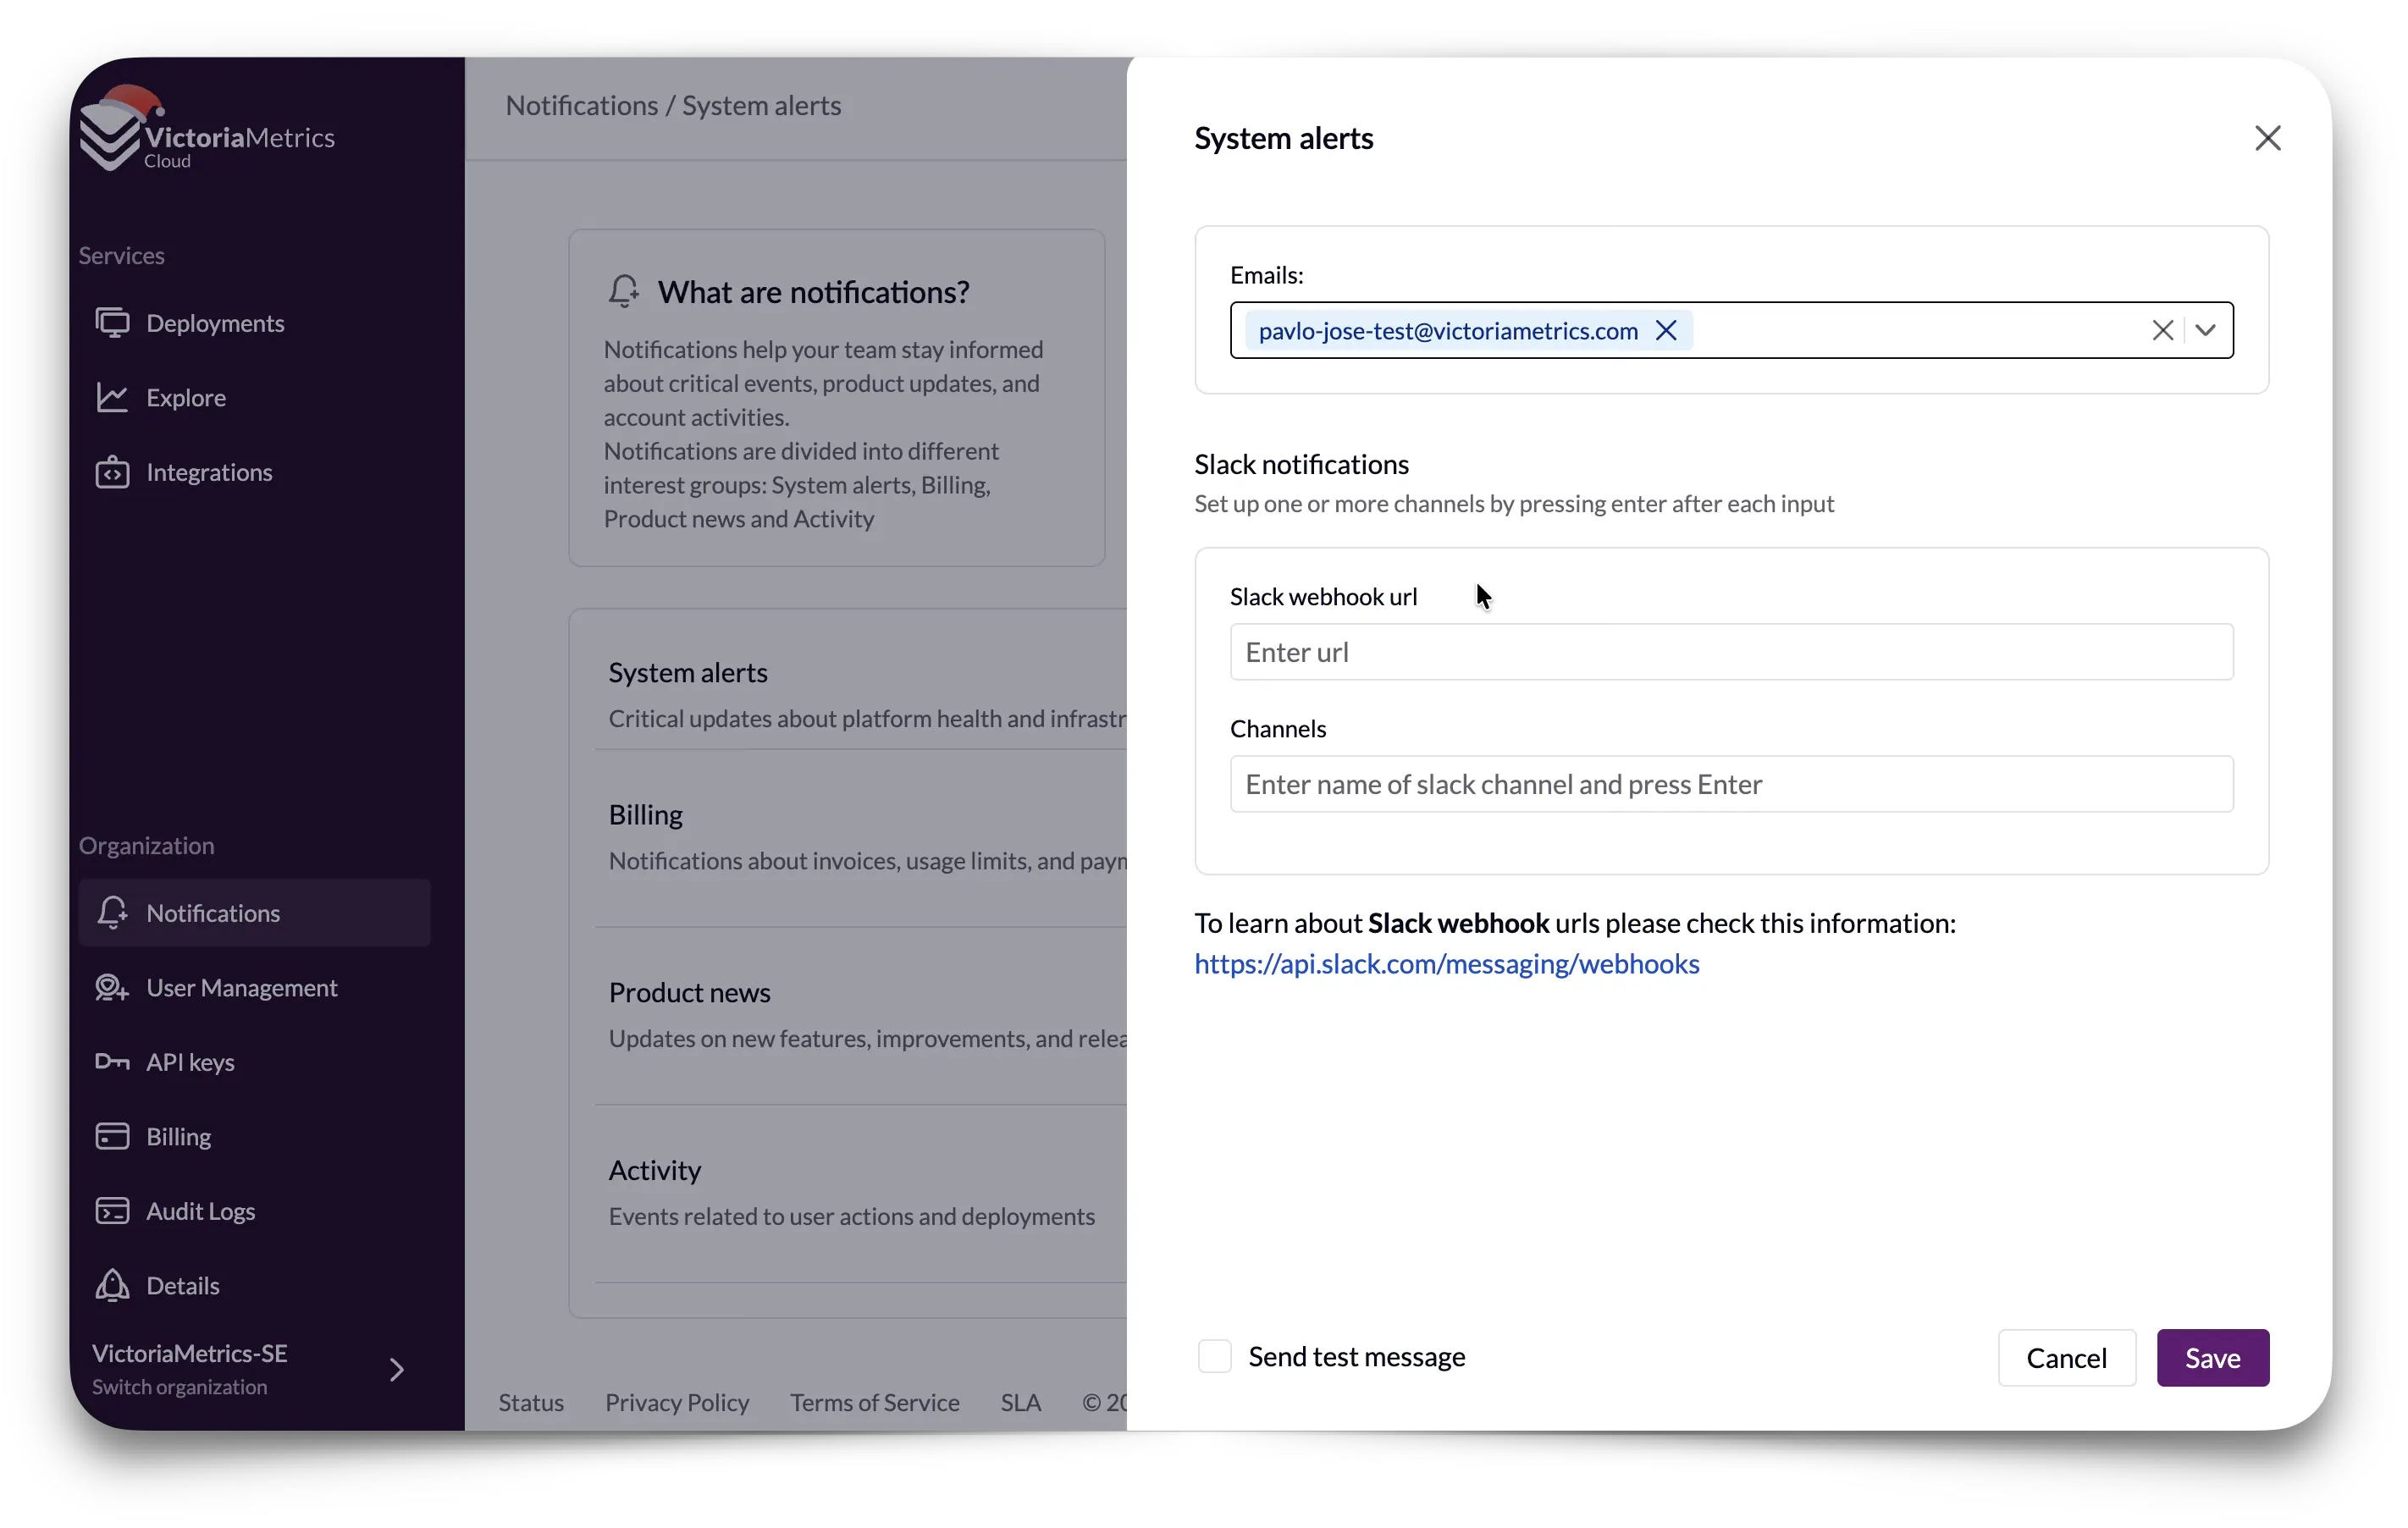
  • System alerts: for critical updates about platform health and infrastructure
  • Billing: is related to notifications about invoices, usage limits, and payment issues
  • Product News: updates on new features, improvements, and releases
  • Activity: events related to user actions and deployments

These categories can be used to define which updates and notifications are relevant to you, and set to which email addresses and/or slack channels you want to get your system alerts, at Organization or User level.

Terraform integration: more ways to automate your VictoriaMetrics Cloud instances

#

We do love automating our own actions and that’s why we’ve always wanted to help (and encourage) VictoriaMetrics Cloud users to do the same. Historically, the main way to do that has been via the API, (see our docs) and it’s been great to see how everyone has been using it. In case you haven’t tried it, check everything you can do, the Swagger way, here.

Not long ago we also made public the client library for the VictoriaMetrics Cloud API in go, which provides an idiomatic way to talk with the Product. Check how to integrate in the Github repo.

So what was left? Exactly, being part of the Terraform ecosystem!
Registry

#

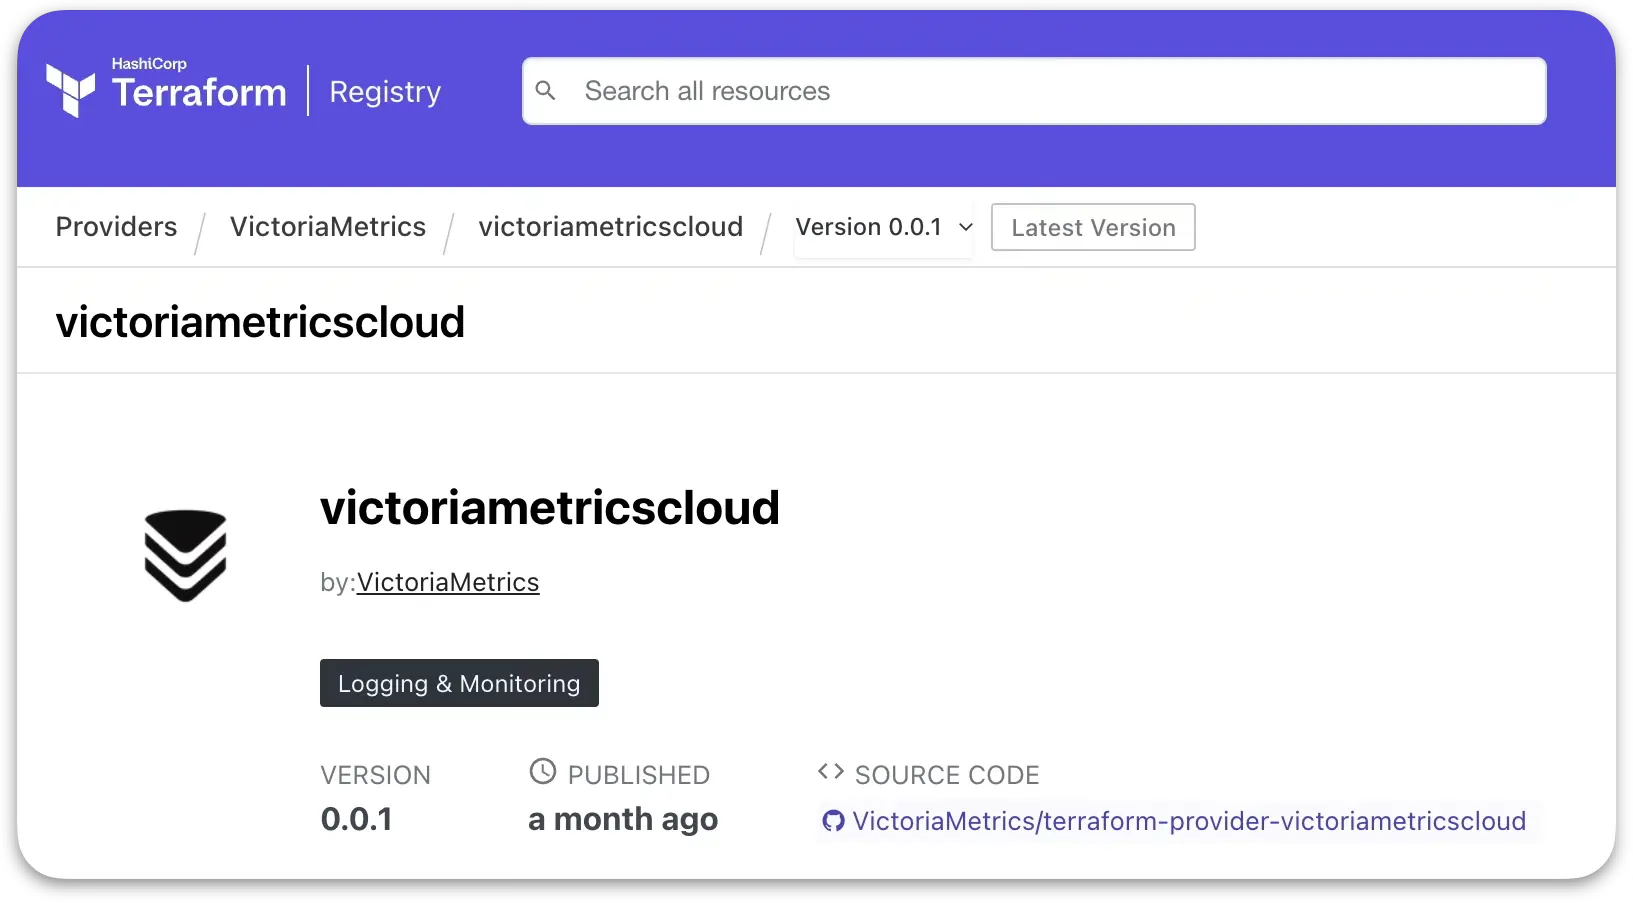
Since last December, our users can deploy and manage their instances via the VictoriaMetrics Cloud provider, available on the Terraform registry. With the implementation made Open Source, and available in this repository, this provider gives a wrapper of the mentioned VictoriaMetrics Cloud API that exposes all resources and data sources (deployments, access tokens, rules, regions…) so you can manage VictoriaMetrics Cloud as part of your Infrastructure as Code.

After saving your API key, this is all it takes for you to add the VictoriaMetrics Cloud provider to your configuration:

terraform {
  required_providers {
    victoriametricscloud = {
      source  = "VictoriaMetrics/victoriametricscloud"
      version = "0.0.1"
    }
  }
}

provider "victoriametricscloud" {
  api_key = var.api_key
}

Terraform Integration

#

But that’s not all. As usual, we wanted to guide users to easily integrate VictoriaMetrics Cloud with the terraform provider. Check out the integration page inside the product, or in the docs with the same embedded experience.

Integrations: New alerting rules

#

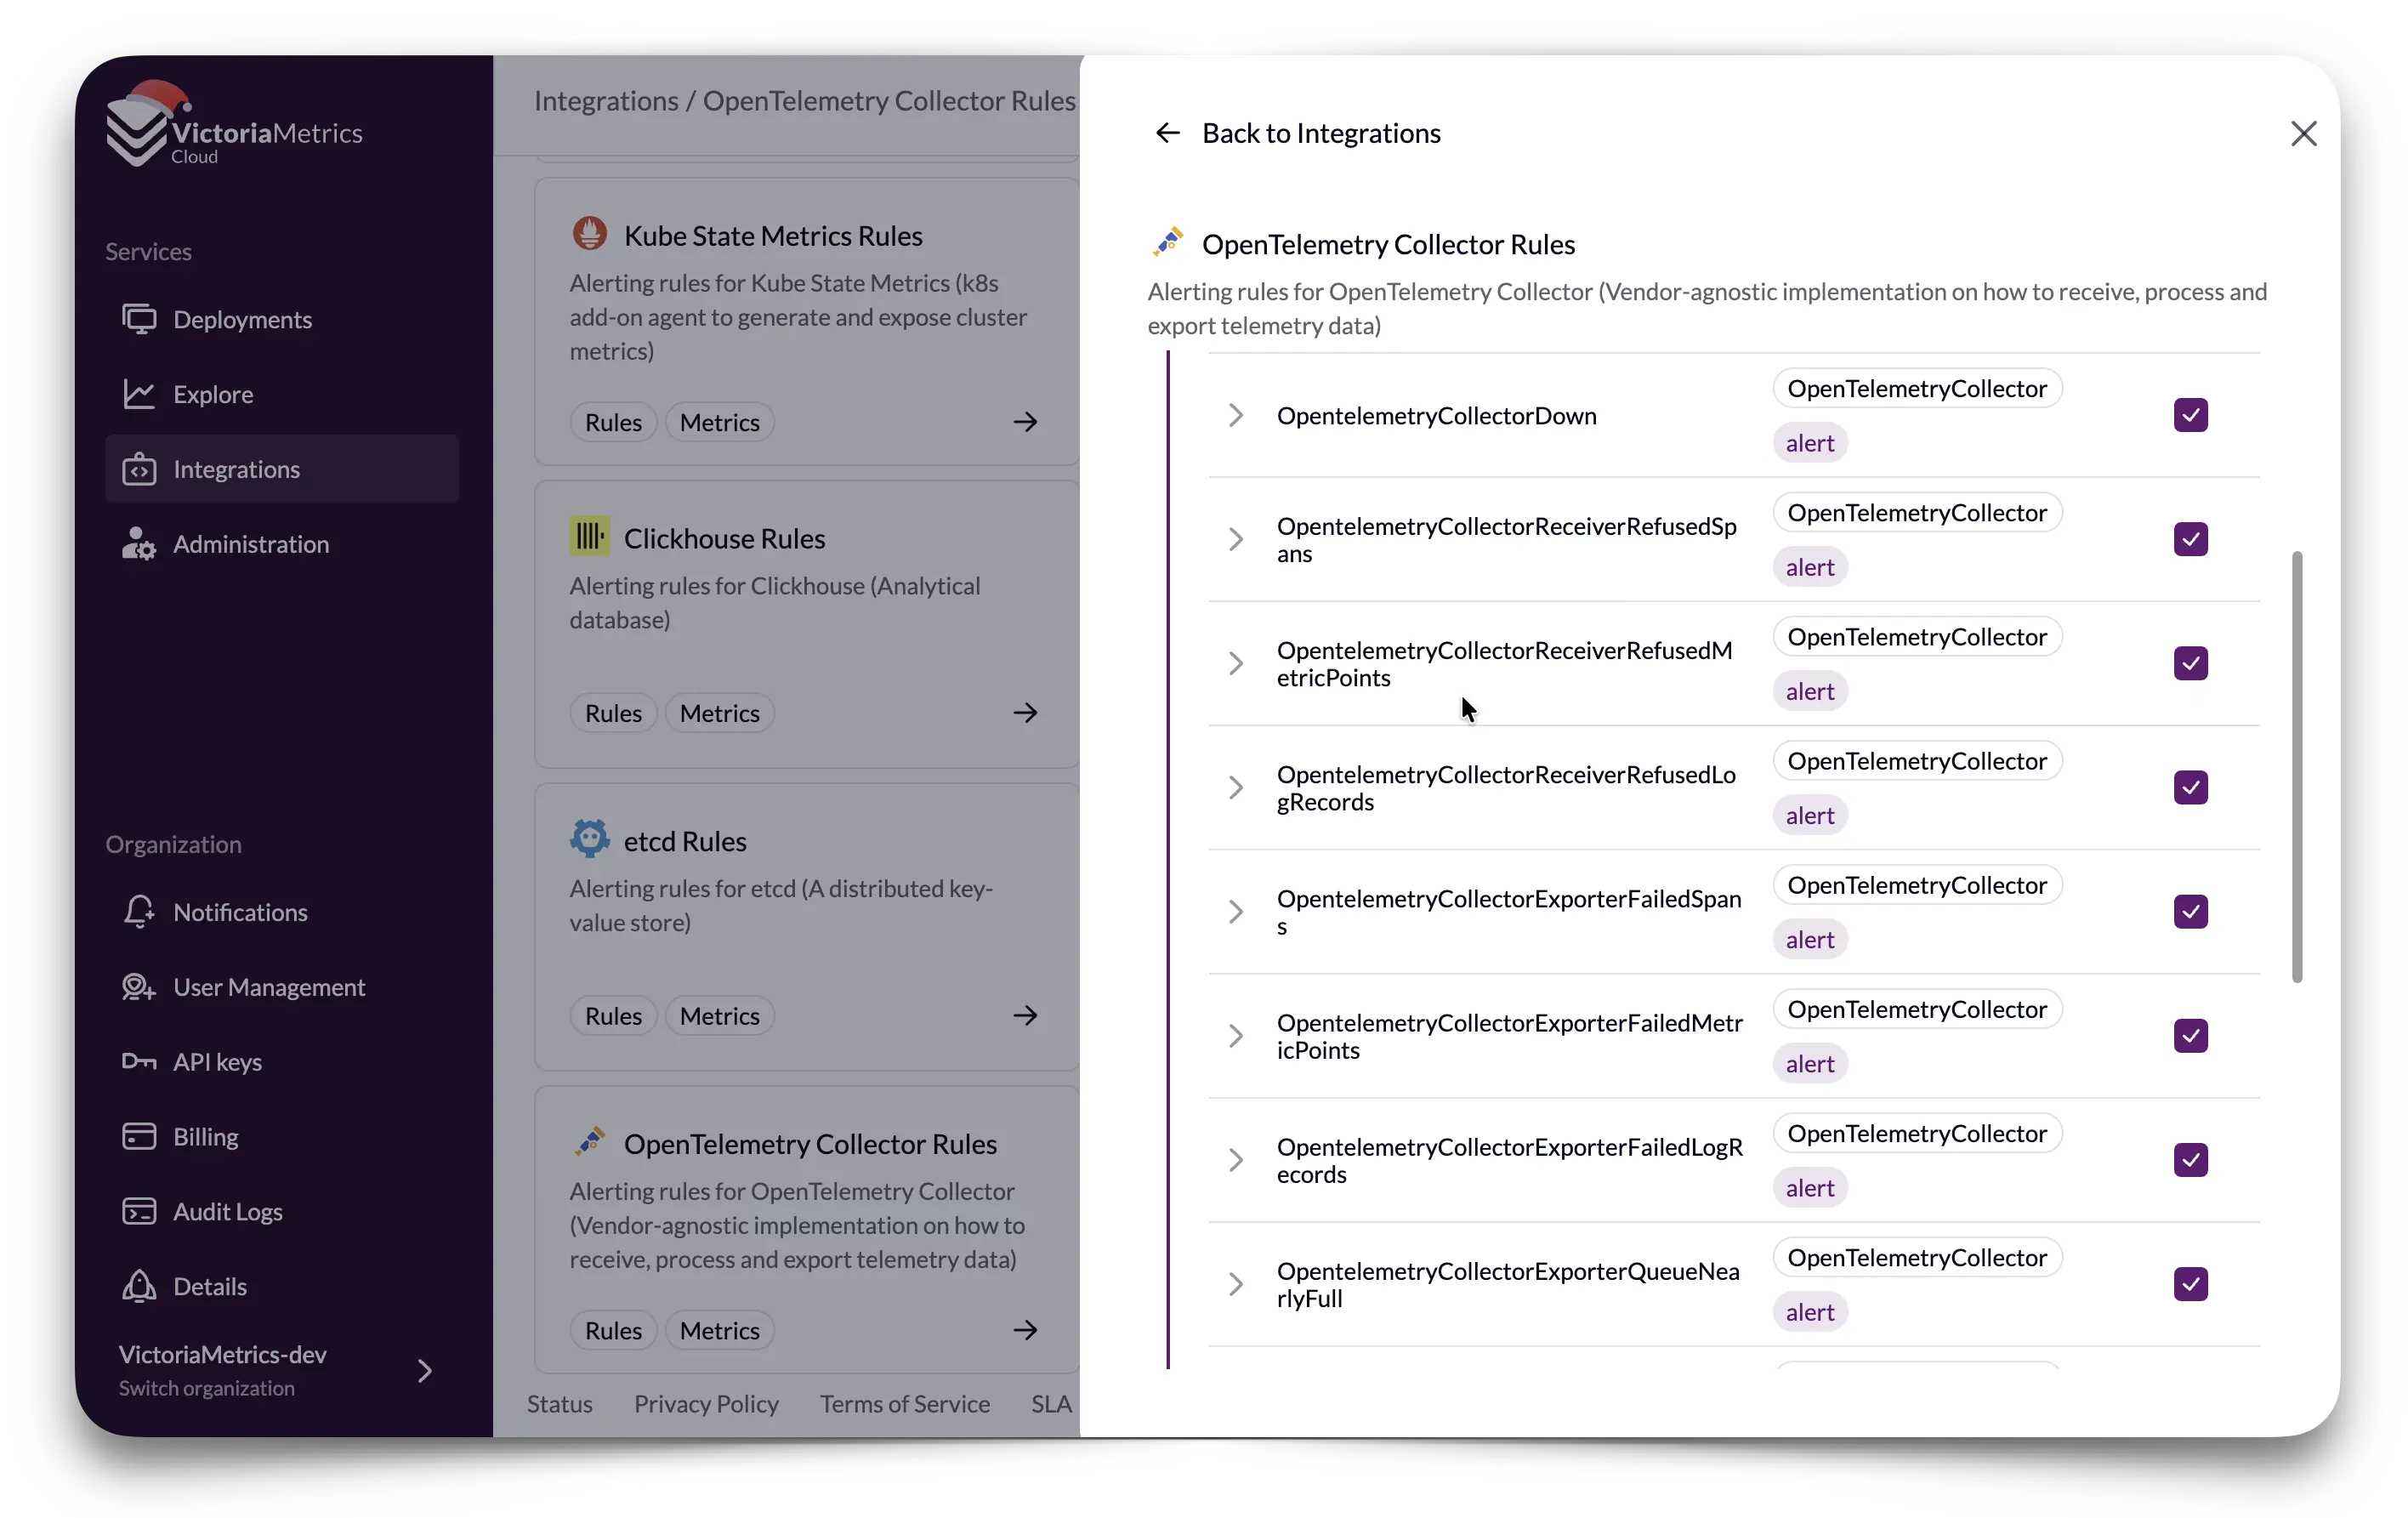
Following with integrations, our last main addition this quarter is the inclusion of 9 new Alerting Rules integrations. As with previous integrations of this kind, we are making it easier for those who want to get notified when something is wrong with their stack by importing more of the popular Awesome Prometheus Alerts into the integrations section.
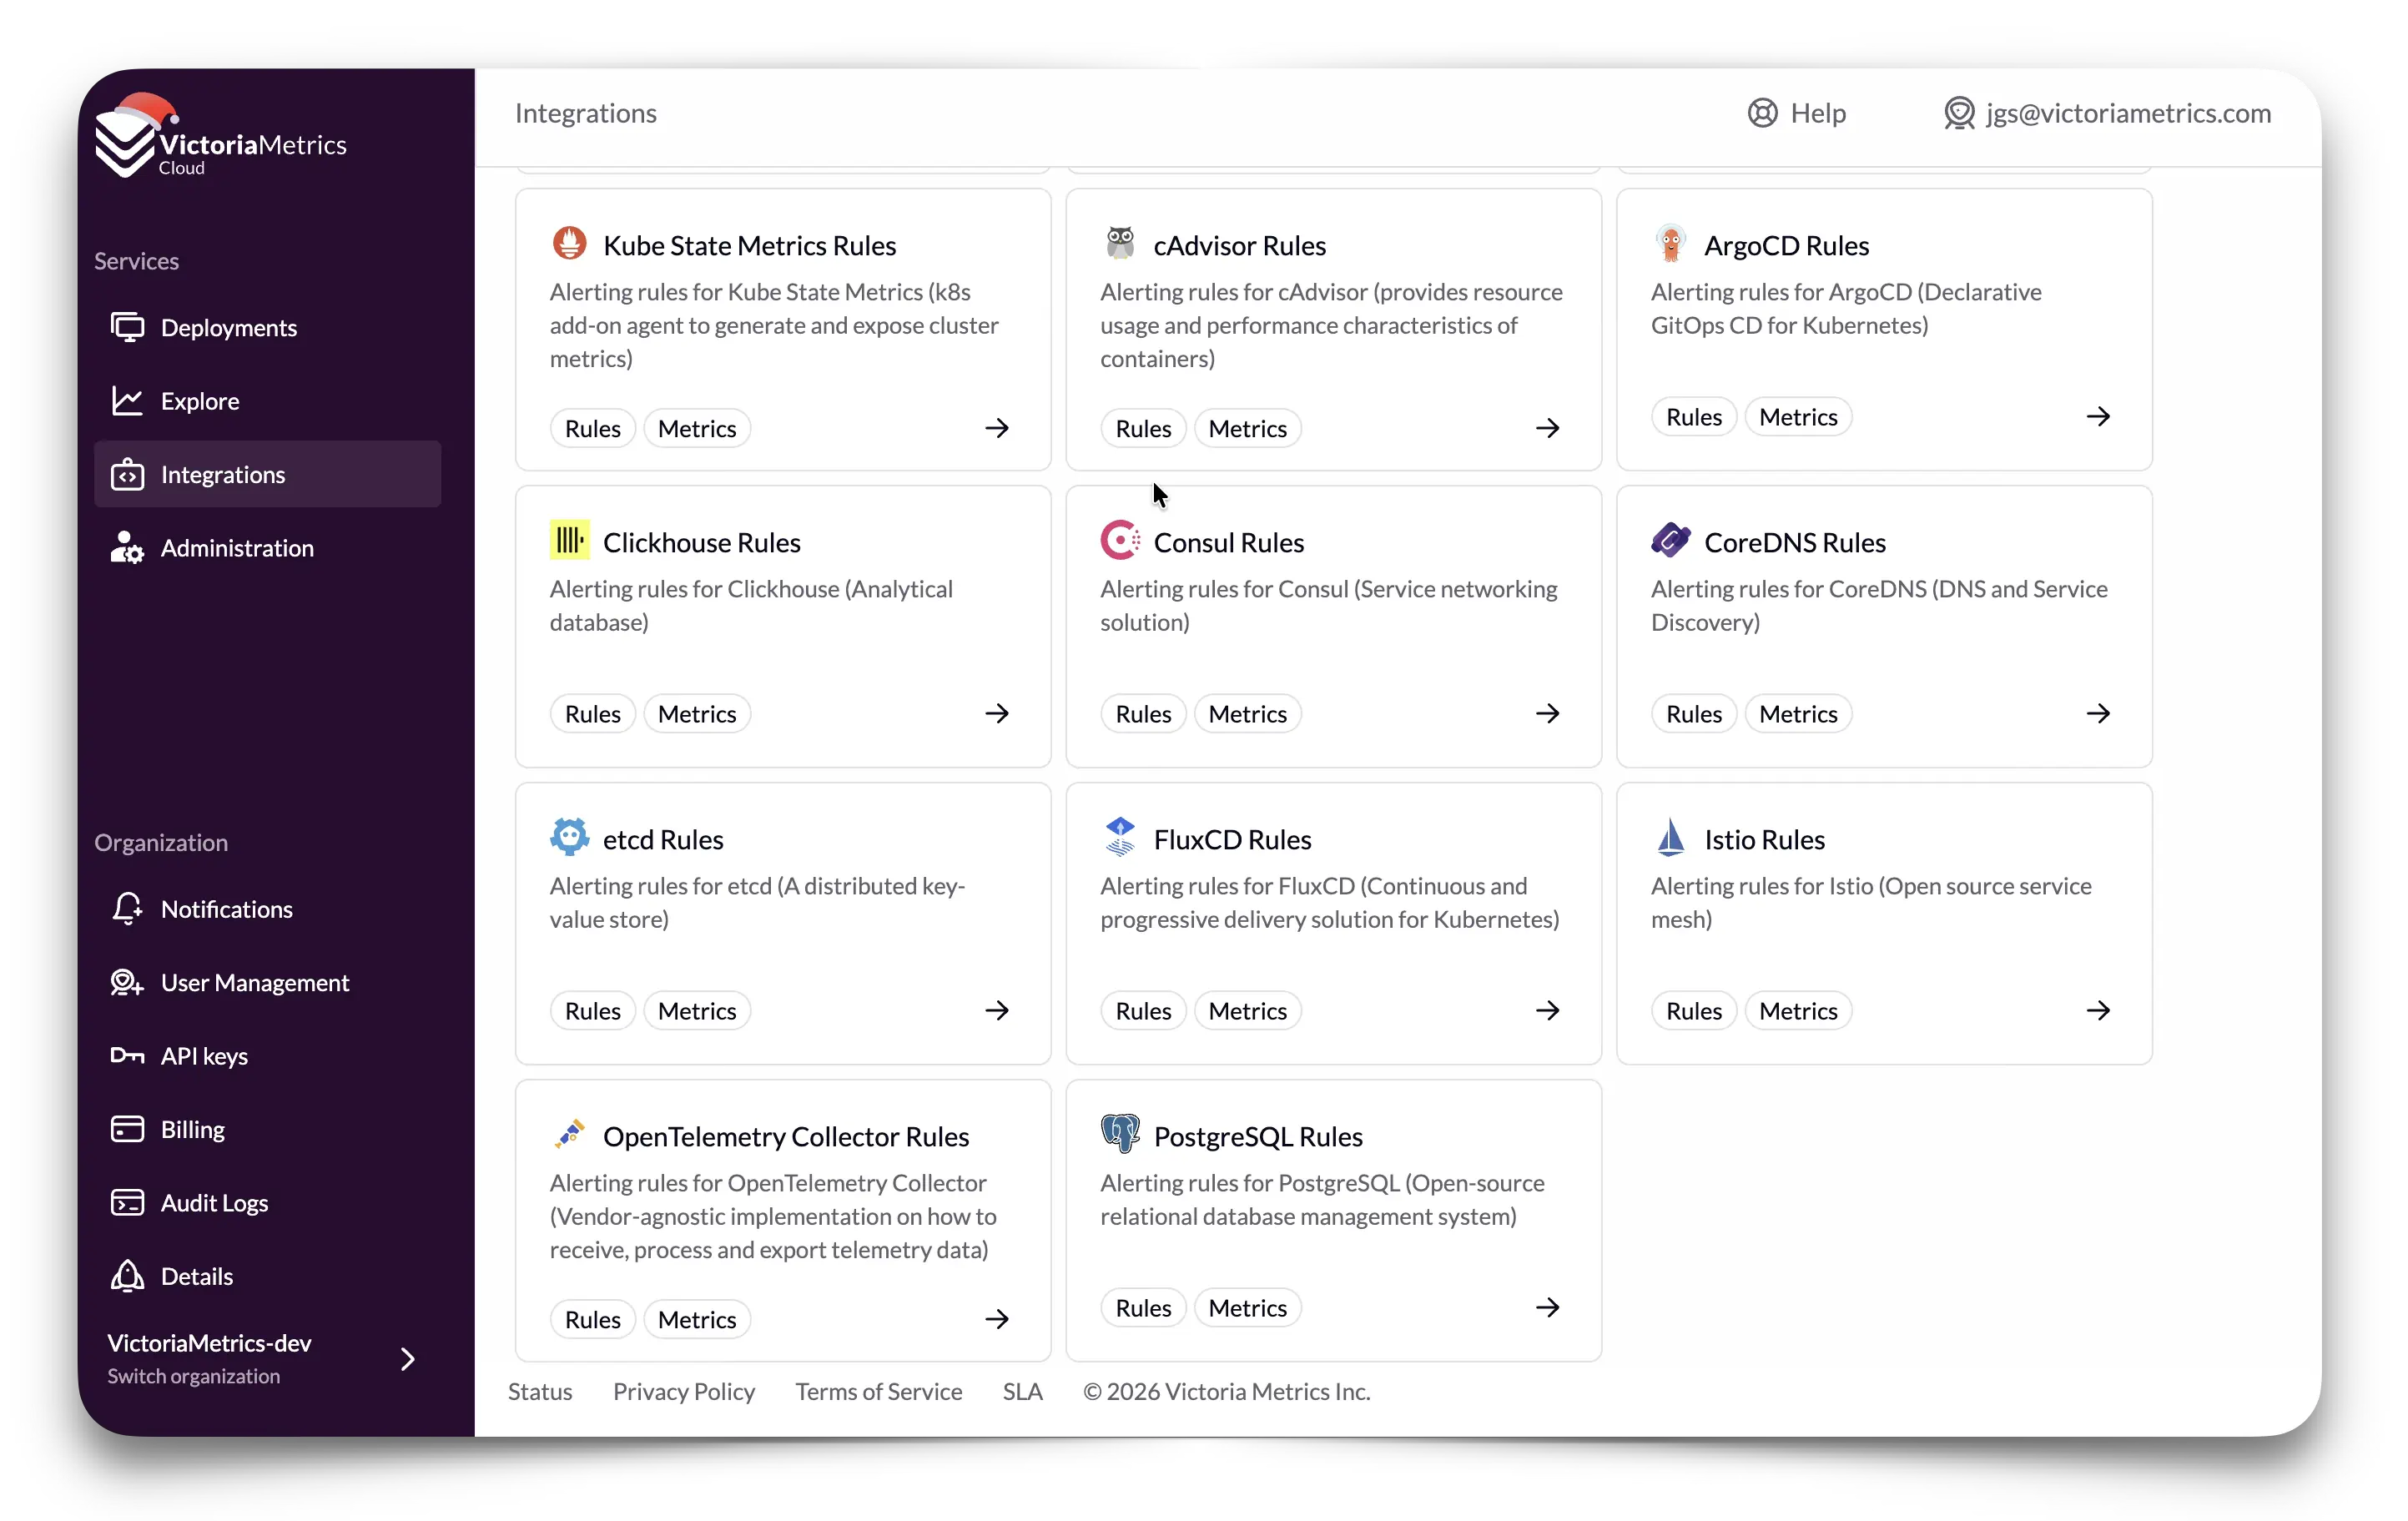
This time, users can benefit from getting out of the box alerting rules for:

  • CI/CD: ArgoCD, FluxCD
  • Observability agents: OpenTelemetry collector
  • Networking/Mesh: CoreDNS, Istio, Consul
  • Databases/storage: etcd, PostgreSQL, ClickHouse

As you can see, by picking from a list of alerts it’s much easier to plan for those situations that may get tricky. Of course, we recommend to only add those alerts that are important to you and actually actionable. This will avoid unnecessary fatigue, letting you focus on what matters, while being certain that you’ll get notified for important events.
Other Improvements

#

We don’t want to take more of your precious time, but this is not all. Among all these great features and additions we just commented, we have also been working on improving our resiliency, making upgrades across the platform, revising our Disaster Recovery procedures and adding more Scalability in some of our components.

There’s a new metric available for users in the Overview and Monitoring pages of every deployment: Data read rate. It shows the amount of data scanned per time unit, and represents the reading effort that the deployment is doing. While mostly influenced by the querying path, it also accounts for VictoriaMetrics periodic merges and deduplications. It took us some effort and discussions but we believe users will finally have a way to understand how their reading load impacts the system performance. This information will help to decide when upgrading or downgrading between tiers.

Other minor improvements include: Access Tokens enhancements in limits, the inclusion of the last usage time in the API and bug fixes. Organization Id is now available for hyperlinks, and new users can see now that higher quotas are automatically enabled upon subscription. Last but not least, we’ve also improved the user experience in Stripe card expiration notifications.

What’s Next?

#

We’re so excited to announce that VictoriaLogs is ready, as we’ve finalized the work on backups and tier definition. This means that in the following weeks you can expect VictoriaLogs being part of the VictoriaMetrics Cloud product. This wouldn’t have been possible without the feedback and help from our early adopters, so we want to publicly thank you for all your patience and meaningful reflections. Thanks to you all!

2026 is going to be a great year. See you soon!

And if you haven’t done it already, remember that there’s a free trial when you Sign up for VictoriaMetrics Cloud!