




Monitoring, in the context of software, is a catch-all term for visibility into infrastructure, or an application. It can encompass metrics, logs, traces, and any other telemetry data that provides information on a running application, server, or another device. Monitoring helps you catch problems before your customers do and speeds up the time to resolution for any problems that do slip through.
Managed monitoring is where another company runs part or all of your monitoring system. This outsources the complexity of running a monitoring system to experts that specialize in it. Managing your own monitoring system is complex and requires:
In this article, you’ll learn about the different types of managed monitoring services available on the market—and why you might consider picking one of them to manage your monitoring infrastructure.
There are many managed monitoring services out there, and picking one to use can be daunting. Services on the market exist on a spectrum, ranging from bare-bones to fully comprehensive. When deciding on which service to go for, there’s always a trade-off between the cost of a full-featured service and the engineering time required to build a system around a bare-bones service.
Making the decision of what managed monitoring service to use can be made easier by grouping the potential services and deciding which group might fit your organization best. In this section, we’ll group managed monitoring services and go over some pros and cons for each group.
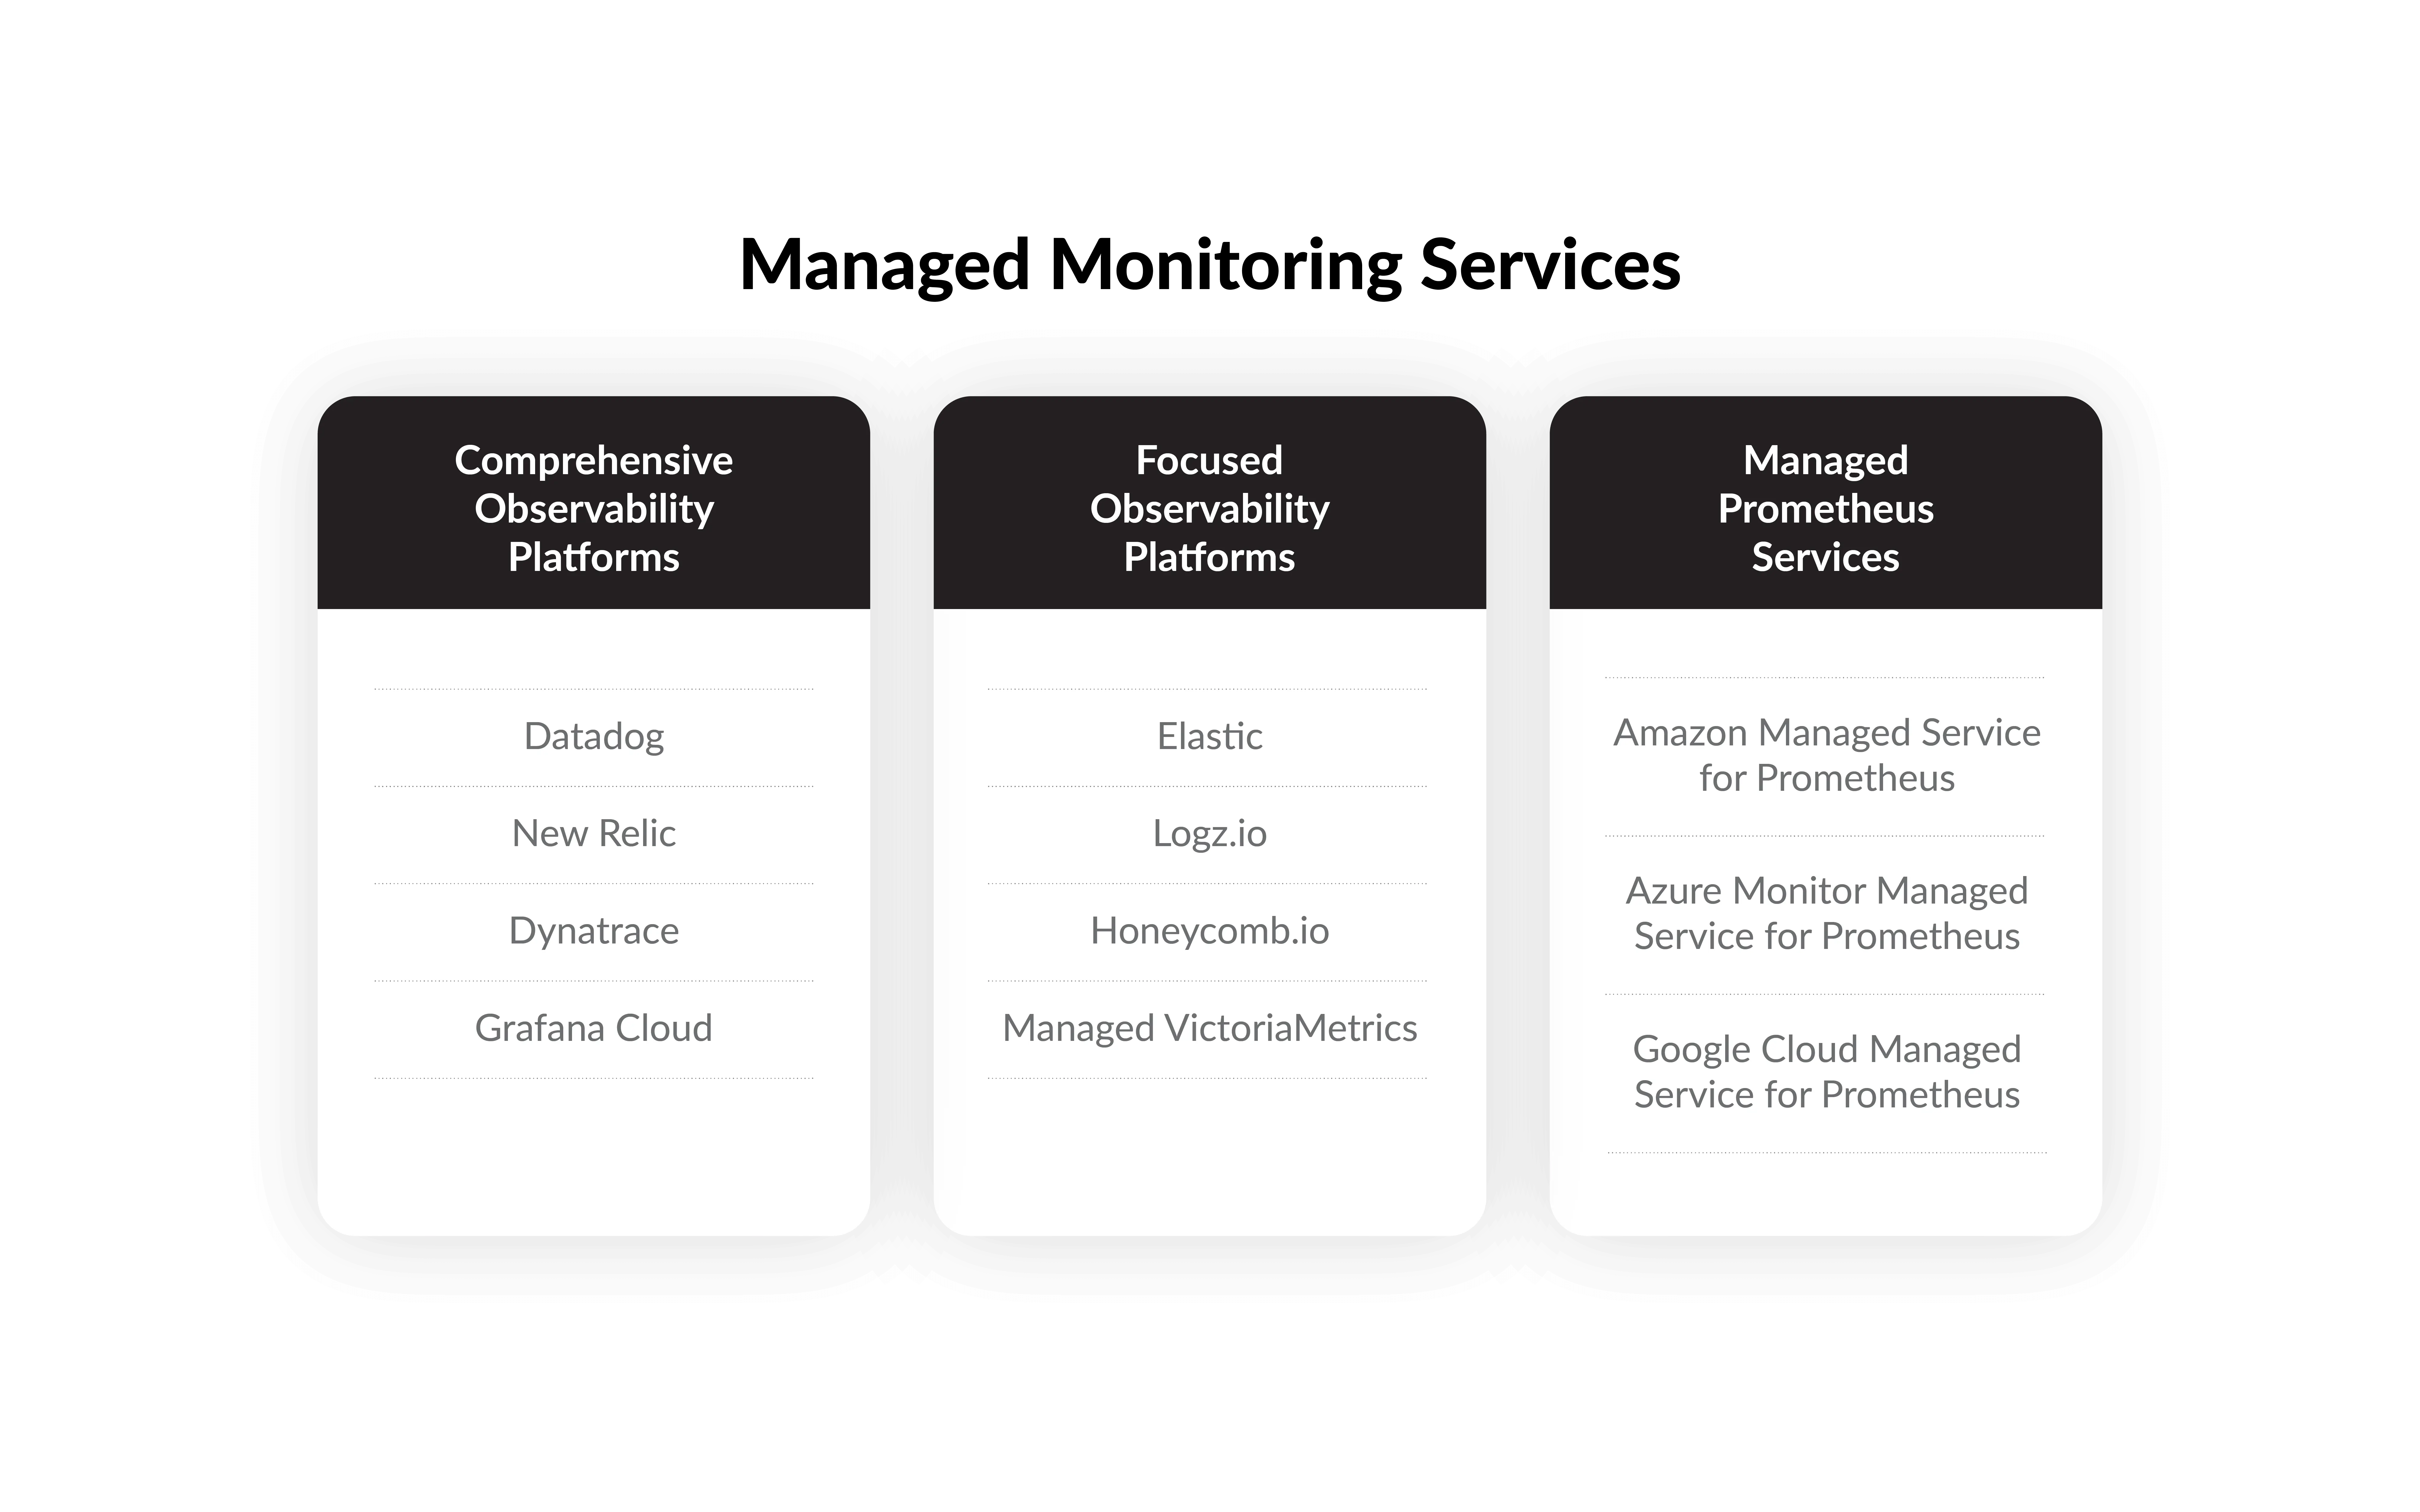
At the full-featured end of the managed monitoring spectrum sit the comprehensive observability platforms. These are services that go beyond recording logs, metrics, and performance tracing and provide more detailed insights and visualizations. For example, Datadog offers CI integration and simulated user flows alongside the core monitoring features.
Some example services in this group include:
These services come with lots of features, which is great for companies that either don’t have an existing monitoring solution or want to minimize the amount of internal engineering work required to run their monitoring.
On the other hand, comprehensive observability platforms are usually the most expensive managed monitoring services that you can use, and the pricing structures are rarely transparent. One Datadog user was famously hit with a $65M bill in 2022. What’s more, these services tend to act as closed ecosystems, making integrating with them, as well as migrating away from them in future, more difficult.
Sometimes you don’t need the bells and whistles of a comprehensive observability platform. Focused observability platforms still provide a managed service, but around only a few key features. For example, you may just get a managed ELK stack to handle your logs, metrics, and traces.
Some examples of services in this group include:
Focused observability platforms can provide a more affordable alternative to comprehensive observability platforms, with a more limited range of features. They can be a great option for teams that already run a certain technology internally and want to move to a managed model. Focused observability platforms are also a great option for organizations that are looking to save costs and aren’t sure they’ll need the features that more comprehensive platforms provide.
VictoriaMetrics Cloud is a focused observability platform that provides managed metrics storage and querying. It comes with a large number of integrations (Prometheus, Datadog, Grafana and more), and it provides a transparent pricing model built around VictoriaMetrics’ renowned resource efficiency.
The most bare-bones managed monitoring services on the market are the managed Prometheus services. These services just host and manage Prometheus for you. This provides the core of a monitoring infrastructure, but little more.
Some examples of services in this group include:
Services in this group are usually a little cheaper than services in the other groups and tend to be offered by large cloud providers. These services generally integrate well with the other offerings from these cloud providers and are a great choice for teams that are already in an ecosystem or that are looking to build some of their own infrastructure around monitoring.
On the other hand, services in this group are about as bare-bones as managed monitoring comes, and so if you don’t want to dedicate much engineering effort to your monitoring, then they may not be for you. The trade-off for the lower monthly price is higher implementation and maintenance costs for your engineers.
Most people would agree that monitoring is important, but whether to purchase a managed monitoring service or build your own is a more difficult call to make. One common misconception is that managed monitoring is more expensive, while build-your-own is cheaper. This can sometimes be true, but the picture is more complex than that.
There’s nothing worse than dealing with a massive outage while knowing very little about the system that has gone down. The majority of engineers don’t work with monitoring and observability every day, and so when the monitoring system goes down, it can be scary.
One advantage of opting for a managed monitoring service is that you are outsourcing the responsibility of keeping your monitoring running to engineers that build monitoring systems as a full-time job. This means that your system will go down less often, and when it does go down, the outage is likely to be fixed more quickly.
Having experienced engineers you can call on also makes a big difference when it comes to building out the system in the first place. When building your own monitoring system, you are likely building expertise at the same time. This can be rewarding for the engineers on the project, but also means that the project will take longer and lessons will have to be learned. Implementing a managed monitoring service, on the other hand, is routine for the company you purchase the service from and will go a lot smoother.
An easy trap to fall into is to think of infrastructure costs as just the costs of the servers that you run. This ignores the setup and subsequent maintenance time that your team needs to spend to keep your infrastructure running. After reaching a certain scale, a dedicated ops and engineering team are required to keep things running smoothly.
When you run your own servers, even within the cloud, provisioning a new server takes time. This encourages many organizations to run with a surplus of capacity. While this solves the problem of unexpected spikes in load, it can be wasteful and increase costs. A managed service can be scaled very quickly, allowing you to size your instances to better match your load.
Not all managed monitoring services are more cost effective for all businesses, as many have opaque pricing structures that lead to you paying more than you intended. If cost is a factor in your decision, pricing structures are always worth examining before making the purchase. For this reason, VictoriaMetrics Cloud is designed with price transparency in mind. You will always know what your VictoriaMetrics bill will be at the end of the month.
Ensuring your monitoring setup has enough capacity is just as much of a challenge as ensuring your application has enough capacity. Apart from managing hardware resources, there’s the challenge of provisioning any new servers with your monitoring software and secrets, as well as balancing load. Software like Kubernetes solves a lot of these challenges, but then you have to run your own Kubernetes cluster, and that’s complicated in its own right.
On top of the capacity challenge, scaling your monitoring service often requires scaling multiple components. This is hard enough when the service is a single component that can be replicated, but multiple components make the problem exponentially harder. All of a sudden, components don’t scale linearly and you have to identify and remedy bottlenecks.
A managed monitoring service is a great way to solve this scaling challenge. Monitoring providers allow you to click a button to get either an extra instance or a bigger instance that is provisioned within minutes.
Any system requires maintenance, and it forms a large part of the total cost of ownership. Critical security updates and bug fixes are released frequently for most production software, including components of monitoring systems, and they need to be applied to avoid bugs and security holes.
When you build your own monitoring system, your team becomes responsible for applying these updates. This is a time sink for engineers as it includes testing compatibility, smoothly swapping out versions, and sometimes rolling back bad versions.
Managed monitoring services can help alleviate this cost by managing updates for you. Even better, the service’s engineers are experts in updating their software. This can lead to smoother updates and lower total cost of ownership.
Downtime for a monitoring service is less critical than for a user-facing application, but that’s like saying that downtime for a fire alarm is less critical than an actual fire. In both cases, the early warning is valuable, and organizations can be left vulnerable without it.
If self-managed monitoring infrastructure goes down, it can leave you without insights into your application or infrastructure during potentially critical times. Worse, self-managed systems are more likely to share some underlying infrastructure with your application, meaning that your monitoring may go down at exactly the time you need it.
Using a managed monitoring service gives the responsibility for downtime to experts, and relieves your engineers from needing to know how to fix a broken monitoring system. What’s more, the company selling you the monitoring service will have strong incentives to avoid downtime in the form of SLAs and reputational risk. This means that managed services are likely to experience less downtime than something you put together yourself.
Building a secure system is difficult—cybersecurity experts are paid handsomely for a good reason. One advantage of using a managed monitoring service is that the work of hardening the system against attack has already been mostly done. Managed services are able to apply best practices by default to their customers, and keep up to date with the latest security advice, as it is their full-time job to do so.
In a similar vein, compliance with regulations can be a large cost to pay. Many managed monitoring services come with compliance baked in because the companies running the services have already gotten the certifications necessary. For example, Datadog provides PCI compliance for its logging product.
Businesses succeed because they are good at making the product or providing the service that they provide. A business does not have to be good at monitoring to succeed, nor should it be.
The Unix philosophy of doing one thing well also applies to businesses. For example, say a business runs an online store. For their core business, they need to hire web developers. However, to run their own monitoring stack they either need to train those web developers in infrastructure or also hire infrastructure engineers. Both of these options come with large costs that may not be justifiable for monitoring. Managed monitoring provides a more affordable alternative that lets the business focus on its core work.
VictoriaMetrics is a high-performance, fully open-source time series database that integrates with your existing monitoring stack. If you’re interested in trying managed monitoring with your business, why not take a look at VictoriaMetrics Cloud? VictoriaMetrics Cloud gives you the enterprise features of VictoriaMetrics in addition to transparent pricing and incredible resource and cost efficiency.
此内容由惯性聚合(RSS阅读器)自动聚合整理,仅供阅读参考。 原文来自 — 版权归原作者所有。