





This discussion is part of the basic monitoring series, an effort to clarify monitoring concepts for both beginners and experienced users:
Over the years, we’ve received many questions about MetricsQL/PromQL, even from experienced users—especially regarding range queries and instant queries. This article is basic but turns out to be really important to explain why your query behaves the way it does.
A query can return four different types of data: instant vector, range vector, scalar, and string. But for now, let’s stick to the two that matter most when working with timeseries data: instant vectors and range vectors.
At its core, querying is about pulling timeseries data and running calculations to make sense of it.
The simplest type of query is just a metric name. For example, if you run:
You’ll get CPU usage across all servers:
// result:
node_cpu_usage{instance="server1"} 100 @ 15:30:00
node_cpu_usage{instance="server2"} 50 @ 15:30:00
If you’re only interested in a specific server, you can filter it down with a label selector:
query: `node_cpu_usage{instance="server1"}`
// result:
node_cpu_usage{instance="server1"} 100 @ 15:30:00
Straightforward so far; but things don’t stay that simple for long. There’s another layer to this: instant queries and range queries.
Looking at the earlier examples, each timeseries only had one value at a specific timestamp. So does that mean node_cpu_usage and node_cpu_usage{instance="server1"} are instant queries?
Not exactly. These aren’t instant queries or range queries; they’re expressions evaluated as instant query. More specifically, these are called instant vector selectors.
As the name suggests, evaluating instant vector selectors always returns an instant vector, meaning a single sample per timeseries. Whether you see them as an instant query or a range query depends on how they’re evaluated—through the query editor or API.
You can set the expression to be evaluated as a range query in Grafana.
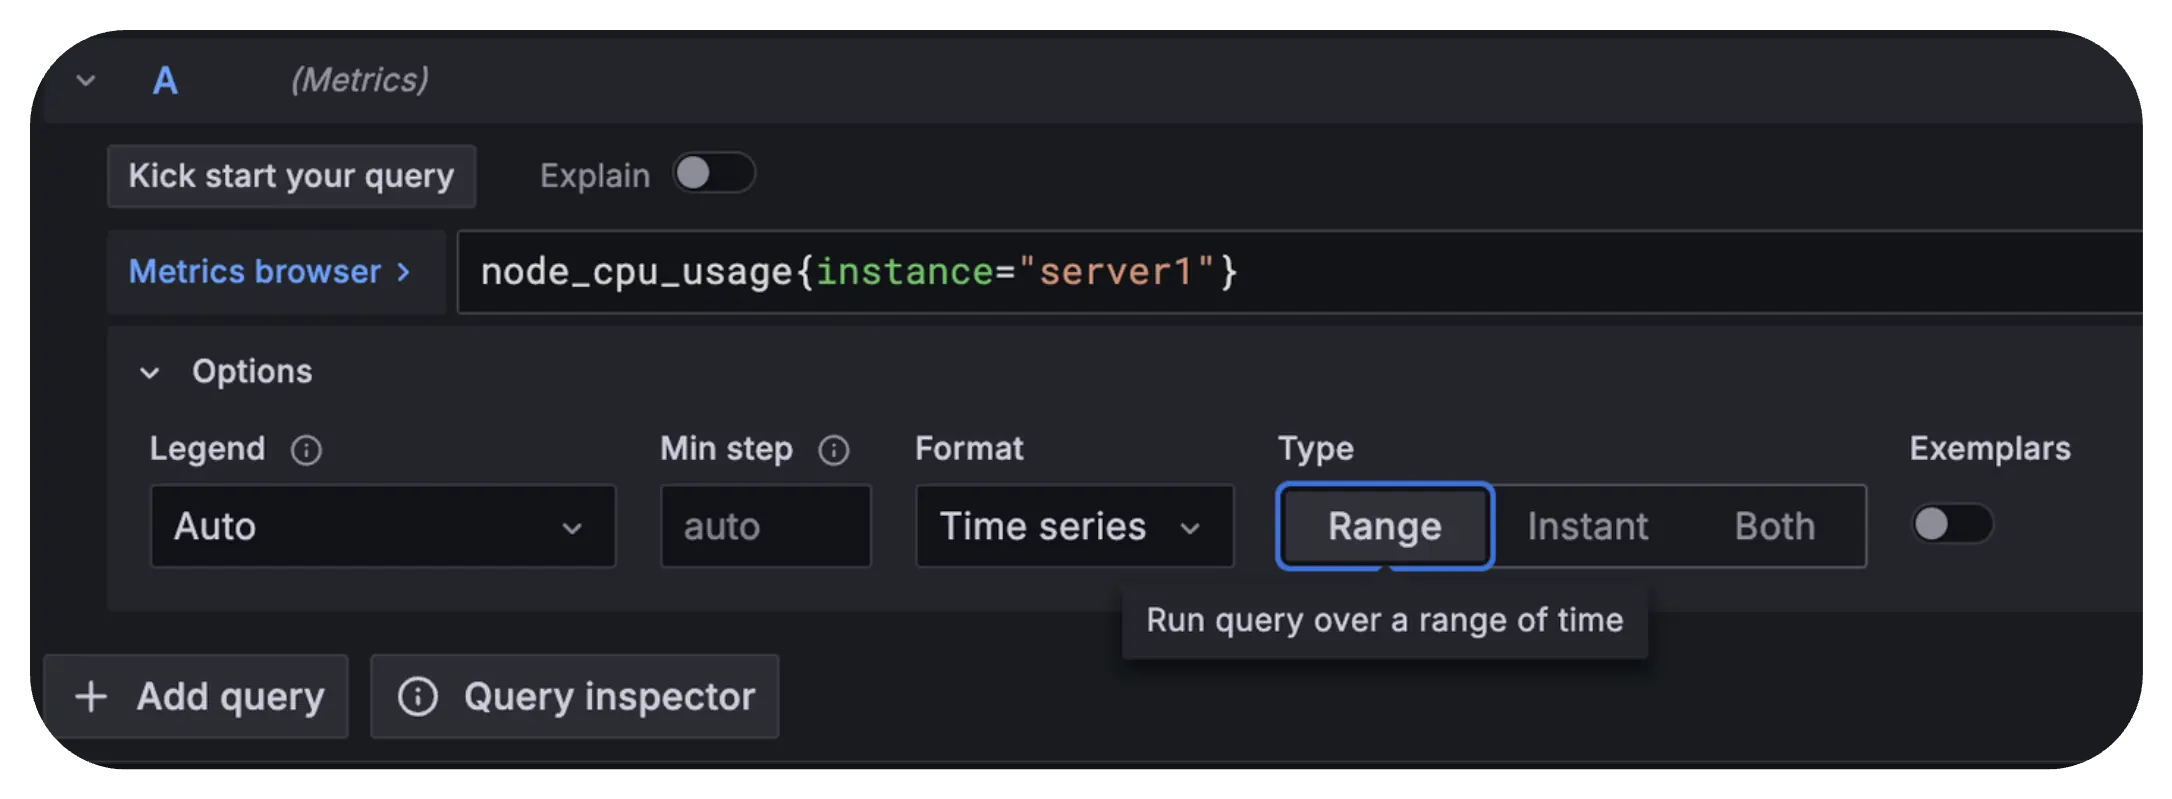
Now, results start looking different:
// result:
node_cpu_usage{instance="server1"} 100 @ 15:30:00
node_cpu_usage{instance="server1"} 75 @ 15:35:00
node_cpu_usage{instance="server1"} 74 @ 15:40:00
node_cpu_usage{instance="server1"} 65 @ 15:45:00
node_cpu_usage{instance="server1"} 70 @ 15:50:00
node_cpu_usage{instance="server1"} 58 @ 15:55:00
Instead of just one sample at the evaluation time, now there’s data over a range—from 15:30 to 15:55. That’s because this was evaluated as a range query.
So just to clear things up; expressions like node_cpu_usage and node_cpu_usage{instance="server1"} aren’t queries on their own. They’re just selectors that can be evaluated as either an instant query or a range query.
An instant vector is a set of timeseries where each timeseries has only one sample, the most recent value at the time the query runs. If you run node_cpu_usage at 15:30, it will return the sample recorded closest to but not after 15:30.
Since an instant query runs only once, it naturally returns a single sample per timeseries. This is why instant queries typically return instant vectors—though, as we’ll see later, that’s not always the case.
For example, if you evaluate node_cpu_usage as an instant query, you’ll get the latest recorded values for all servers:
node_cpu_usage{instance="server1"} 100
node_cpu_usage{instance="server2"} 50
This gives the current CPU usage for different servers. Even though there are many data points recorded over time, the query returns only one sample per timeseries, the latest one:
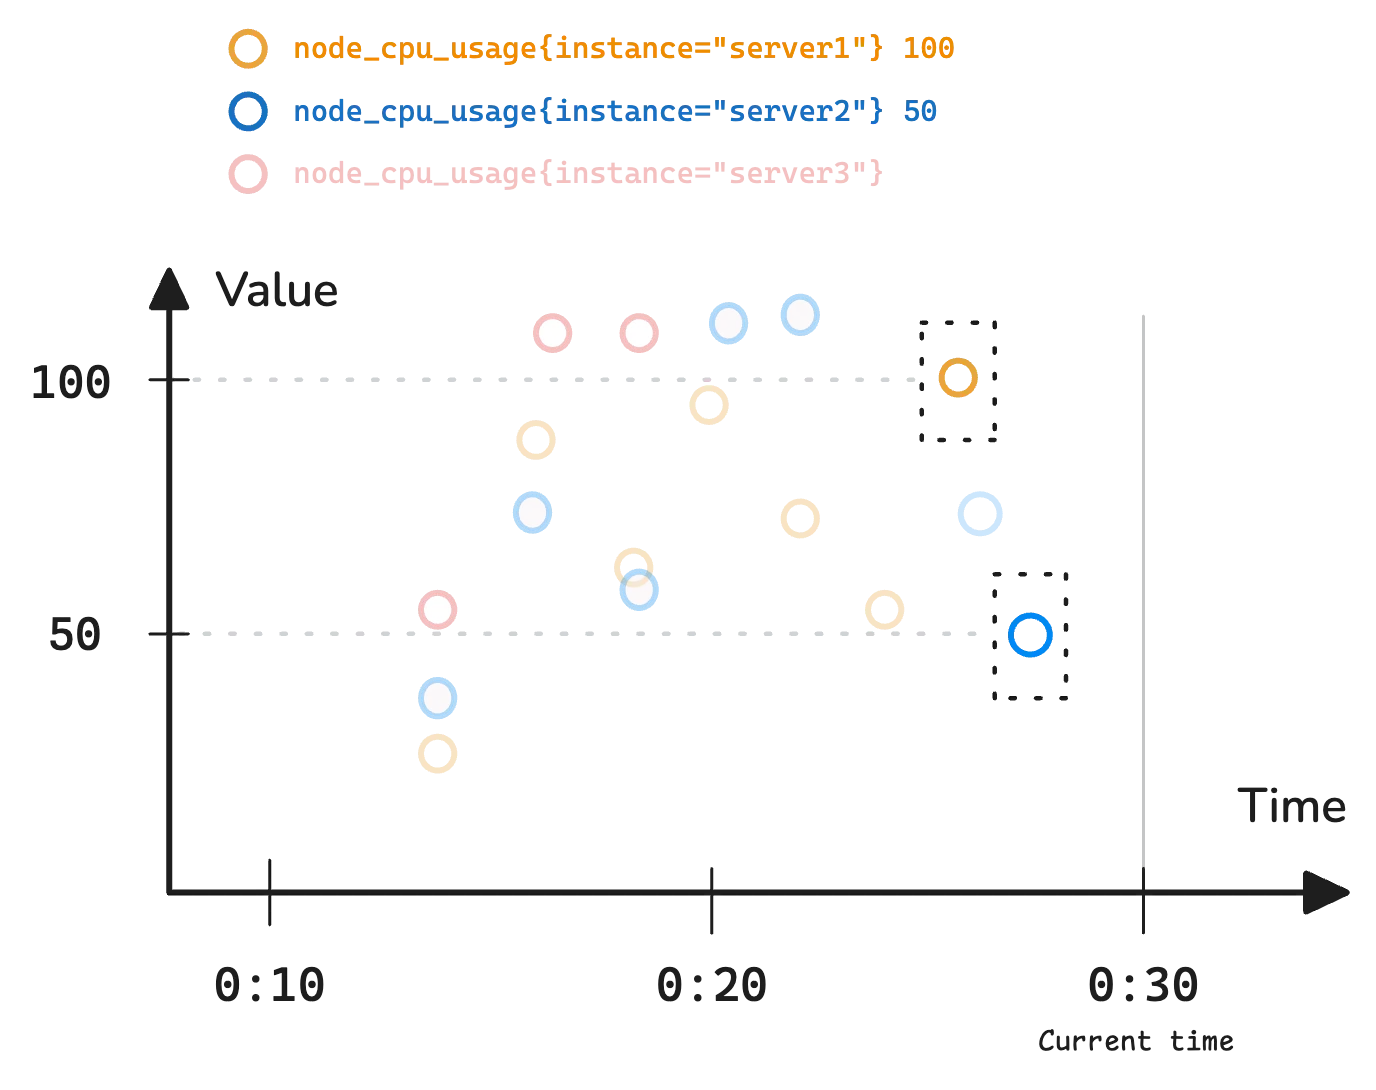
Wait, something is missing here. node_cpu_usage{instance="server3"} is not in the result.
That’s because monitoring systems don’t always return data for every timeseries if there isn’t a recent enough sample. By default, most monitoring tools look back 5 minutes for the most recent sample. This timeframe is called the lookback delta (also known as the lookbehind window or lookback window).
In the diagram, the red dot represents node_cpu_usage{instance="server3"}, but its last recorded sample was too far from 00:30, so it does not appear in the result. But how much time is too far?
--query.lookback-delta flag.-search.maxLookback=5m flag.VictoriaMetrics lets you set max_lookback directly in API queries. You can also override it with the -search.setLookbackToStep flag. The concept of step will be explained in the next section.
If you prefer not to change any flags or configuration, the last_over_time() function is a good option:
last_over_time(node_cpu_usage[10m])
Behind the scenes, an instant query like node_cpu_usage is automatically converted to last_over_time(node_cpu_usage[5m]) in Prometheus. In VictoriaMetrics, it becomes default_rollup(node_cpu_usage[<autogenerated_window>]) with a window generated based on your metric’s characteristics.
A range vector is a set of timeseries where each timeseries holds multiple samples over a specific time range.
Instead of capturing just the latest value, it provides a window into how a metric has changed over time. This makes it useful for calculations that rely on historical data, like averages, trends, or rate calculations.
The chart below shows a range vector:
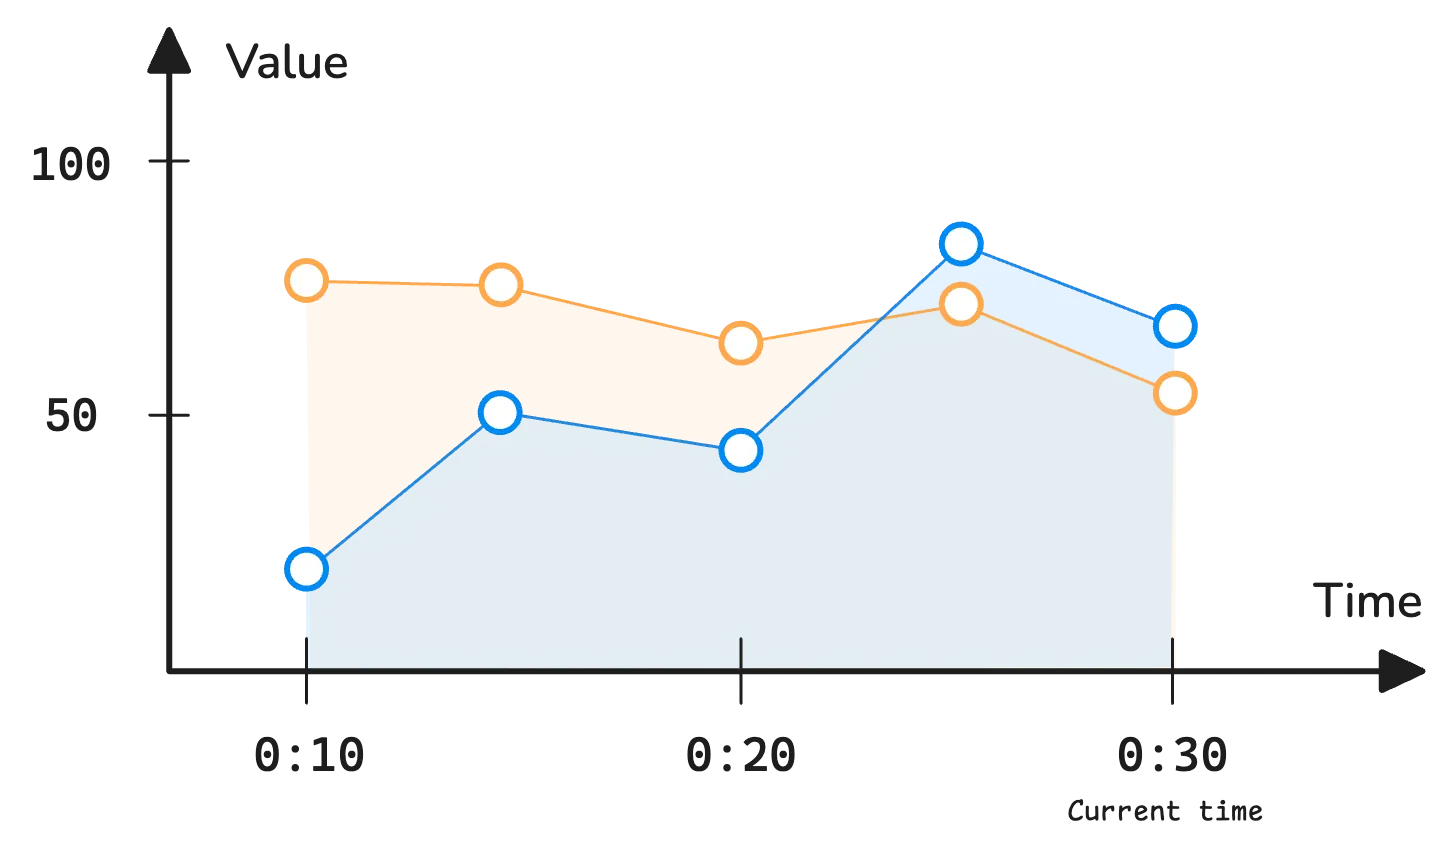
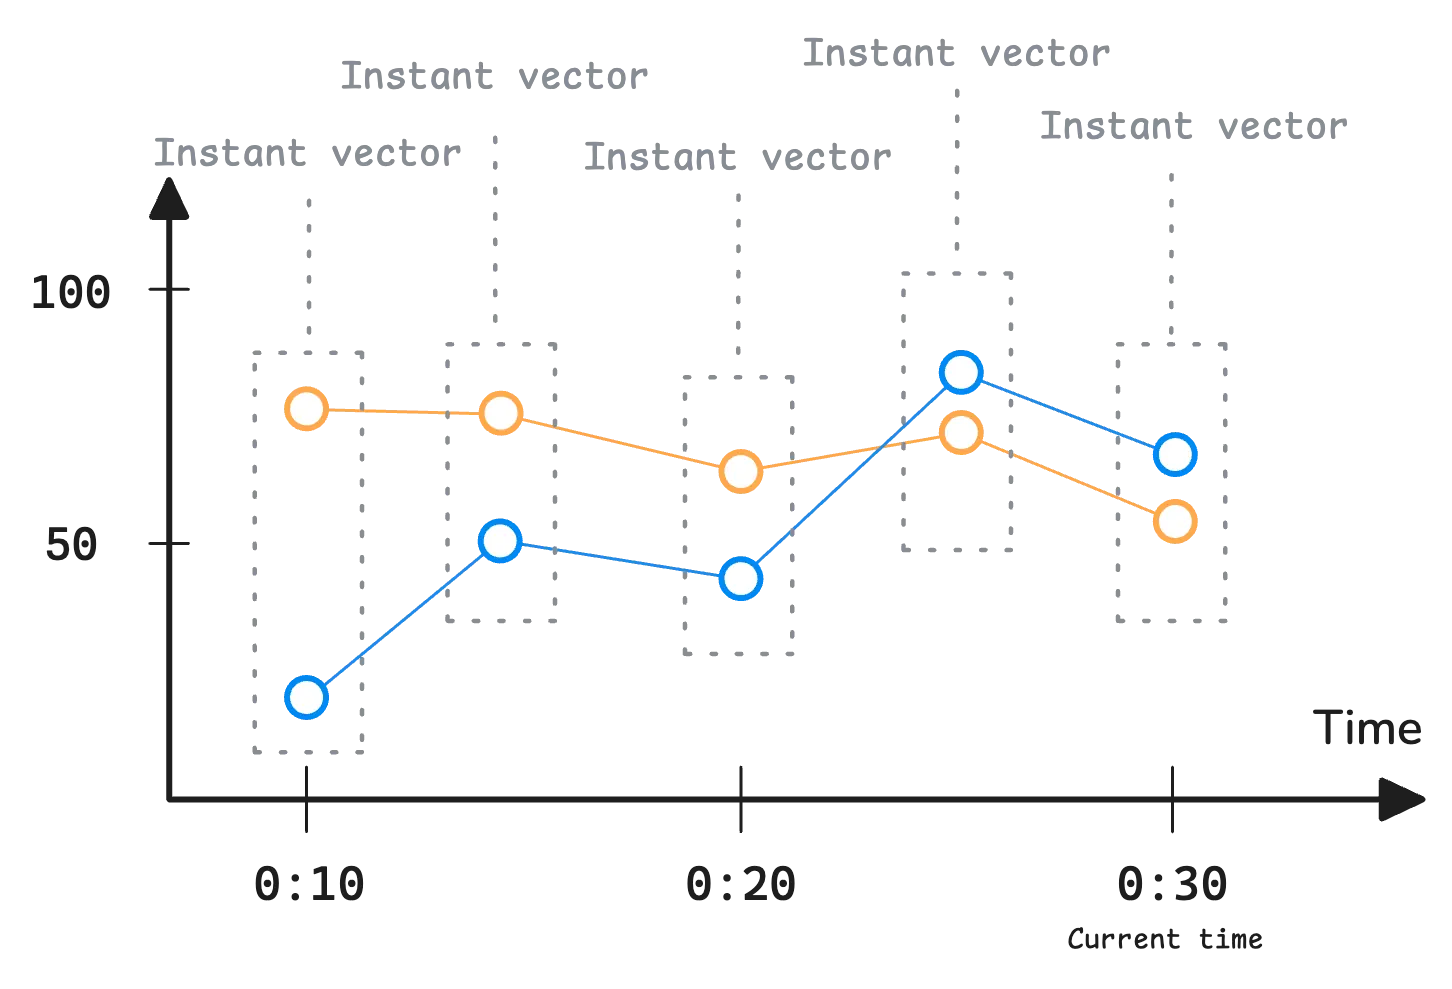
An instant vector selector like node_cpu_usage typically returns one sample per time series. However, when evaluated as a range query, it’s evaluated at multiple timestamps across the time range. Each evaluation returns an instant vector, meaning a range vector is basically a collection of instant vectors distributed over time:
node_cpu_usage{instance="server1"} 75 @ 00:10
node_cpu_usage{instance="server1"} 74 @ 00:15
node_cpu_usage{instance="server1"} 65 @ 00:20
node_cpu_usage{instance="server1"} 70 @ 00:25
node_cpu_usage{instance="server1"} 58 @ 00:30

node_cpu_usage{instance="server2"} 22 @ 00:10
node_cpu_usage{instance="server2"} 50 @ 00:15
node_cpu_usage{instance="server2"} 46 @ 00:20
node_cpu_usage{instance="server2"} 81 @ 00:25
node_cpu_usage{instance="server2"} 69 @ 00:30
The monitoring system evaluates this query at 00:10, 00:15, 00:20, 00:25, and 00:30—essentially taking snapshots every 5 minutes.
That 5-minute interval is called the step, which is usually configurable in query editors like vmui or Grafana. Most of the time, the step is automatically determined based on the selected time range.
When you submit a range query, the query editor sends a request with a step parameter:
GET | POST /api/v1/query_range?query=...&start=...&end=...&step=...&timeout=...
“My metrics were scraped at 00:09, 00:13, and 00:16—so why does the result show data at 00:10, 00:15, and 00:20?”
Since a range query is really just a collection of multiple instant queries, the monitoring system applies lookback delta to find the most recent sample for each step.
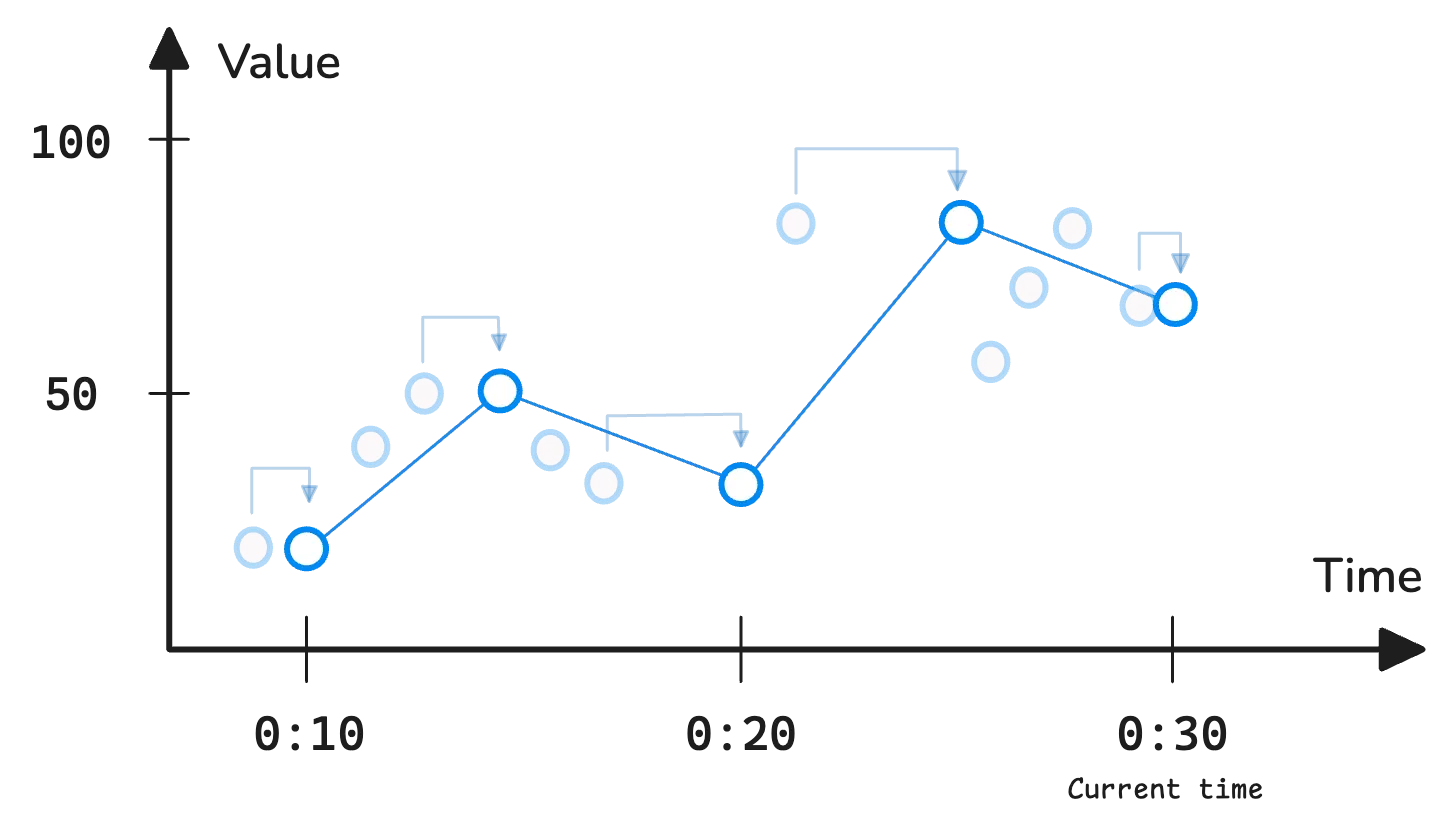
Here’s what’s happening:
We’ve covered lookback delta and step, but there’s one more key concept to get familiar with—the window in the range selector [window].
Evaluating node_cpu_usage as an instant vector selector returns 1 sample per timeseries. But adding a window (e.g., [5m]) turns it into a range vector selector. Now, instead of just the latest value, it returns all the samples recorded in that 5-minute window.
This is particularly useful when applying rollup functions to summarize data over time. For example, to find the maximum CPU usage in the last 3 minutes (window) for every 5 minutes (step), you’d use this query:
query: max_over_time(node_cpu_usage[3m])
step: 5m
start: 00:00
end: 00:30
The system retrieves all the data points in the last 3 minutes to find the max value in those data points.
This process repeats across the time range, emitting a new sample every 5 minutes:
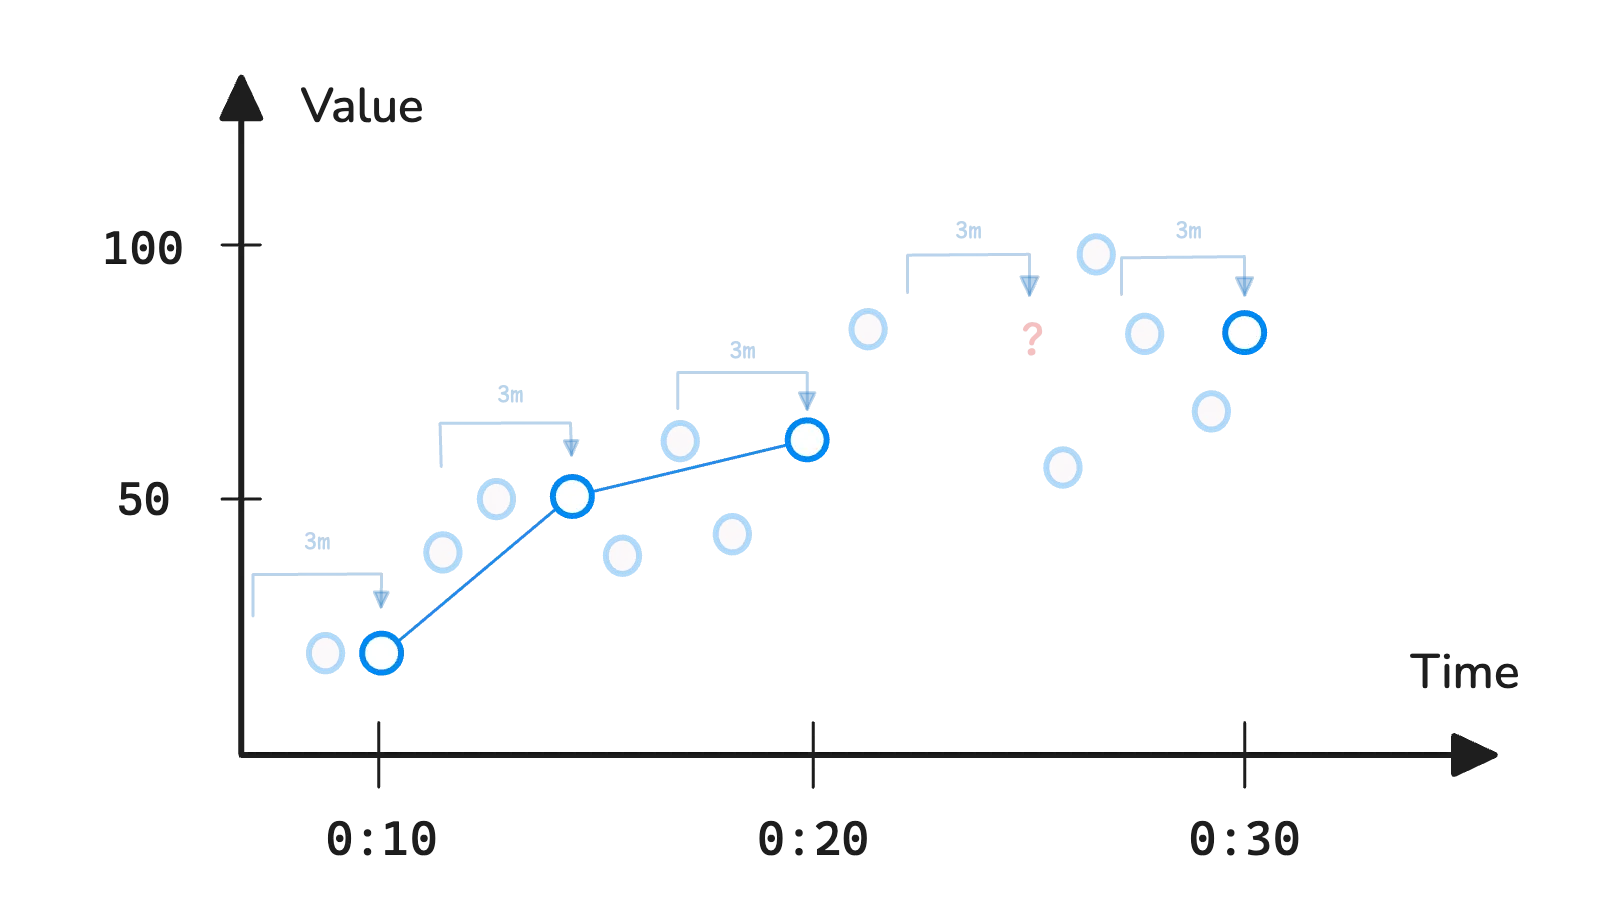
Notice that the fourth data point is missing. That happens because the system looks back 3 minutes from 00:25, but there are no recorded samples in that window, so it has nothing to work with.
The range selector can also define its own step by writing it directly using [window:step]. However, this really comes into play when working with subqueries, so we’ll hold off on that for now.
So far, we haven’t talked about what happens if you run a range vector selector (e.g., http_requests_total[5m]) as an instant query or a range query. What we did previously was put the range selector into a function, e.g., last_over_time(http_requests_total[5m]).
Let’s remind ourselves a bit: an instant vector selector evaluates to an instant vector. But if a range selector [window] is included, the result is a range vector each time the query runs, or multiple samples per timeseries.
This raises a few questions when evaluating a range vector selector as:
step parameter—the expression is only evaluated once but returns many samples. So how are these samples distributed through the time range?Evaluating http_requests_total[5m] as an instant query returns raw samples from T-5m to T. If you run this query in Grafana or any other editor that supports instant queries, from 00:00 to 23:00, the result might look a bit strange—it will only include samples from 22:55 to 23:00:
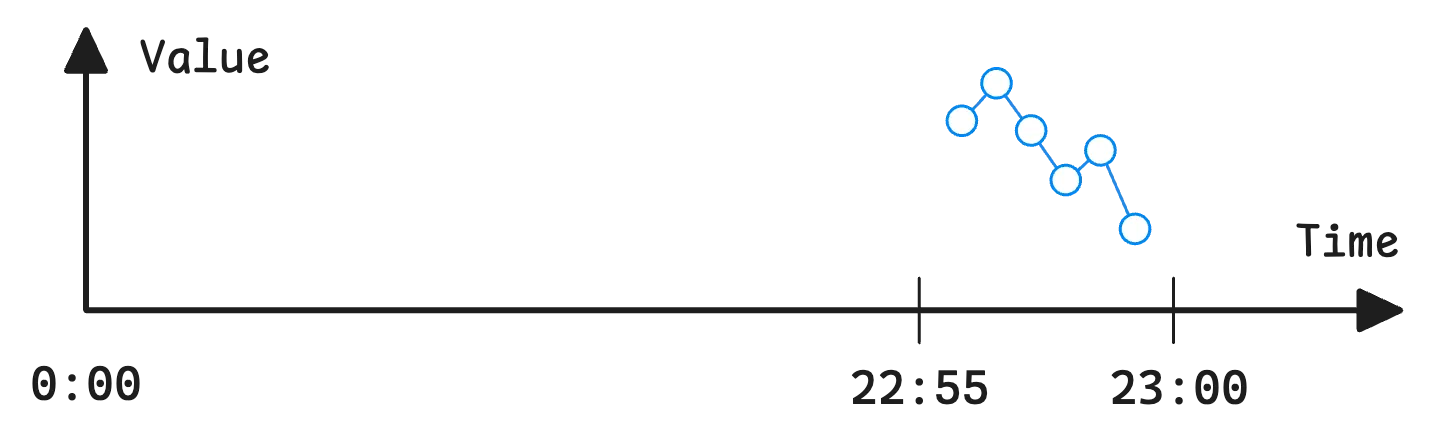
By raw samples, I mean that lookback delta and step aren’t applied—so the returned data points aren’t evenly spaced.
Normally, lookback delta fills in missing samples at each step interval. But since this expression is evaluated only once, there’s no step interval to work with. As a result, the system simply returns the data with the original scrape (or push) timestamps, exactly as stored.
In Prometheus, running http_requests_total[5m] as a range query doesn’t work. This is a common mistake that many people make. You’ll get an error:
query: http_requests_total[5m]

// result:
bad_data: invalid parameter "query": invalid expression type "range vector"
for range query, must be Scalar or instant Vector
Prometheus expects one sample per timeseries at each evaluation step.
That’s how it builds a continuous timeseries for charting. But this expression evaluates to a range vector, which returns multiple samples for each step, which doesn’t fit the expected format—so the system refuses to process it.
VictoriaMetrics, on the other hand, handles this case gracefully without errors.
It assumes the query is meant to retrieve samples every 5 minutes from start to end. So, when used in a range query, http_requests_total[5m] behaves just like last_over_time(http_requests_total[5m]), pulling the most recent value for each step.
And… congratulations on making it this far. While waiting for the next article in this series, you can read more on Monitoring with VictoriaMetrics.
If you spot anything that’s outdated or have questions, don’t hesitate to reach out. You can drop me a DM on X(@func25) or VictoriaMetrics’ Slack.
If you want to monitor your services, track metrics, and see how everything performs, you might want to check out VictoriaMetrics. It’s a fast, open-source, and cost-saving way to keep an eye on your infrastructure.
此内容由惯性聚合(RSS阅读器)自动聚合整理,仅供阅读参考。 原文来自 — 版权归原作者所有。