

惯性聚合 高效追踪和阅读你感兴趣的博客、新闻、科技资讯
阅读原文 在惯性聚合中打开

推荐订阅源

T
Tenable Blog
K
KPMG report finds enterprise disconnect between AI and its ROI | CIO
V
Vulnerabilities – Threatpost
G
GRAHAM CLULEY
Simon Willison's Weblog
C
CXSECURITY Database RSS Feed - CXSecurity.com
P
Privacy International News Feed
H
Heimdal Security Blog
Exploit-DB.com RSS Feed
S
Secure Thoughts
MyScale Blog
MyScale Blog
C
Cyber Attacks, Cyber Crime and Cyber Security
V
Visual Studio Blog
OSCHINA 社区最新新闻
OSCHINA 社区最新新闻
L
LINUX DO - 最新话题
D
Darknet – Hacking Tools, Hacker News & Cyber Security
The Cloudflare Blog
美团技术团队
Recorded Future
Recorded Future
T
Tailwind CSS Blog
Latest news
Latest news
Security Archives - TechRepublic
Security Latest
Security Latest
Know Your Adversary
Know Your Adversary
Cloudbric
Cloudbric
Schneier on Security
I
Intezer
L
LINUX DO - 热门话题
P
Palo Alto Networks Blog
云风的 BLOG
云风的 BLOG
cs.CL updates on arXiv.org
Vercel News
Vercel News
Attack and Defense Labs
人人都是产品经理
人人都是产品经理
L
LangChain Blog
爱范儿
爱范儿
博客园 - 三生石上(FineUI控件)
博客园 - 叶小钗
L
Lohrmann on Cybersecurity
S
SegmentFault 最新的问题
W
WeLiveSecurity
C
Cybersecurity and Infrastructure Security Agency CISA
S
Securelist
SecWiki News
SecWiki News
V2EX - 技术
V2EX - 技术
IT之家
IT之家
Cyberwarzone
Cyberwarzone
F
Full Disclosure
Spread Privacy
Spread Privacy
阮一峰的网络日志
阮一峰的网络日志

VictoriaMetrics: Simple & Reliable Monitoring for Everyone on VictoriaMetrics

Operator now has Long-Term Support (LTS) version Multi-tiered Observability: A Practical Way to Handle Diverse Workloads VictoriaMetrics April 2026 Ecosystem Updates Not All Telemetry Requires Premium Pricing VictoriaMetrics at KubeCon Amsterdam: Community Highlights What's new in VictoriaMetrics Anomaly Detection (Q1 2026) What's New in VictoriaMetrics Cloud Q1 2026? Logs, MCP Server, Better Alerting, and... a Secret Project VictoriaMetrics at KubeCon: Optimizing Tail Sampling in OpenTelemetry with Retroactive Sampling VictoriaMetrics March 2026 Ecosystem Updates Observability Lessons From OpenAI Benchmarking Kubernetes Log Collectors: vlagent, Vector, Fluent Bit, OpenTelemetry Collector, and more VictoriaMetrics February 2026 Ecosystem Updates VictoriaMetrics at FOSDEM, Cloud Native Days France, and CfgMgmtCamp Ghent VictoriaLogs in VictoriaMetrics Cloud: Fast, Cost-Effective Log Management is Here What’s new in VictoriaMetrics Anomaly Detection (2025) VictoriaMetrics January 2026 Ecosystem Updates VictoriaLogs Basics: What You Need to Know, with Examples & Visuals What's New in VictoriaMetrics Cloud Q4 2025? New tiers, more deployment options, IaC and alerting rules. Vibe coding tools observability with VictoriaMetrics Stack and OpenTelemetry How a US Software Provider Improved Traffic Alerting with VictoriaMetrics Anomaly Detection VictoriaMetrics 2025 Developer Experience: A Year in Review Spotify’s performance & control across large monitoring environments with VictoriaMetrics VictoriaMetrics Achieves Red Hat OpenShift Operator Certification Our latest updates across the VictoriaMetrics Observability ecosystem New Capacity Tiers in VictoriaMetrics Cloud Announcing 1B+ Downloads & Product Development With Logs, Traces, Metrics AI Agents Observability with OpenTelemetry and the VictoriaMetrics Stack Discarding gRPC-Go: The Story Behind OTLP/gRPC Support in VictoriaTraces What's New in VictoriaMetrics Cloud Q3 2025? From new region in Asia to proactive alerts How DreamHost Slashed Memory Usage by 80% and Scaled to 76 Million Time Series Upcoming Conferences & Meetups: Where to Meet Our Team VictoriaMetrics Long-Term Support (LTS): H2 2025 Update Creating a Sustainable Open Source Business Model - Introduction Full-Stack Observability with VictoriaMetrics in the OTel Demo Alerting Best Practices vmanomaly Deep Dive: Smarter Alerting with AI (Tech Talk Companion) VictoriaLogs Practical Ingestion Guide for Message, Time and Streams Monotonic and Wall Clock Time in the Go time package Hello Singapore! VictoriaMetrics Cloud Expands to Asia Pacific MCP Server Integration & Much More: What's New in VictoriaMetrics Cloud Q2 2025 FIPS 140-3 Compatible Builds for VictoriaMetrics Enterprise Components VictoriaLogs Unleashed: Cluster Version Now Available for Exceptional, Linear Scaling Integrations made easy with VictoriaMetrics Cloud Developer's Note: Research on Distributed Tracing, Comparing With Tempo and ClickHouse vmagent: Key Features Explained in Under 15 Minutes Go synctest: Solving Flaky Tests vmalert: Maximize Your Monitoring (Tech Talk Companion) Celebrating 14K Stars on GitHub: Spring Update vmalert: Maximize Your Monitoring VictoriaMetrics Connects with the Open Source Community at LinuxFest Northwest 2025 Graceful Shutdown in Go: Practical Patterns VictoriaLogs: Gaps, Gains & Growth Prometheus Monitoring: Functions, Subqueries, Operators, and Modifiers VictoriaMetrics Cloud: What's New in Q1 2025? Don’t default to microservices: You’ll thank us later! Container CPU Requests & Limits Explained with GOMAXPROCS Tuning gRPC in Go: Streaming RPCs, Interceptors, and Metadata From Chaos to Clarity with VictoriaLogs Prometheus Alerting 101: Rules, Recording Rules, and Alertmanager Heading to London: Meet Our Team at KubeCon Europe 2025 Inside vmselect: The Query Processing Engine of VictoriaMetrics Meet Our Team at Scale 22x Practical Protobuf - From Basic to Best Practices VictoriaLogs Status Update: Heading Towards the Cluster Version 24th of February 2025 Statement: VictoriaMetrics Stands with Ukraine! Prometheus Metrics Explained: Counters, Gauges, Histograms & Summaries Prometheus Monitoring: Instant Queries and Range Queries Explained 300%+ Growth in 2024: Join Our Team in 2025! FOSDEM 2025 recap How Protobuf Works—The Art of Data Encoding OpenTelemetry, Prometheus, and More: Which Is Better for Metrics Collection and Propagation? How vmstorage Handles Query Requests From vmselect How vmstorage's IndexDB Works VictoriaMetrics Tech Talk Stream: A Deep Dive into Blackbox Monitoring How HTTP/2 Works and How to Enable It in Go VictoriaMetrics Cloud: What's New in Q4 2024? How vmstorage Processes Data: Retention, Merging, Deduplication,... How vmstorage Handles Data Ingestion From vminsert When Metrics Meet vminsert: A Data-Delivery Story From net/rpc to gRPC in Go Applications Piros | VictoriaMetrics Partner Allenta | VictoriaMetrics Partner CloudRaft | VictoriaMetrics Partner Sensedia & VictoriaMetrics: API-compatible Efficient Storage Scalable Prometheus: Why DSV Chose VictoriaMetrics Sensor Factory | VictoriaMetrics Partner Erythix | VictoriaMetrics Partner Groove X & VictoriaMetrics: Faster Device Health Monitoring Scaled & Performant Monitoring at Spotify with VictoriaMetrics Grammarly & VictoriaMetrics: 10× Lower Costs & Direct Access Zelarsoft | VictoriaMetrics Partner DFKI & VictoriaMetrics: Efficient Long-Term Metric Storage Niubits | VictoriaMetrics Partner Megazone Cloud | VictoriaMetrics Partner Cogito Software | VictoriaMetrics Partner Bajau | VictoriaMetrics Partner Find Out Why Dig Security Chose VictoriaMetrics! Ness | VictoriaMetrics Partner Alpha Data | VictoriaMetrics Partner SIOS Technology | VictoriaMetrics Partner
How to reduce expenses on monitoring: Swapping in VictoriaMetrics for Prometheus
Roman Khavronenko · 2024-02-13 · via VictoriaMetrics: Simple & Reliable Monitoring for Everyone on VictoriaMetrics

This blog post is also available as a recorded talk with slides.

Monitoring can get expensive due to the huge quantities of data that need to be processed. In this blog post, you’ll learn the best ways to store and process monitoring metrics to reduce your costs, and how VictoriaMetrics can help.

This blog post will only cover open-source solutions. VictoriaMetrics is proudly open source. You’ll get the most out of this blog post if you are familiar with Prometheus, Thanos, Mimir or VictoriaMetrics.

See the second blog post in this series - How to reduce expenses on monitoring: be smarter about data.


Before we can talk about reducing monitoring expenses, we first need to understand monitoring systems. Below is a typical monitoring architecture:
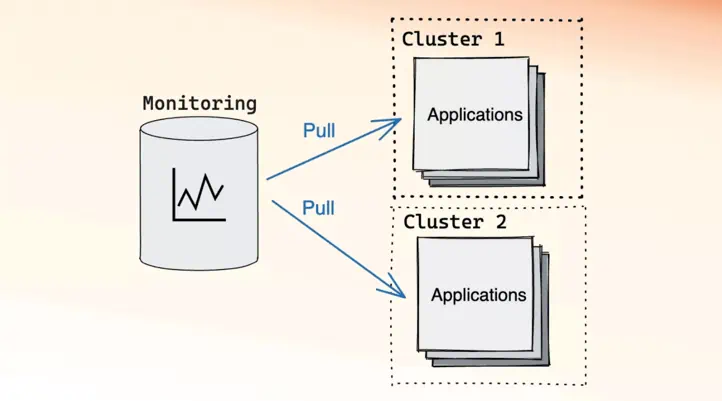
Example of <a href='https://docs.victoriametrics.com/keyconcepts/#pull-model' target='_blank'>pull model</a> monitoring Example of pull model monitoring

In the above architecture, there is a monitoring system that is responsible for periodically scraping metrics from the services it knows about. This architecture is called the pull model, since the monitoring system is actively pulling data. The pull model was popularized by Prometheus and is also supported by VictoriaMetrics.

The complement to the pull model is the push model:
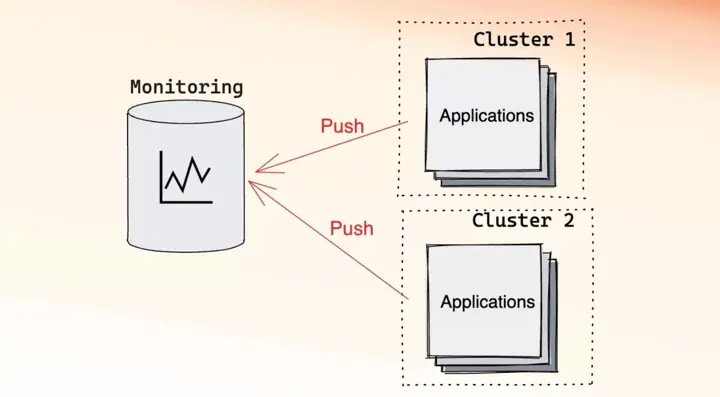
Example of <a href='https://docs.victoriametrics.com/keyconcepts/#push-model' target='_blank'>push model</a> monitoring Example of push model monitoring

The push model is the inverse of the pull model. In the push model, applications know about the monitoring system and are responsible for pushing metrics into it. The push model has been supported by VictoriaMetrics from the beginning, is supported by Mimir, and recently Prometheus introduced support for it behind a feature flag.

It is possible to mix and match the two models:
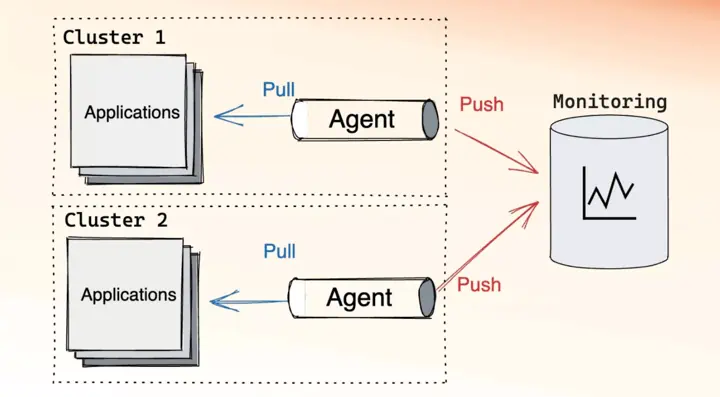
Example of mixed model monitoring: push and pull Example of mixed model monitoring: push and pull

In the mixed topology, there is usually an agent that is responsible for collecting metrics, similar to the monitoring system in the pull model. The agent is placed as close to the applications as possible, ideally within the same cluster. After collecting the metrics, the agent is then responsible for sending them to the monitoring system, like the application would in the push model.

No matter which architecture you choose, there will be four factors that contribute to your infrastructure bill at the end of the month:

  • CPU
  • Memory
  • Disk
  • Network

Making your systems more efficient is a bit like trying to win more car races, in that you have a few paths to victory: either get a faster car, or become a better driver, or both. A faster car in monitoring terms could mean using a more efficient software, while becoming a better driver could mean applying tricks to reduce the work your monitoring system needs to do. In this series of blogposts, you will see how to reduce expenses using these two different approaches.

Swapping in VictoriaMetrics for Prometheus

#

The monitoring equivalent of getting a faster car is to swap your current database for a more efficient one. In this section, we’ll take a look at swapping in VictoriaMetrics for Prometheus.

VictoriaMetrics is a drop-in replacement for Prometheus, with little to no configuration changes required. You can just swap the binaries in many cases. If you’re interested in trying VictoriaMetrics with your system, check out the docs for more information.

Benchmark setup

#

For benchmarking purposes, we use our Remote write benchmark tool which we already mentioned in previous blog posts:

This benchmark was designed to test time series databases by pushing data. While Prometheus supports both push and pull models, its pull model seems much more efficient and optimized right now. So to make the benchmark fair we configured both Prometheus and VictoriaMetrics single-node to scrape the same list of targets using the same config, and execute the same list of read queries generated by a standalone ruler:
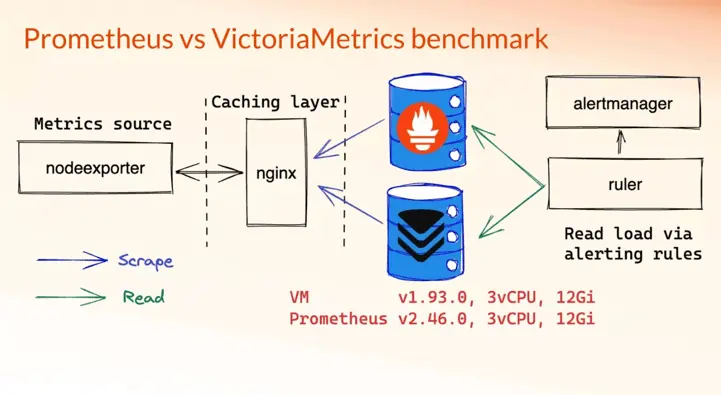
Architecture of benchmark suite for testing read/write load on VictoriaMetrics and Prometheus. The benchmark repo is available <a href='https://github.com/VictoriaMetrics/prometheus-benchmark/tree/vmsingle#prometheus-benchmark' target='_blank'>here</a> Architecture of benchmark suite for testing read/write load on VictoriaMetrics and Prometheus. The benchmark repo is available here

Here are some of the specifications for this benchmark:

  • VictoriaMetrics and Prometheus running on the same instance configuration (3 vCPUs, 12 GiB RAM);
  • 1000 Node Exporter targets to simulate monitoring of 1000 instances, each target exposes about 1200 unique time series;
  • 15s scrape interval, defines how frequently to scrape targets. For 1000 targets 1200 time series each the ingestion should be around 1000 * 1200 / 15s = 80K samples/s;
  • 30s rules evaluation interval, defines how often to send read queries. For this set of rules benchmark would generate about 1 read request per second;
  • 5% churn rate every 10 minutes, defines how many targets will change their labels within 10min interval. In other words, 1000 targets * 5% * 1200 = 60K new time series will be generated every 10 minutes.

The churn rate above simulates metric targets changing over time. This is of particular interest when monitoring applications deployed on Kubernetes. Kubernetes has the concept of pods, which are ephemeral instances of an application. Whenever a new version of an application is deployed or needs to be restarted, a new pod is created. Since each pod has a randomly generated name, recreating a pod creates a new metrics target and invalidates the old one.

Results

#

The benchmark ran for seven days in this experiment. System metrics for both, Prometheus and VictoriaMetrics, were captured on Grafana snapshot here.

On average, the ingestion rate for both Prometheus and VictoriaMetrics was around ~80 K samples/second:
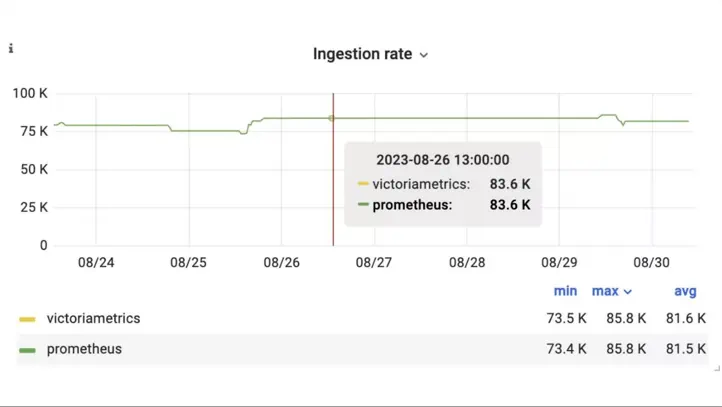
Ingestion rate of samples/s into VictoriaMetrics and Prometheus during the benchmark Ingestion rate of samples/s into VictoriaMetrics and Prometheus during the benchmark

The set of time series that a database recently wrote data to, or read data from, is referred to as the set of active time series. Usually, the number of active time series has the highest impact on the memory usage. Below is the graph showing the number of active time series for Prometheus and VictoriaMetrics during this benchmark:
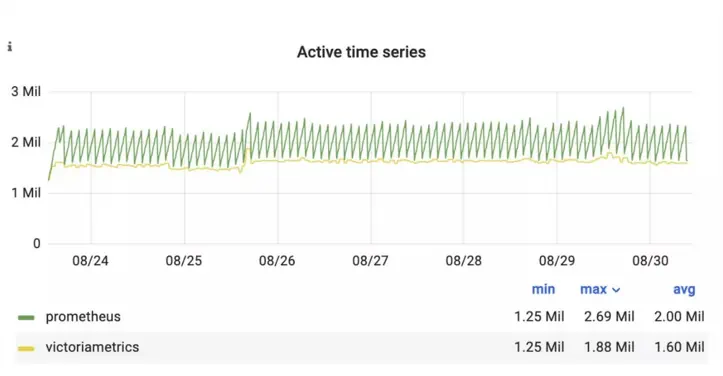
Active time series of VictoriaMetrics and Prometheus during the benchmark Active time series of VictoriaMetrics and Prometheus during the benchmark

While the two lines look quite different, this is just due to how the two databases measure active time series. VictoriaMetrics has a sliding time window, while Prometheus (Thanos and Mimir) has fixed two hour intervals for collecting metrics and flushing them to disk.

In terms of CPU, VictoriaMetrics and Prometheus behaved similarly:
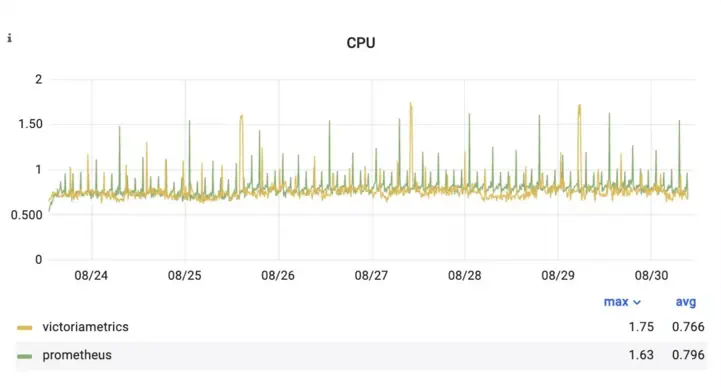
CPU usage of VictoriaMetrics and Prometheus during the benchmark CPU usage of VictoriaMetrics and Prometheus during the benchmark

While the results above were comparable between VictoriaMetrics and Prometheus, the results get interesting when looking at query latency. VictoriaMetrics was on average 16x faster than Prometheus using the same list of alerting rules and the same dataset:
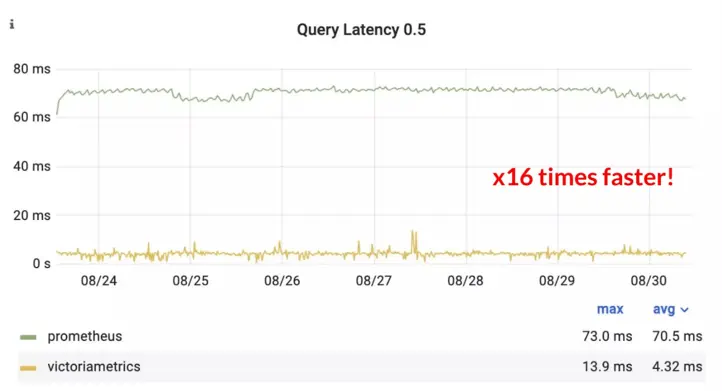
Latency (50th percentile) of read queries for VictoriaMetrics and Prometheus during the benchmark Latency (50th percentile) of read queries for VictoriaMetrics and Prometheus during the benchmark

The above graph is at the 50th percentile. This means that the median time VictoriaMetrics takes to serve a query is 16x faster than the average time Prometheus takes. This gap closes when looking at the 99th percentile, i.e. the slowest queries, but VictoriaMetrics is still 1.9x faster:
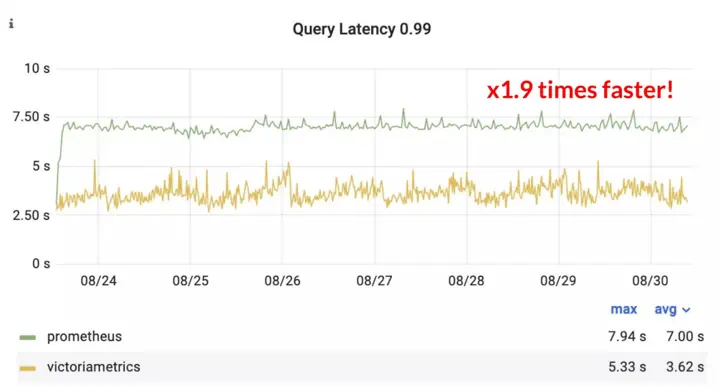
Latency (99th percentile) of read queries for VictoriaMetrics and Prometheus during the benchmark Latency (99th percentile) of read queries for VictoriaMetrics and Prometheus during the benchmark

As well as serving reads faster, VictoriaMetrics also used 1.7x less memory than Prometheus:
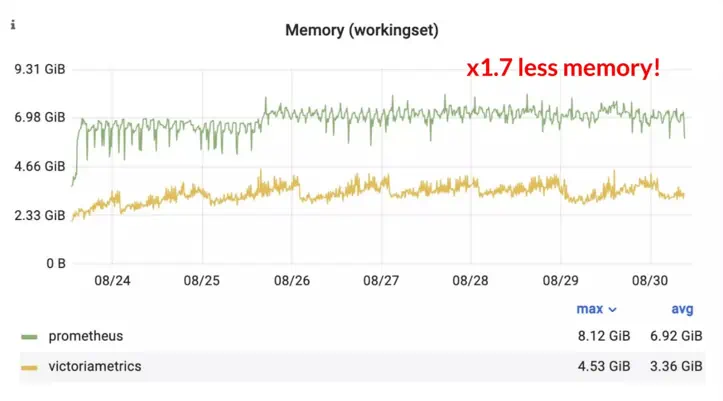
Memory usage of VictoriaMetrics and Prometheus during the benchmark Memory usage of VictoriaMetrics and Prometheus during the benchmark

VictoriaMetrics uses an improved version of the Gorilla compression method that Prometheus uses, as documented by our CTO, Aliaksandr Valialkin, in this blog post. This results in VictoriaMetrics using 2.5x less disk space for the same data:
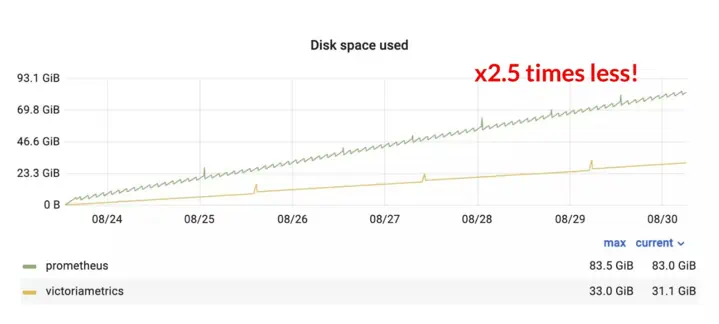
Disk usage of VictoriaMetrics and Prometheus during the benchmark Disk usage of VictoriaMetrics and Prometheus during the benchmark

Below is a summary of the results from this experiment:

PrometheusVictoriaMetrics
CPU avg used0.79/3 cores0.76/3 cores
Disk usage83.5 GiB✅ 33 GiB
Memory max used8.12/12 GiB✅ 4.5/12 GiB
Read latency 50th70.5ms✅ 4.3ms
Read latency 99th %ile7s✅ 3.6s

Swapping in VictoriaMetrics for Prometheus can provide huge gains for little effort! This is one of the simplest things one could do to reduce expenses on monitoring. However, VictoriaMetrics provides additional tools and features for improving cost-efficiency and performance. See the second blog post in this series - How to reduce expenses on monitoring: be smarter about data.