



惯性聚合 高效追踪和阅读你感兴趣的博客、新闻、科技资讯
阅读原文 在惯性聚合中打开

推荐订阅源

OSCHINA 社区最新新闻
OSCHINA 社区最新新闻
人人都是产品经理
人人都是产品经理
IT之家
IT之家
T
The Blog of Author Tim Ferriss
V
V2EX
博客园 - 聂微东
The Cloudflare Blog
Blog — PlanetScale
Blog — PlanetScale
A
About on SuperTechFans
U
Unit 42
Vercel News
Vercel News
L
LangChain Blog
博客园 - 司徒正美
H
Help Net Security
Recent Announcements
Recorded Future
Recorded Future
V
Visual Studio Blog
Jina AI
Jina AI
Microsoft Azure Blog
GbyAI
GbyAI
Y
Y Combinator Blog
C
Check Point Blog
博客园 - 三生石上(FineUI控件)
奇客Solidot–传递最新科技情报
奇客Solidot–传递最新科技情报
钛媒体:引领未来商业与生活新知
钛媒体:引领未来商业与生活新知
J
Java Code Geeks
The Register - Security
The GitHub Blog
The GitHub Blog
B
Blog RSS Feed
F
Fortinet All Blogs
B
Blog
G
Google Developers Blog
Cyber Security Advisories - MS-ISAC
云风的 BLOG
云风的 BLOG
爱范儿
爱范儿
MongoDB | Blog
MongoDB | Blog
F
Full Disclosure
有赞技术团队
有赞技术团队
罗磊的独立博客
博客园_首页
MyScale Blog
MyScale Blog
aimingoo的专栏
aimingoo的专栏
Google DeepMind News
M
MIT News - Artificial intelligence
N
Netflix TechBlog - Medium
Engineering at Meta
Engineering at Meta
量子位
I
InfoQ
小众软件
小众软件
P
Proofpoint News Feed

VictoriaMetrics: Simple & Reliable Monitoring for Everyone on VictoriaMetrics

Operator now has Long-Term Support (LTS) version Multi-tiered Observability: A Practical Way to Handle Diverse Workloads VictoriaMetrics April 2026 Ecosystem Updates Not All Telemetry Requires Premium Pricing VictoriaMetrics at KubeCon Amsterdam: Community Highlights What's new in VictoriaMetrics Anomaly Detection (Q1 2026) What's New in VictoriaMetrics Cloud Q1 2026? Logs, MCP Server, Better Alerting, and... a Secret Project VictoriaMetrics at KubeCon: Optimizing Tail Sampling in OpenTelemetry with Retroactive Sampling VictoriaMetrics March 2026 Ecosystem Updates Observability Lessons From OpenAI Benchmarking Kubernetes Log Collectors: vlagent, Vector, Fluent Bit, OpenTelemetry Collector, and more VictoriaMetrics February 2026 Ecosystem Updates VictoriaMetrics at FOSDEM, Cloud Native Days France, and CfgMgmtCamp Ghent VictoriaLogs in VictoriaMetrics Cloud: Fast, Cost-Effective Log Management is Here What’s new in VictoriaMetrics Anomaly Detection (2025) VictoriaMetrics January 2026 Ecosystem Updates VictoriaLogs Basics: What You Need to Know, with Examples & Visuals What's New in VictoriaMetrics Cloud Q4 2025? New tiers, more deployment options, IaC and alerting rules. Vibe coding tools observability with VictoriaMetrics Stack and OpenTelemetry How a US Software Provider Improved Traffic Alerting with VictoriaMetrics Anomaly Detection VictoriaMetrics 2025 Developer Experience: A Year in Review Spotify’s performance & control across large monitoring environments with VictoriaMetrics VictoriaMetrics Achieves Red Hat OpenShift Operator Certification Our latest updates across the VictoriaMetrics Observability ecosystem New Capacity Tiers in VictoriaMetrics Cloud Announcing 1B+ Downloads & Product Development With Logs, Traces, Metrics AI Agents Observability with OpenTelemetry and the VictoriaMetrics Stack Discarding gRPC-Go: The Story Behind OTLP/gRPC Support in VictoriaTraces What's New in VictoriaMetrics Cloud Q3 2025? From new region in Asia to proactive alerts How DreamHost Slashed Memory Usage by 80% and Scaled to 76 Million Time Series Upcoming Conferences & Meetups: Where to Meet Our Team VictoriaMetrics Long-Term Support (LTS): H2 2025 Update Creating a Sustainable Open Source Business Model - Introduction Full-Stack Observability with VictoriaMetrics in the OTel Demo Alerting Best Practices vmanomaly Deep Dive: Smarter Alerting with AI (Tech Talk Companion) VictoriaLogs Practical Ingestion Guide for Message, Time and Streams Monotonic and Wall Clock Time in the Go time package Hello Singapore! VictoriaMetrics Cloud Expands to Asia Pacific MCP Server Integration & Much More: What's New in VictoriaMetrics Cloud Q2 2025 FIPS 140-3 Compatible Builds for VictoriaMetrics Enterprise Components VictoriaLogs Unleashed: Cluster Version Now Available for Exceptional, Linear Scaling Integrations made easy with VictoriaMetrics Cloud Developer's Note: Research on Distributed Tracing, Comparing With Tempo and ClickHouse vmagent: Key Features Explained in Under 15 Minutes Go synctest: Solving Flaky Tests vmalert: Maximize Your Monitoring (Tech Talk Companion) Celebrating 14K Stars on GitHub: Spring Update vmalert: Maximize Your Monitoring VictoriaMetrics Connects with the Open Source Community at LinuxFest Northwest 2025 Graceful Shutdown in Go: Practical Patterns VictoriaLogs: Gaps, Gains & Growth Prometheus Monitoring: Functions, Subqueries, Operators, and Modifiers VictoriaMetrics Cloud: What's New in Q1 2025? Don’t default to microservices: You’ll thank us later! Container CPU Requests & Limits Explained with GOMAXPROCS Tuning gRPC in Go: Streaming RPCs, Interceptors, and Metadata From Chaos to Clarity with VictoriaLogs Prometheus Alerting 101: Rules, Recording Rules, and Alertmanager Heading to London: Meet Our Team at KubeCon Europe 2025 Inside vmselect: The Query Processing Engine of VictoriaMetrics Meet Our Team at Scale 22x Practical Protobuf - From Basic to Best Practices 24th of February 2025 Statement: VictoriaMetrics Stands with Ukraine! Prometheus Metrics Explained: Counters, Gauges, Histograms & Summaries Prometheus Monitoring: Instant Queries and Range Queries Explained 300%+ Growth in 2024: Join Our Team in 2025! FOSDEM 2025 recap How Protobuf Works—The Art of Data Encoding OpenTelemetry, Prometheus, and More: Which Is Better for Metrics Collection and Propagation? How vmstorage Handles Query Requests From vmselect How vmstorage's IndexDB Works VictoriaMetrics Tech Talk Stream: A Deep Dive into Blackbox Monitoring How HTTP/2 Works and How to Enable It in Go VictoriaMetrics Cloud: What's New in Q4 2024? How vmstorage Processes Data: Retention, Merging, Deduplication,... How vmstorage Handles Data Ingestion From vminsert When Metrics Meet vminsert: A Data-Delivery Story From net/rpc to gRPC in Go Applications VictoriaMetrics helps IHI Terrasun Win Big in Vegas on $1.2B Clean Energy Project Piros | VictoriaMetrics Partner Allenta | VictoriaMetrics Partner CloudRaft | VictoriaMetrics Partner Sensedia & VictoriaMetrics: API-compatible Efficient Storage Scalable Prometheus: Why DSV Chose VictoriaMetrics Sensor Factory | VictoriaMetrics Partner Erythix | VictoriaMetrics Partner Groove X & VictoriaMetrics: Faster Device Health Monitoring Scaled & Performant Monitoring at Spotify with VictoriaMetrics Grammarly & VictoriaMetrics: 10× Lower Costs & Direct Access Zelarsoft | VictoriaMetrics Partner DFKI & VictoriaMetrics: Efficient Long-Term Metric Storage Niubits | VictoriaMetrics Partner Megazone Cloud | VictoriaMetrics Partner Cogito Software | VictoriaMetrics Partner Bajau | VictoriaMetrics Partner Find Out Why Dig Security Chose VictoriaMetrics! Ness | VictoriaMetrics Partner Alpha Data | VictoriaMetrics Partner SIOS Technology | VictoriaMetrics Partner
VictoriaLogs Status Update: Heading Towards the Cluster Version
Aliaksandr Valialkin / Jean-Jerome Schmidt-Soisson · 2025-02-26 · via VictoriaMetrics: Simple & Reliable Monitoring for Everyone on VictoriaMetrics

Today, we’re thrilled to share the latest updates on VictoriaLogs, your trusted open-source solution for efficient and user-friendly log management. Whether you’re just discovering VictoriaLogs or have been using it for a while, this post will walk you through the recent enhancements and give you a sneak peek at the much anticipated cluster version that’s on the horizon.

Since its first release, and walking in VictoriaMetrics’ footsteps, VictoriaLogs has been about delivering top-notch performance without the hefty resource demands. It uses up to 30 times less RAM and up to 15 times less disk space compared to alternatives like Elasticsearch and Grafana Loki. This efficiency means VictoriaLogs can run smoothly on anything from a Raspberry Pi to high-end servers with hundreds of CPU cores and terabytes of RAM.

Why Choose VictoriaLogs?

#

One of the standout features of VictoriaLogs is its simplicity. Setting it up is a breeze, with minimal configuration required. This means you can dive right into managing your logs without getting bogged down by complex tuning processes. Plus, VictoriaLogs integrates seamlessly with popular log collectors, making it a perfect fit for your existing setup.

For those who need robust querying capabilities, VictoriaLogs offers LogsQL—a query language that’s both user-friendly and powerful. With full-text search capabilities across all log fields, LogsQL makes it easy to extract meaningful insights from your logs. The built-in web UI and Grafana plugin further enhance your ability to explore and visualize logs, while the interactive command-line tool adds an extra layer of flexibility.

VictoriaLogs is built to handle logs with high cardinality fields, such as trace IDs, user IDs, and IP addresses, making it ideal for complex log analysis. It also supports wide events, which are logs with hundreds of fields, and provides multitenancy support for managing multiple users or projects within a single instance.

Technical Insights

#

VictoriaLogs sets itself apart from competitors like Elasticsearch and Grafana Loki by utilizing bloom filters by default instead of inverted indexes. Bloom filters are efficient data structures that quickly determine whether a specific term, like “error,” exists within a block of logs. This allows VictoriaLogs to skip irrelevant blocks, saving both time and resources, especially when searching for rare terms within logs.

Efficiency and Cost Savings

#

By leveraging bloom filters, VictoriaLogs significantly reduces disk I/O and CPU usage, avoiding unnecessary data processing. This results in substantial cost savings, particularly when dealing with large volumes of logs. Unlike other solutions that may struggle with high cardinality fields like IP addresses or trace IDs, VictoriaLogs handles these efficiently, ensuring optimal performance.

Log Streams and Indexing

#

VictoriaLogs employs the concept of log streams, popularized by Grafana Loki. Log streams group logs from a single source, making it easier to explore logs from specific applications. VictoriaLogs improves upon this by not requiring users to configure indexes, which can be complex and time-consuming in systems like Elasticsearch. This simplicity allows VictoriaLogs to work efficiently out of the box, automatically indexing all log fields received.

Query Language and Performance

#

The query language in VictoriaLogs, LogsQL, is designed for simplicity and power. Users can perform straightforward searches or complex queries with ease. The system supports data extraction functions and analytical calculations, optimized for speed and performance. Inspired by ClickHouse, VictoriaLogs uses techniques that ensure fast query processing, even over large datasets. We’d go so far as to say that LogsQL is better than SQL in pretty much all aspects: It is easier to write, it is easier to read and follow, and it is more powerful: See our docs for details.

Parallel Processing

#

VictoriaLogs parallelizes the execution of heavy queries on all available CPU cores. This means that when a query is executed over a large volume of logs, the system reads and processes these logs in parallel, significantly reducing query duration. This capability allows VictoriaLogs to scale vertically on a single node, making it highly efficient for large-scale log analysis.

Advanced Functionalities and Use Cases

#

VictoriaLogs offers a robust platform for tracking and analyzing logs, providing powerful functionalities that cater to a wide range of use cases. For instance, if you’re interested in tracking new GitHub issues that mention a specific word, such as “DeepSeek,” the VictoriaLogs playground has you covered. You can explore issues opened on a specific date using a simple query interface.
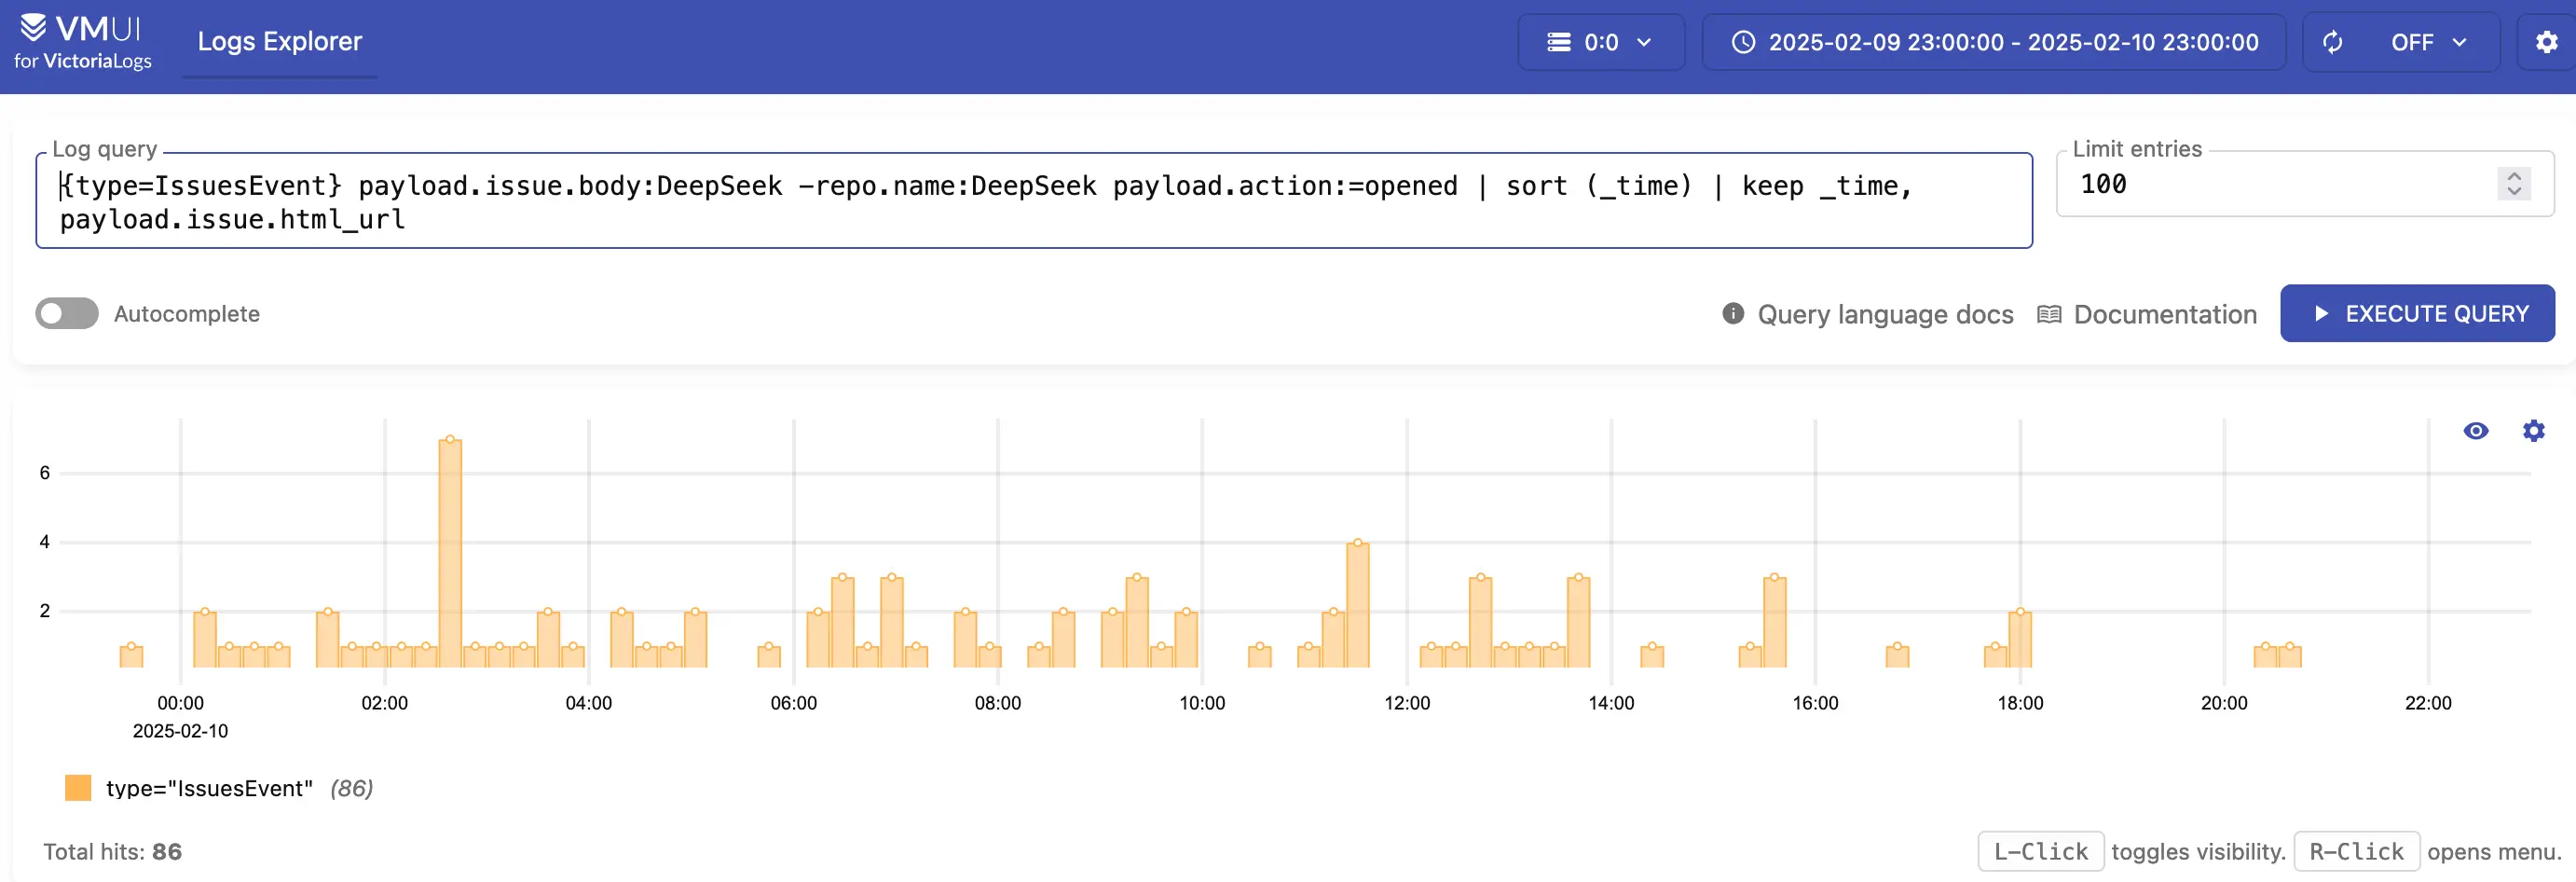
Moreover, if you’re curious about which GitHub issues have garnered the most comments, VictoriaLogs allows you to delve into this data effortlessly. The platform’s intuitive query capabilities make it easy to identify trends and insights within large datasets.

More recently, VictoriaLogs introduced such useful functions like the histogram stats function for heatmap visualizations in Grafana and the union pipe for combining results from multiple queries. These enhancements further solidify VictoriaLogs as a versatile tool for log analysis.

For those dealing with large-scale log data, VictoriaLogs provides tools like the collapse_nums pipe to analyze and identify patterns, such as determining which sources contribute the most to your log volume. This is particularly useful for managing and understanding “big data” environments, where a single node can process vast amounts of data efficiently.

VictoriaLogs also supports alerting functionalities, allowing users to set up notifications based on log data, ensuring that critical issues are addressed promptly. Additionally, with support for joins, users can perform complex queries that combine data from multiple sources, enhancing the platform’s analytical capabilities.

Recently, VictoriaLogs demonstrated its ability to efficiently ingest and query wide events—logs with hundreds of high-cardinality fields. By successfully handling events from the GitHub Archive, VictoriaLogs showcased its capacity to manage and analyze complex datasets at high speeds.

Upcoming Cluster Version of VictoriaLogs

#

We are excited to announce updates regarding the upcoming cluster version of VictoriaLogs:

  • Seamless Migration: The migration from single-node VictoriaLogs to the cluster version will be seamless. Users can replace the single-node executable with the storage node executable, as both versions share an identical data storage format. This allows users to start with the single-node version and instantly switch to the VictoriaLogs cluster when it becomes available.
  • Global Querying: The “select” component of the VictoriaLogs cluster will provide a global querying view across multiple single-node instances. Users can start collecting different logs into multiple single-node instances and explore all these logs via a single query once the cluster version of VictoriaLogs is published.

VictoriaLogs Status Update: We’re Just Getting Started!

#

VictoriaLogs represents a significant advancement in observability, combining efficiency, simplicity, and performance. As we continue to innovate, our focus remains on providing users with the tools they need to manage and analyze their data effectively. With its ability to handle high cardinality fields, efficient query processing, and support for wide events and traces, VictoriaLogs is set to become an indispensable tool for engineers, developers and enterprises alike.

Stay tuned for more updates and get started with VictoriaLogs here!