





At VictoriaMetrics, we built vlagent as a high-performance log collector for VictoriaLogs. To validate its performance and correctness under a real production-like load, we developed a benchmark suite and ran it against 8 popular log collectors. This post covers the methodology, throughput results, resource usage, and delivery correctness.
Collectors under the test:
Promtail and Grafana Agent are the predecessors to Grafana Alloy. They were included to show the performance difference between generations.
We’ve made all benchmark configurations and source code public,
so you can reproduce and verify the results independently.
The benchmark source code is available at: https://github.com/VictoriaMetrics/log-collectors-benchmark
The benchmark consists of four parts:
log-generator - a program deployed as multiple Pods, each writing JSON log records to stdout at a configurable rate.
Each record contains a sequence_id (monotonically increasing integer), timestamp, and a randomly selected subset
of fields typical for structured logs in Kubernetes applications: log level, component name, HTTP method, status, etc.
The average record size is ~216 bytes.
{"_time":"...","_msg":"API rate limit exceeded","sequence_id":50,"level":"DEBUG","status_code":404}
{"_time":"...","_msg":"Payment transaction initiated","sequence_id":51,"level":"INFO","component":"user-service","method":"GET","status_code":500,"duration_ms":209,"user_id":"user_5111","bytes_sent":3836,"region":"ap-southeast-1"}
{"_time":"...","_msg":"Service health check passed","sequence_id":52,"level":"ERROR","component":"notification-service","method":"PUT","status_code":503,"duration_ms":920,"user_id":"user_9899","bytes_sent":5601,"error_type":"AuthenticationError","trace_id":"trace-a1b2c3d4"}
{"_time":"...","_msg":"User authentication completed","sequence_id":53,"component":"payment-service","status_code":201,"duration_ms":322,"user_id":"user_9454"}
Log collector - the system under test. Tails Pod logs from /var/log/pods or /var/log/containers,
parses JSON-encoded log entry content generated by a log-generator Pod, and ships records to log-verifier
using a collector-specific protocol:
JSON Lines (vlagent, Vector, Fluent Bit, Fluentd),
Loki (Alloy, Grafana Agent, Promtail),
Elasticsearch (Filebeat),
OpenTelemetry (OpenTelemetry Collector).
log-verifier - receives logs from collectors, supporting all protocols listed above.
For each collector + Pod pair it tracks the maximum observed sequence_id and the total number of received logs.
Since sequence_id starts at 1 and increments strictly by 1, any gap between the two values indicates lost logs.
It also tracks delivery latency - the time between log record generation and its arrival at log-verifier - as a histogram.
All metrics are exposed via Prometheus.
VictoriaMetrics + Grafana - collect and visualize container CPU/memory metrics and log-verifier output.
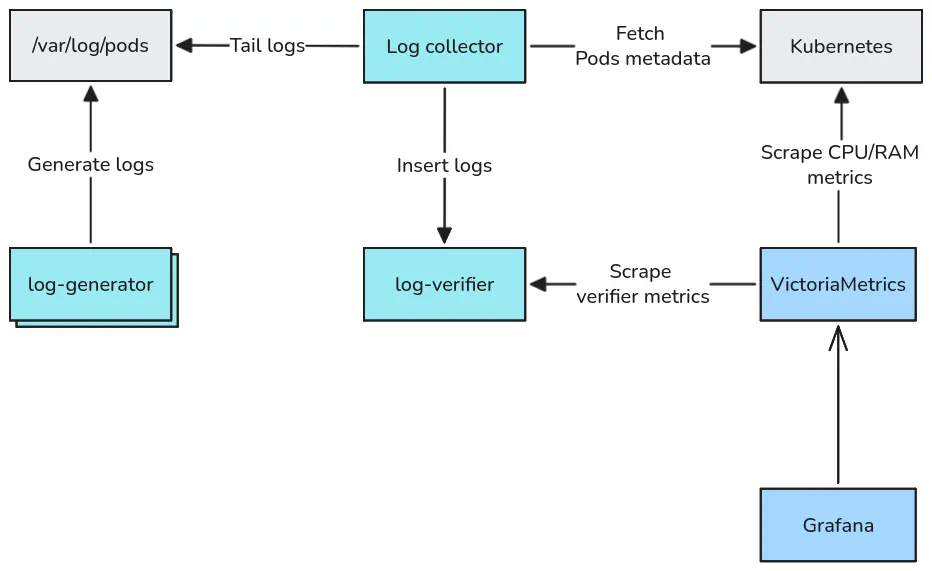 Benchmark Architecture
The benchmark ran on a Google Cloud n2-highcpu-32 VM (32 vCPUs, 32 GiB RAM, local SSD disk)
running all components - log collectors, log-generator, log-verifier, VictoriaMetrics, vmagent, and Grafana -
in a single-Node kind Kubernetes cluster.
Running all collectors on the same Node with a local SSD shared across the collector Pods is intentional. Local SSD provides enough write IO bandwidth for storing the logs generated by log-generator. Log files read by collectors are likely to be cached by the OS page cache, so the disk read IO shouldn’t be a bottleneck too. For CPU and RAM, collectors in production typically share a Node with other workloads - running all collectors simultaneously emulates that contention. The Node CPU utilization stayed below 50% throughout the benchmark, so there was enough headroom for all collectors to compete fairly without the Node itself becoming a bottleneck.
Every collector was deployed via its official Helm chart with identical resource constraints:
No performance tuning was applied to any collector - no custom buffer sizes, batch sizes, flush intervals, worker thread counts, or runtime parameters such as GC settings. All configurations are based on the official Helm chart defaults with only the minimal changes required to integrate with the benchmark environment.
The graph below shows log ingestion rate over time across all collectors running simultaneously, with 100 independent log-generator Pods each writing to its own dedicated log file:
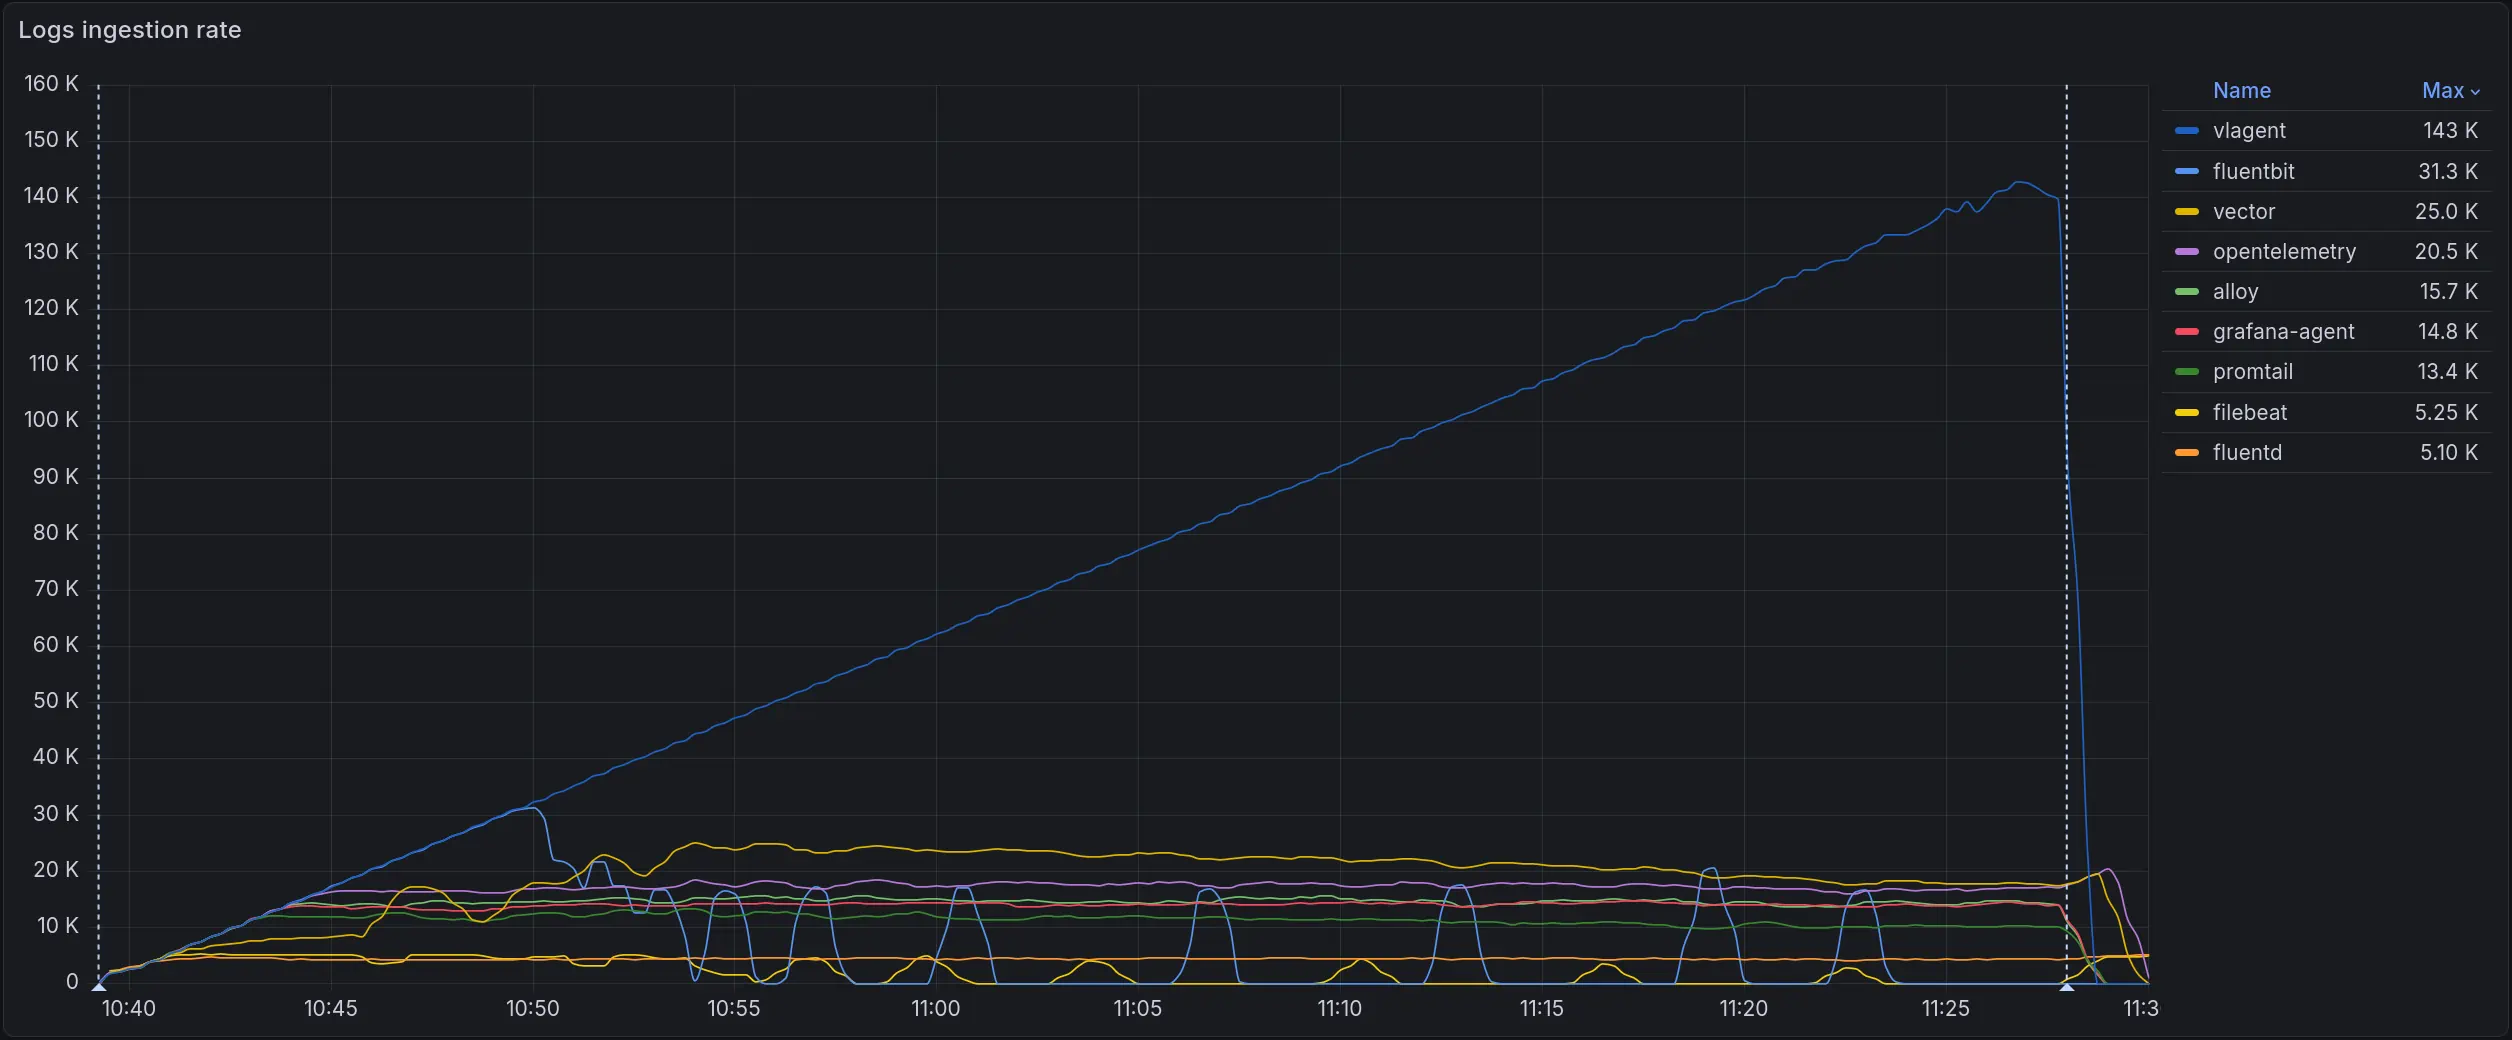 Log ingestion rate (logs/sec). vlagent in blue reaches ~143k logs/sec at peak. All other collectors plateau between 5k-40k
vlagent continues scaling linearly as load increases, while other log collectors hit a ceiling below 40k logs/sec. The second-place Fluent Bit plateaus at 31.3k - 4.5x lower than vlagent’s peak.
Maximum throughput per collector in the 100-Pod scenario:
| Collector | Max throughput (logs/sec) | vs leader |
|---|---|---|
| vlagent | 143 000 | 1.0x |
| Fluent Bit | 31 300 | 4.5x |
| Vector | 25 000 | 5.7x |
| OpenTelemetry Collector | 20 500 | 6.9x |
| Alloy | 15 700 | 9.1x |
| Grafana Agent | 14 800 | 9.7x |
| promtail | 13 400 | 10.6x |
| Filebeat | 5 250 | 27.2x |
| fluentd | 5 100 | 28.0x |
The 100-Pod scenario was chosen as the primary comparison point because Kubernetes recommends a maximum of 110 Pods per Node, making 100 Pods a realistic upper bound for a single-Node deployment. Since the goal of the benchmark is to stress the system to its limits, this is the most relevant scenario. Additional snapshots for 1, 50, 150, and 200 Pods are available in the Detailed Results section for comparison, though the differences between scenarios are minimal.
To fairly compare CPU efficiency, we look at resource usage at ~10k logs/sec (2 Pods * 5000 logs/sec) - where almost all collectors are still operating without losses. Filebeat and fluentd are excluded from this comparison as they were already losing logs at this throughput level.
| Collector | CPU at 10k logs/sec | vs leader |
|---|---|---|
| vlagent | 0.062 | 1.0x |
| Fluent Bit | 0.260 | 4.2x |
| Vector | 0.412 | 6.6x |
| OpenTelemetry Collector | 0.491 | 7.9x |
| Grafana Agent | 0.552 | 8.9x |
| Alloy | 0.578 | 9.3x |
| promtail | 0.655 | 10.5x |
See the full Grafana snapshot for complete details.
The graph below shows CPU usage across the full test duration as load increased from zero to each collector’s ceiling:
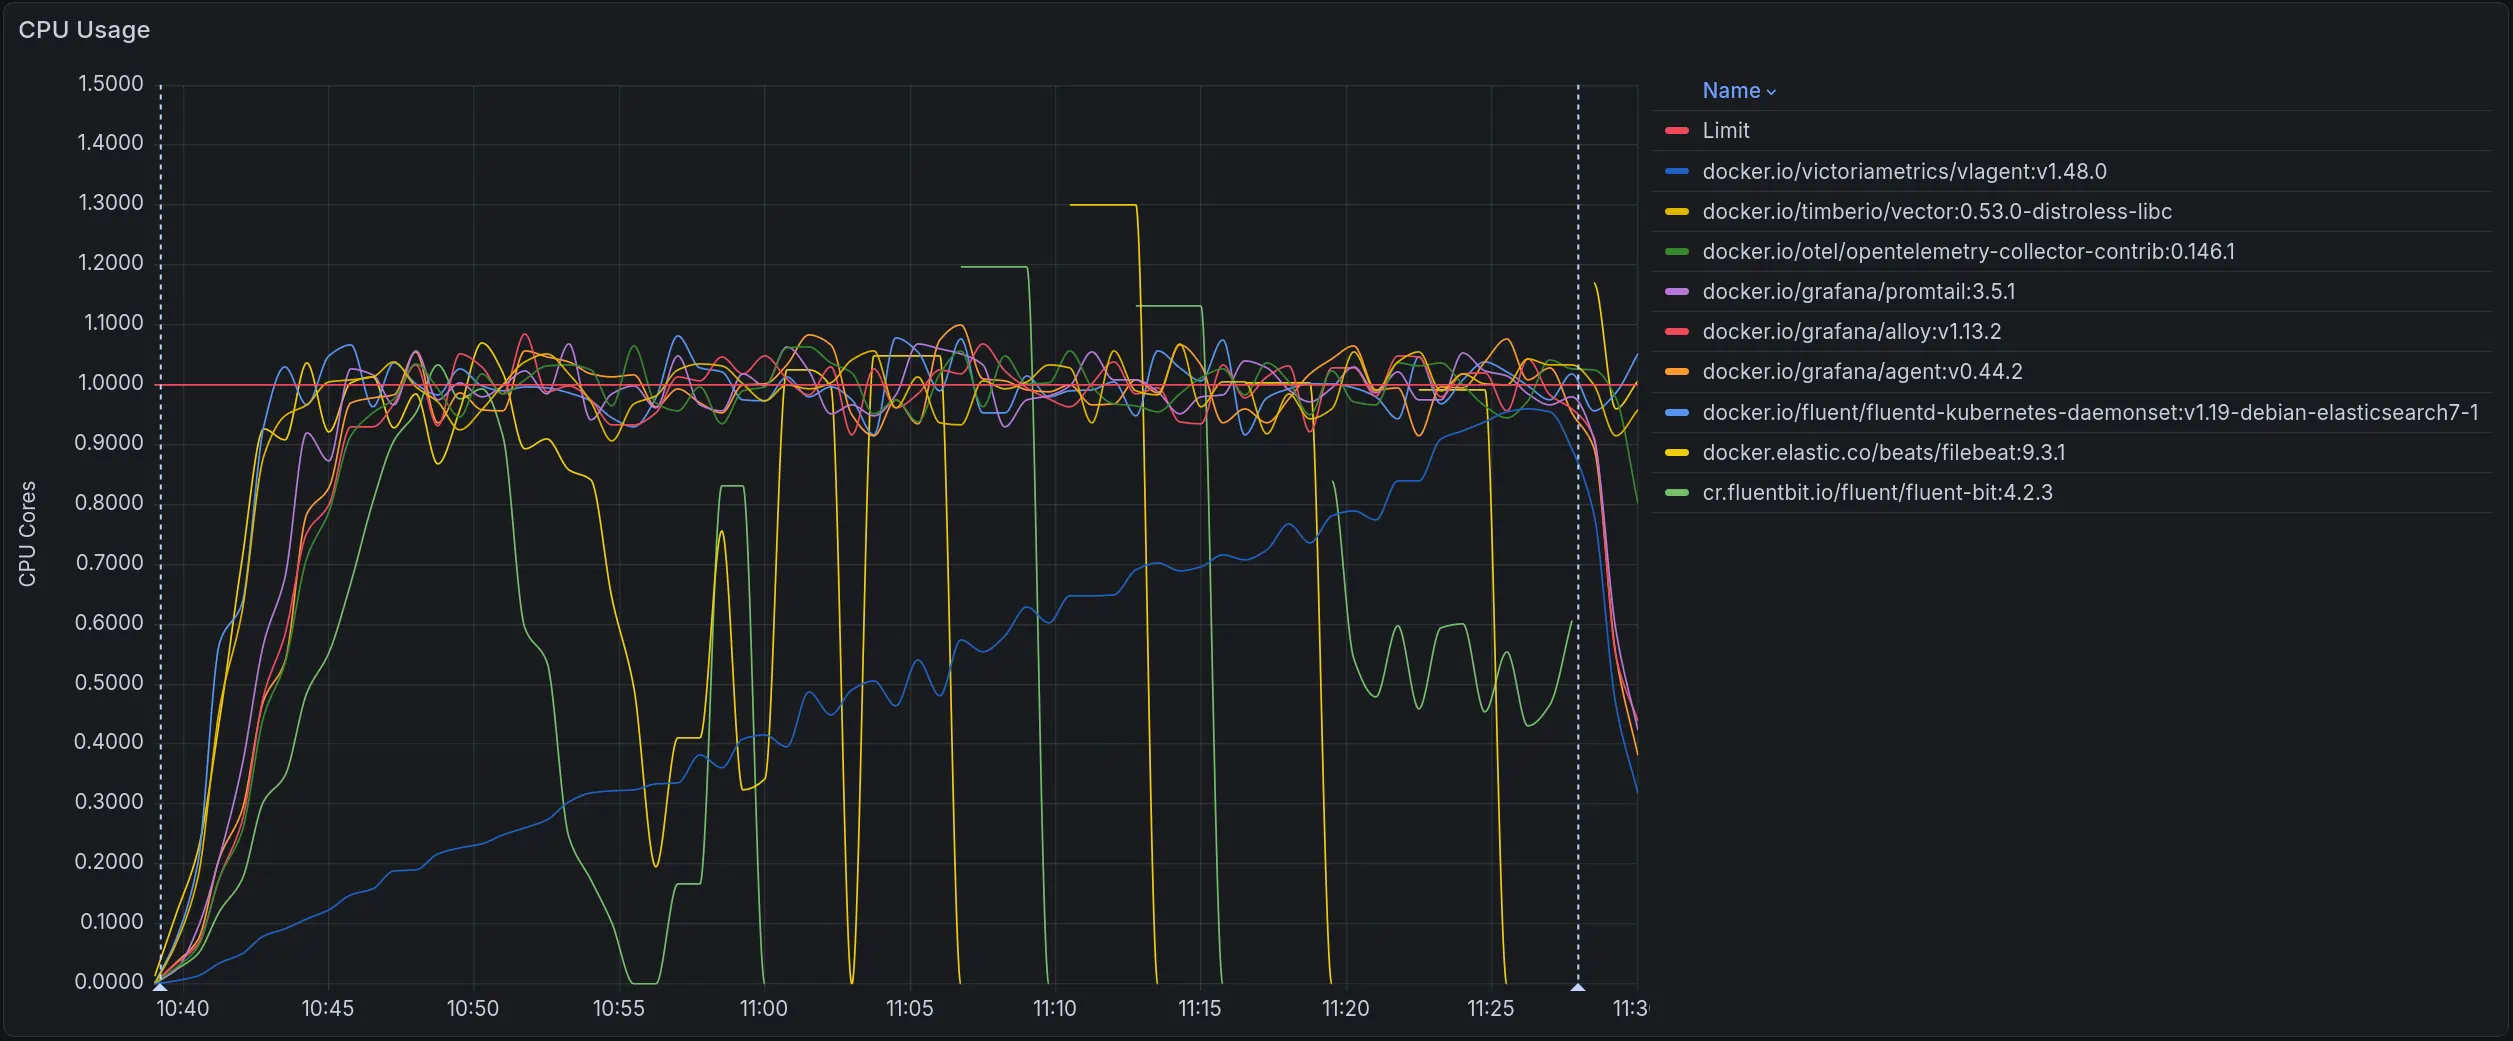 CPU usage across all collectors. The red line marks the 1-core limit
Fluent Bit’s and Filebeat’s peak memory exceeds the 1 GiB container limit under the load, causing the container to be killed by the OOM killer. This causes gaps in the graph.
Memory is measured at the same ~10k logs/sec throughput point where almost all collectors operate without losses. Filebeat and fluentd are excluded from this comparison as they were already losing logs at this throughput level.
| Collector | Mean memory at 10k logs/sec | vs leader |
|---|---|---|
| vlagent | 27.91 MiB | 1.0x |
| promtail | 63.00 MiB | 2.2x |
| Alloy | 66.44 MiB | 2.4x |
| Grafana Agent | 72.49 MiB | 2.6x |
| Fluent Bit | 78.10 MiB | 2.8x |
| OpenTelemetry Collector | 106.83 MiB | 3.8x |
| Vector | 153.50 MiB | 5.5x |
See the full Grafana snapshot for complete details.
The graph below shows memory usage across the full test duration as load increased from zero to each collector’s ceiling:
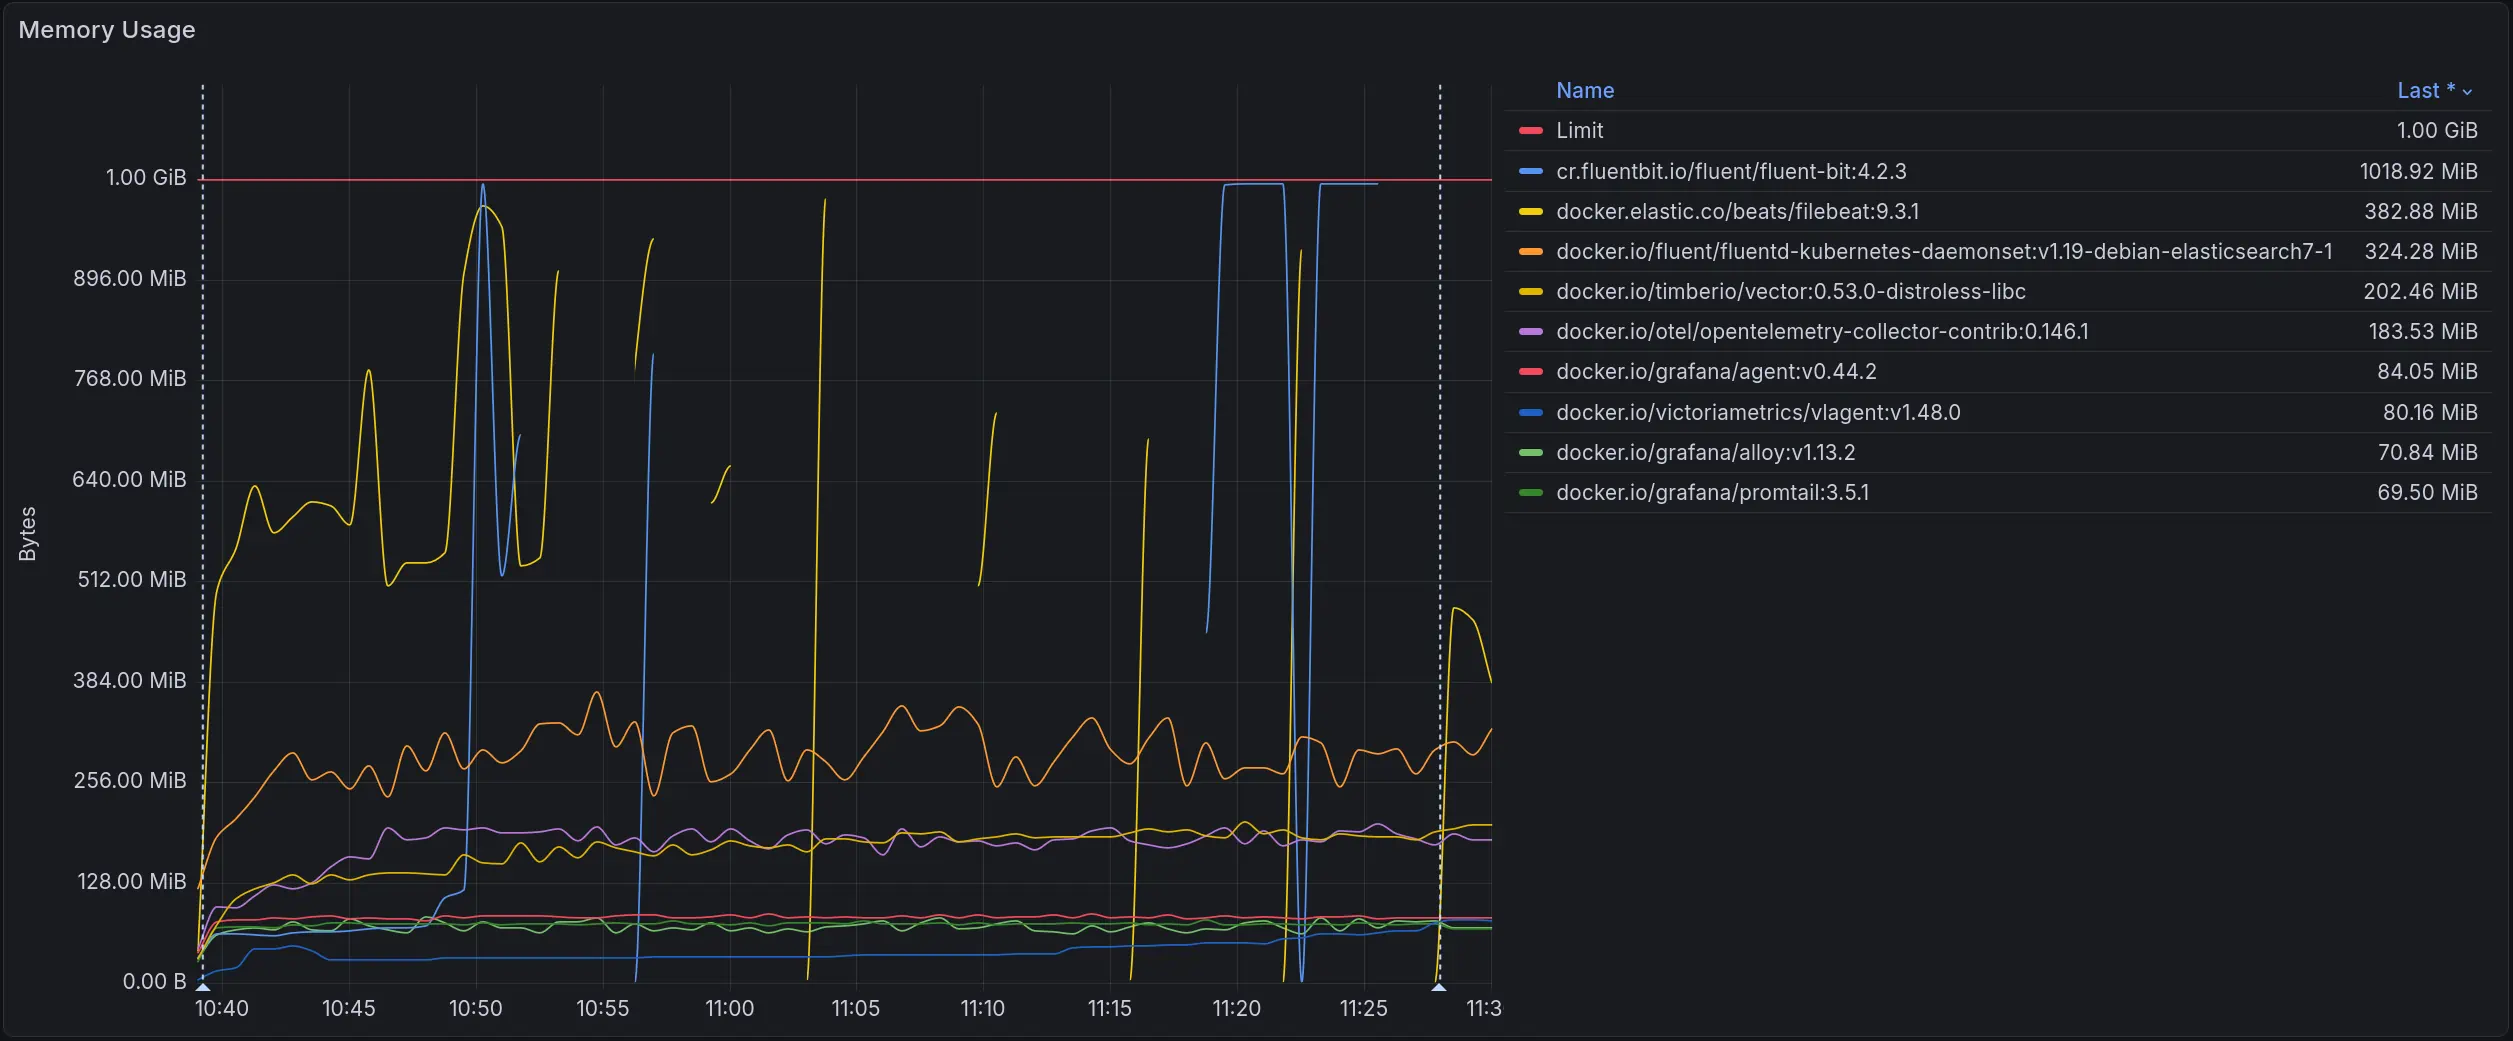 Memory usage across all collectors. The red line marks the 1 GiB limit
Fluent Bit’s and Filebeat’s peak memory exceeds the 1 GiB container limit under the load, causing the container to be killed by the OOM killer. This causes gaps in the graph.
The snapshots below contain the full set of metrics for each scenario: log loss rate, throughput, CPU and memory usage, network usage, container restarts, and CPU throttling.
| Pods | Snapshot |
|---|---|
| 1 | view |
| 10 | view |
| 50 | view |
| 100 | view |
| 150 | view |
| 200 | view |
We do not measure beyond 200 Pods since Kubernetes recommends a maximum of 110 Pods per Node.
Both Fluent Bit and Vector can send incomplete log records during container log file rotation.
The root cause is in how containerd handles writes during rotation: under high throughput,
containerd may write only a part of the log record to the current file before rotation occurs,
with the remainder going to the new file.
The result is malformed JSON records with missing fields. If your pipeline relies on specific fields for routing, filtering, or transformation, these records will cause problems - they arrive, but broken.
This problem is expected when a collector does not have enough CPU to keep up with the log stream:
it will miss the moment when containerd rotates a file and splits a record across two files.
Any collector can hit this, including vlagent.
What makes the Fluent Bit and Vector cases notable is that they produced split records even when CPU usage was low.
Unlike other collectors, they do not join fragments from two files into a single record - each part is forwarded as a separate log record.
We reported this to the Fluent Bit team: https://github.com/fluent/fluent-bit/issues/11602
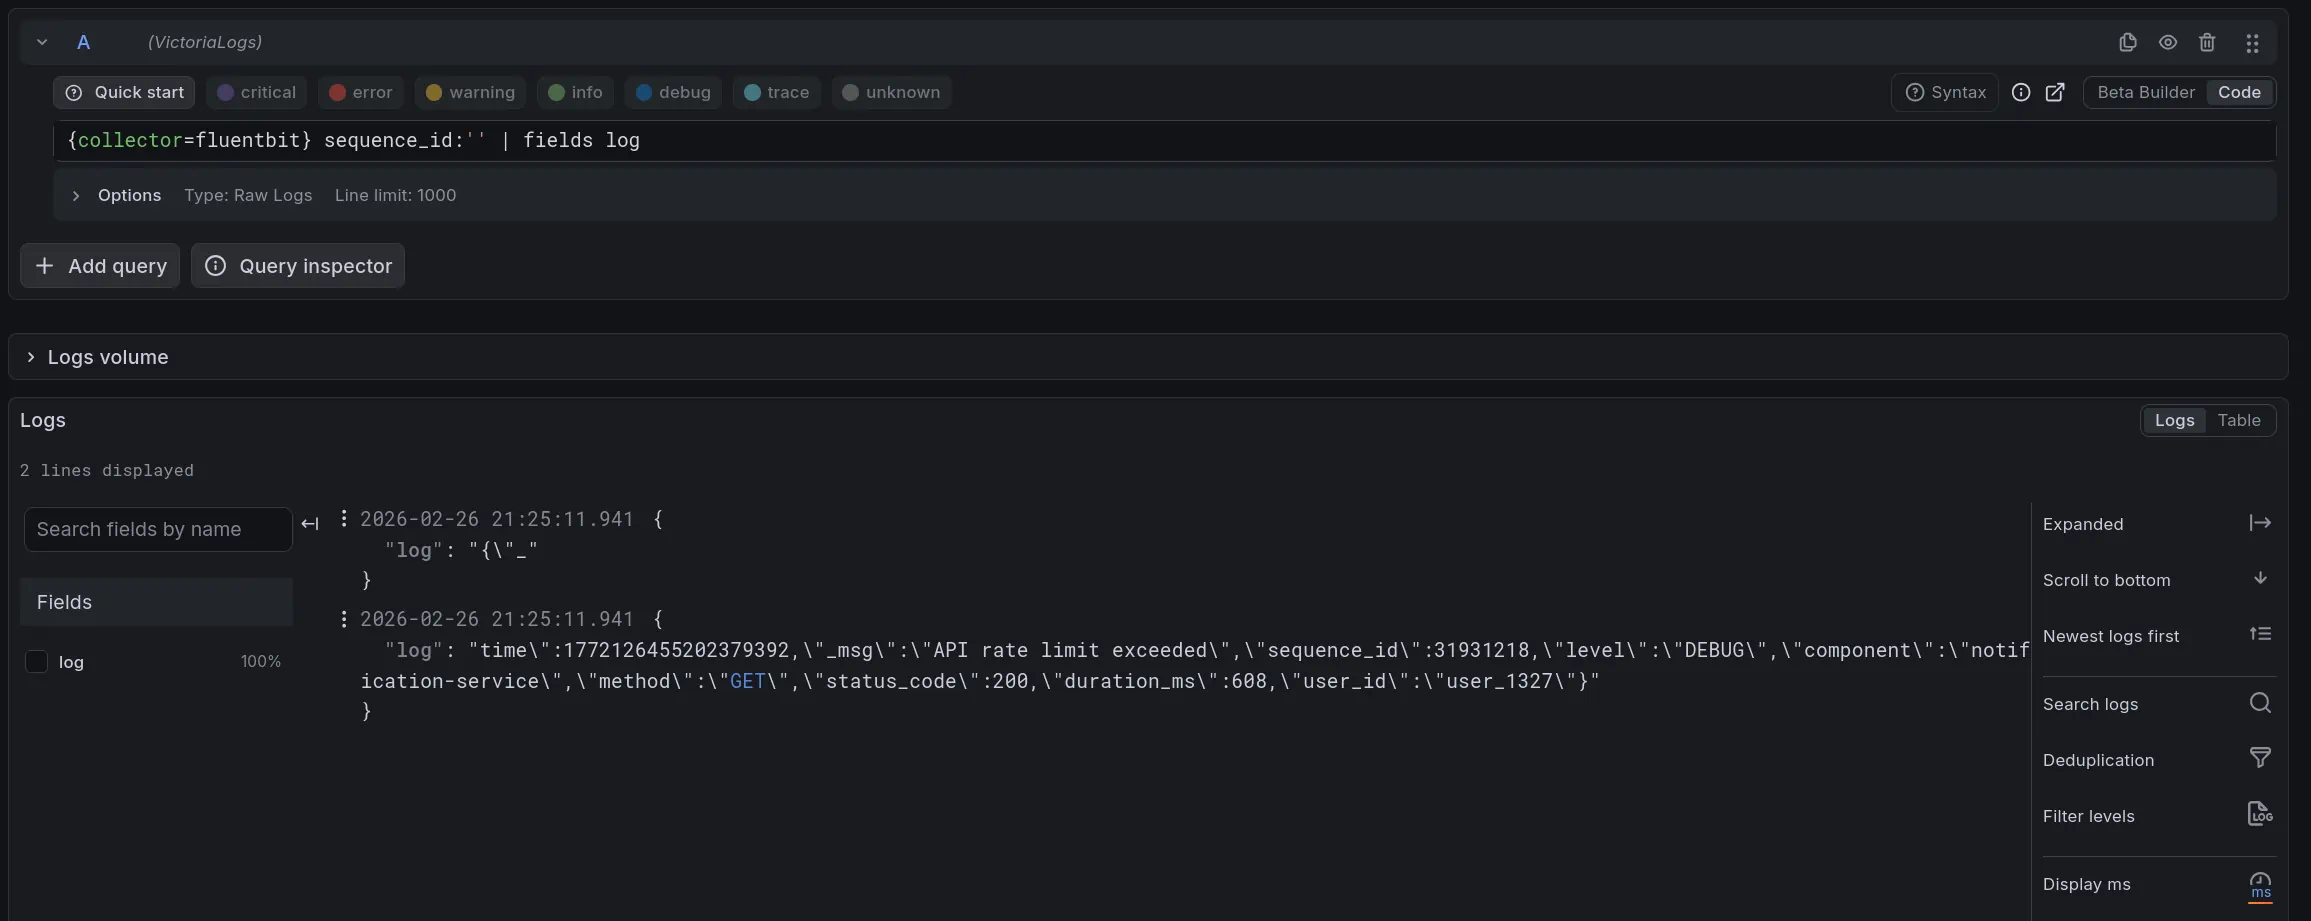 FluentBit: Incomplete log records
Vector also produced split records in our tests, though much less frequently - 2 vs 34 for Fluent Bit.
Both numbers were recorded over 1 hour of testing under identical load: 10k logs/sec from 2 Pods.
We ran this test many times over many hours - no other collector ever produced a malformed record.
We reported this to the Vector team: https://github.com/vectordotdev/vector/issues/24981
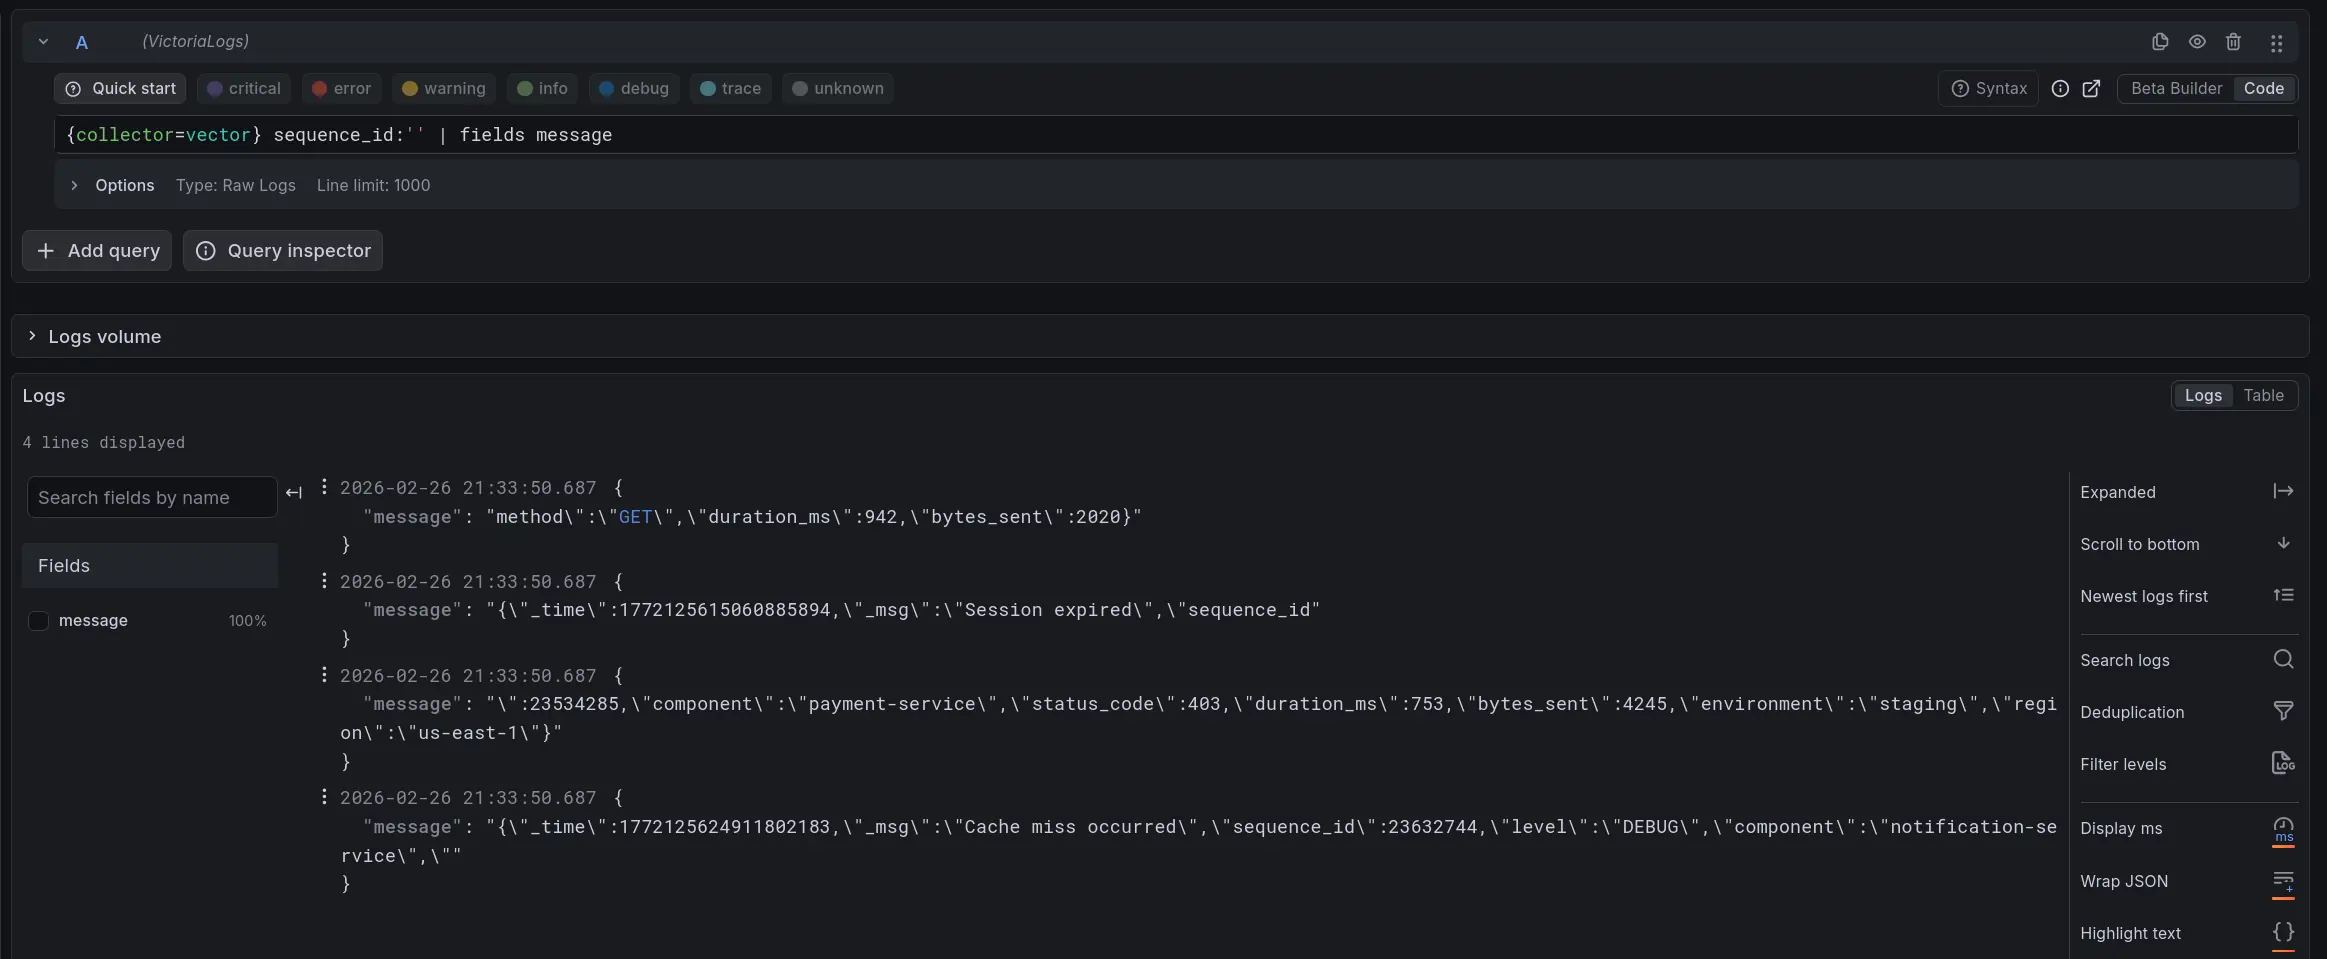 Vector: Incomplete log records
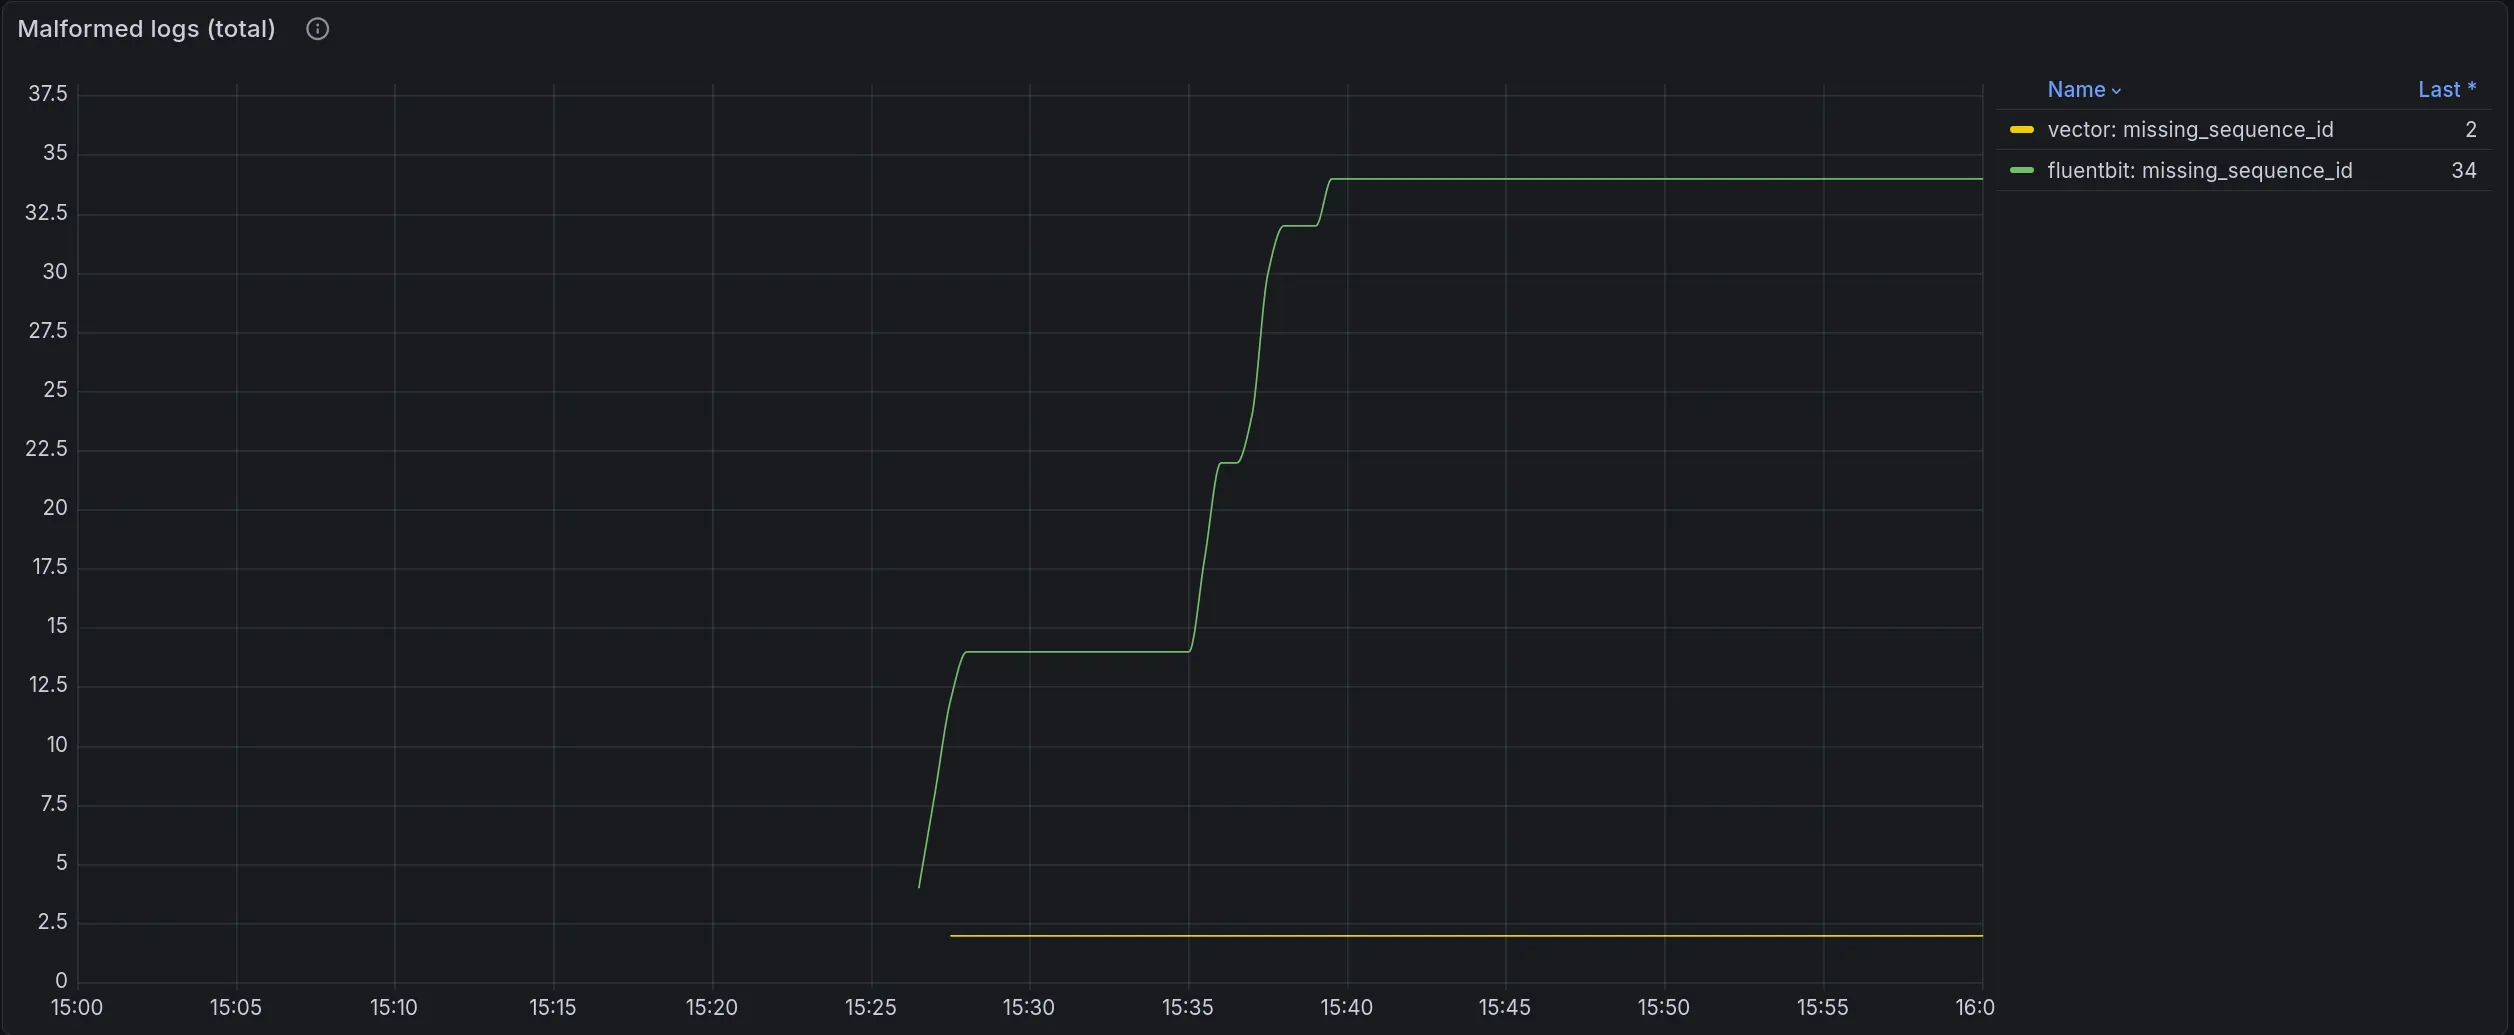 Malformed logs total: Fluent Bit produced 34 records with missing sequence_id, Vector produced 2
See the full Grafana snapshot for complete details.
Vector has a glob_minimum_cooldown_ms parameter that controls how often it rescans the filesystem for new log files.
The default is 60 seconds - long enough that logs written to a new Pod log file can be dropped before Vector picks it up, causing silent log loss.
The fix is to set
glob_minimum_cooldown_ms
to a lower value.
We used 10 seconds in our benchmark, which fixed the issue.
Fluent Bit has a similar option but defaults to 10 seconds, so this problem does not occur out of the box.
Under high load, Vector queues log files faster than it processes them, which causes the number of file descriptors to grow indefinitely. Since the OS cannot delete a file while a process holds it open, rotated log files pile up on disk and can fill the Node’s disk space.
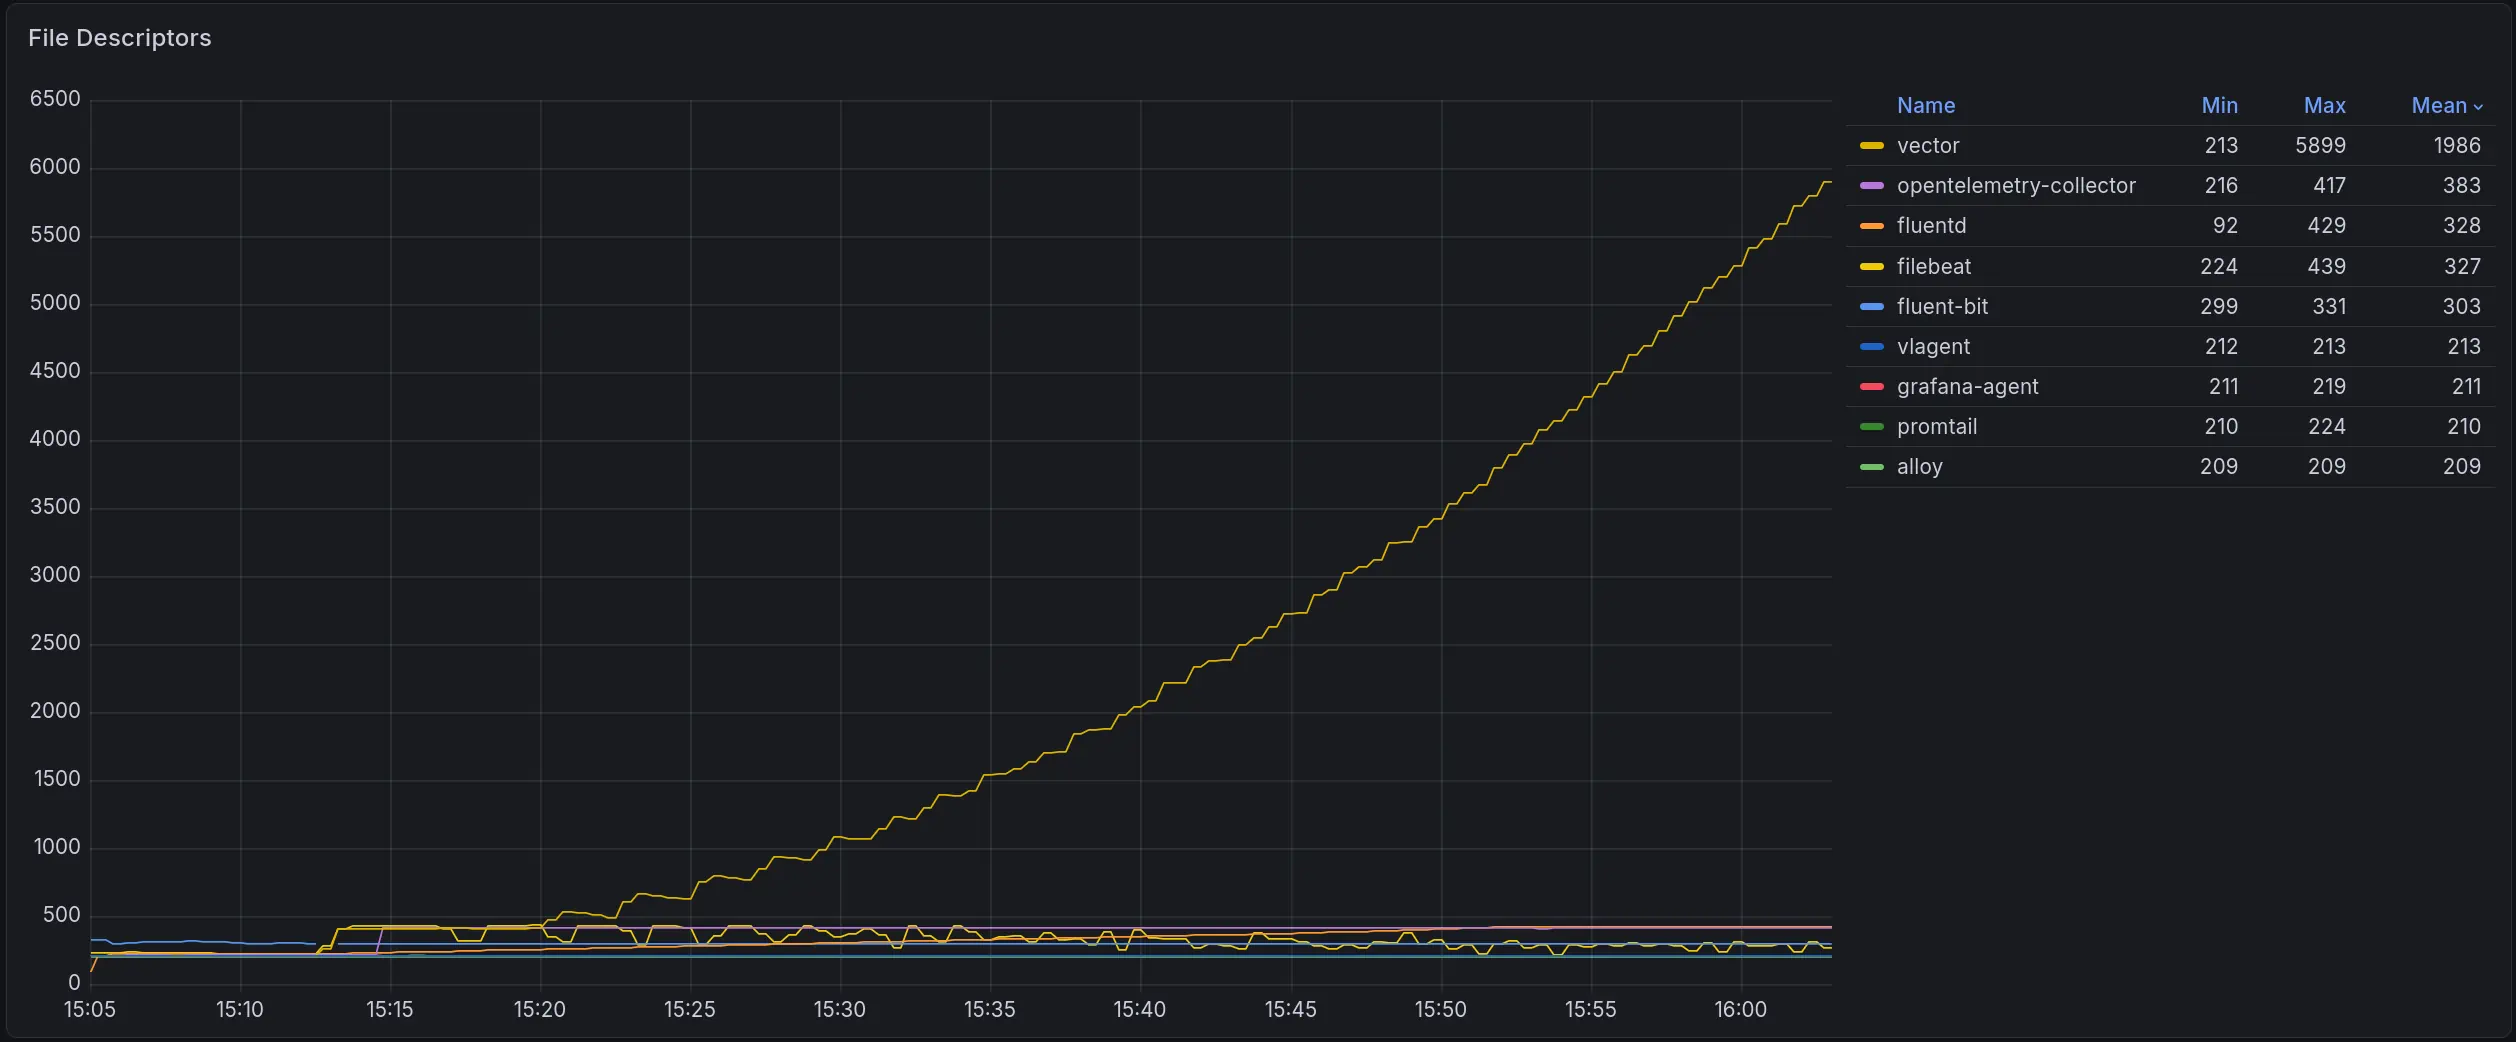 File descriptors growth
If the load drops, Vector will eventually catch up and deliver everything. But if it runs out of disk first, or if it restarts while the backlog is building, the file descriptors are released, the files get deleted, and those logs are gone.
Vector has a rotate_wait_secs option
that controls how long it keeps file descriptors to a rotated log file.
The default value is unlimited, which means Vector will hold rotated files open for as long as it has a backlog.
Setting this to a lower value will cause Vector to release file descriptors to rotated files sooner,
but logs that haven’t been read yet will be lost if the files are deleted before Vector catches up.
Other collectors do not hold open file descriptors to rotated files, so they do not accumulate file descriptors. The downside is that under the same overload conditions they will simply lose the unread logs once the files are rotated and deleted.
To avoid log loss in other collectors under high load:
When a Pod is deleted while Vector still has a backlog of its logs, Vector loses the Pod’s metadata - labels, annotations, and other Kubernetes attributes attached to the log records. The logs are eventually delivered, but stripped of their metadata, which can break filtering and routing downstream.
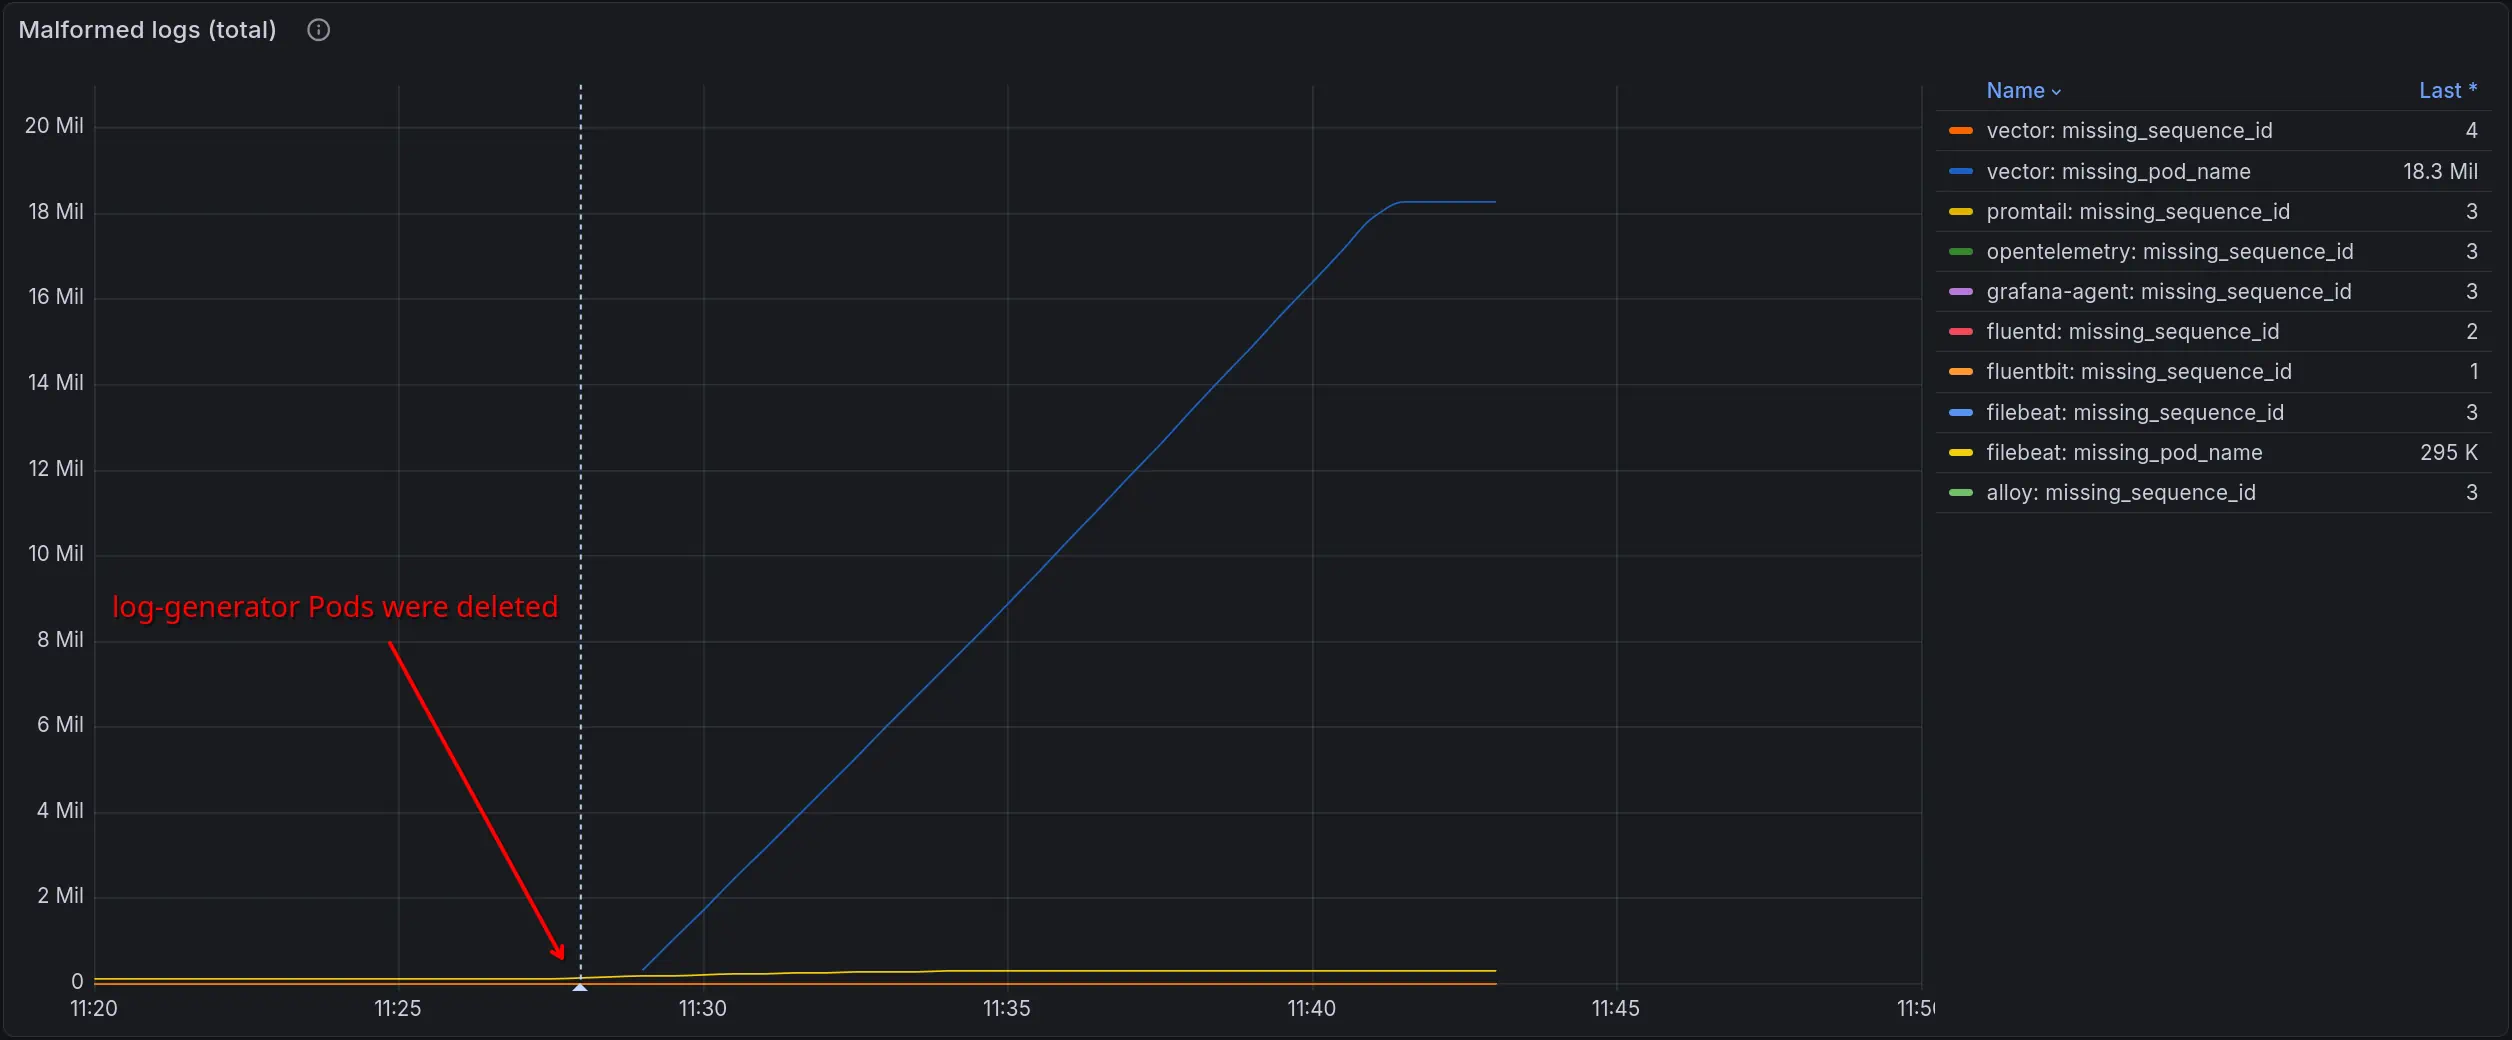 Vector lost Pod metadata
Under identical resource constraints (1 CPU, 1 GiB RAM) and without any tuning:
vlagent does not yet support multiline log joining (e.g., Java stack traces) or custom format parsing (e.g., nginx access logs). If your pipeline relies on these features, stick with a more configurable collector for now. We are working on this - the planned implementation will be based on the LogsQL query language. Follow this feature request for updates.
Otherwise, consider switching to vlagent if you want a simple, fast, and reliable log collector:
I1025 00:15:15.525108 1 controller_utils.go:116] "Pod status updated" is parsed into a structured JSON object automatically.vlagent sends the collected logs to VictoriaLogs by default, but also supports Fluent Bit, Vector, and ClickHouse as destinations. See the documentation for details.
vlagent can be deployed alongside existing log collectors. See the documentation to get started.
此内容由惯性聚合(RSS阅读器)自动聚合整理,仅供阅读参考。 原文来自 — 版权归原作者所有。