


惯性聚合 高效追踪和阅读你感兴趣的博客、新闻、科技资讯
阅读原文 在惯性聚合中打开

推荐订阅源

The GitHub Blog
The GitHub Blog
P
Privacy International News Feed
博客园_首页
Hugging Face - Blog
Hugging Face - Blog
A
About on SuperTechFans
量子位
钛媒体:引领未来商业与生活新知
钛媒体:引领未来商业与生活新知
雷峰网
雷峰网
Cyber Security Advisories - MS-ISAC
V
V2EX
Recent Announcements
博客园 - 叶小钗
B
Blog RSS Feed
Apple Machine Learning Research
Microsoft Azure Blog
H
Help Net Security
C
Check Point Blog
N
Netflix TechBlog - Medium
Y
Y Combinator Blog
P
Proofpoint News Feed
T
The Blog of Author Tim Ferriss
D
DataBreaches.Net
月光博客
月光博客
Engineering at Meta
Engineering at Meta
博客园 - 【当耐特】
Martin Fowler
Martin Fowler
小众软件
小众软件
博客园 - 司徒正美
大猫的无限游戏
大猫的无限游戏
爱范儿
爱范儿
M
MIT News - Artificial intelligence
G
Google Developers Blog
MyScale Blog
MyScale Blog
Google DeepMind News
D
Docker
有赞技术团队
有赞技术团队
H
Hackread – Cybersecurity News, Data Breaches, AI and More
V
Visual Studio Blog
Recorded Future
Recorded Future
I
InfoQ
T
Tailwind CSS Blog
MongoDB | Blog
MongoDB | Blog
人人都是产品经理
人人都是产品经理
云风的 BLOG
云风的 BLOG
美团技术团队
Vercel News
Vercel News
GbyAI
GbyAI
aimingoo的专栏
aimingoo的专栏
奇客Solidot–传递最新科技情报
奇客Solidot–传递最新科技情报
WordPress大学
WordPress大学

VictoriaMetrics: Simple & Reliable Monitoring for Everyone on VictoriaMetrics

Operator now has Long-Term Support (LTS) version Multi-tiered Observability: A Practical Way to Handle Diverse Workloads VictoriaMetrics April 2026 Ecosystem Updates Not All Telemetry Requires Premium Pricing VictoriaMetrics at KubeCon Amsterdam: Community Highlights What's new in VictoriaMetrics Anomaly Detection (Q1 2026) What's New in VictoriaMetrics Cloud Q1 2026? Logs, MCP Server, Better Alerting, and... a Secret Project VictoriaMetrics at KubeCon: Optimizing Tail Sampling in OpenTelemetry with Retroactive Sampling VictoriaMetrics March 2026 Ecosystem Updates Observability Lessons From OpenAI Benchmarking Kubernetes Log Collectors: vlagent, Vector, Fluent Bit, OpenTelemetry Collector, and more VictoriaMetrics February 2026 Ecosystem Updates VictoriaMetrics at FOSDEM, Cloud Native Days France, and CfgMgmtCamp Ghent VictoriaLogs in VictoriaMetrics Cloud: Fast, Cost-Effective Log Management is Here What’s new in VictoriaMetrics Anomaly Detection (2025) VictoriaMetrics January 2026 Ecosystem Updates VictoriaLogs Basics: What You Need to Know, with Examples & Visuals What's New in VictoriaMetrics Cloud Q4 2025? New tiers, more deployment options, IaC and alerting rules. Vibe coding tools observability with VictoriaMetrics Stack and OpenTelemetry How a US Software Provider Improved Traffic Alerting with VictoriaMetrics Anomaly Detection VictoriaMetrics 2025 Developer Experience: A Year in Review Spotify’s performance & control across large monitoring environments with VictoriaMetrics VictoriaMetrics Achieves Red Hat OpenShift Operator Certification Our latest updates across the VictoriaMetrics Observability ecosystem New Capacity Tiers in VictoriaMetrics Cloud Announcing 1B+ Downloads & Product Development With Logs, Traces, Metrics AI Agents Observability with OpenTelemetry and the VictoriaMetrics Stack Discarding gRPC-Go: The Story Behind OTLP/gRPC Support in VictoriaTraces What's New in VictoriaMetrics Cloud Q3 2025? From new region in Asia to proactive alerts How DreamHost Slashed Memory Usage by 80% and Scaled to 76 Million Time Series Upcoming Conferences & Meetups: Where to Meet Our Team VictoriaMetrics Long-Term Support (LTS): H2 2025 Update Creating a Sustainable Open Source Business Model - Introduction Full-Stack Observability with VictoriaMetrics in the OTel Demo Alerting Best Practices vmanomaly Deep Dive: Smarter Alerting with AI (Tech Talk Companion) VictoriaLogs Practical Ingestion Guide for Message, Time and Streams Monotonic and Wall Clock Time in the Go time package Hello Singapore! VictoriaMetrics Cloud Expands to Asia Pacific MCP Server Integration & Much More: What's New in VictoriaMetrics Cloud Q2 2025 FIPS 140-3 Compatible Builds for VictoriaMetrics Enterprise Components VictoriaLogs Unleashed: Cluster Version Now Available for Exceptional, Linear Scaling Integrations made easy with VictoriaMetrics Cloud Developer's Note: Research on Distributed Tracing, Comparing With Tempo and ClickHouse vmagent: Key Features Explained in Under 15 Minutes Go synctest: Solving Flaky Tests vmalert: Maximize Your Monitoring (Tech Talk Companion) Celebrating 14K Stars on GitHub: Spring Update vmalert: Maximize Your Monitoring VictoriaMetrics Connects with the Open Source Community at LinuxFest Northwest 2025 Graceful Shutdown in Go: Practical Patterns VictoriaLogs: Gaps, Gains & Growth Prometheus Monitoring: Functions, Subqueries, Operators, and Modifiers VictoriaMetrics Cloud: What's New in Q1 2025? Don’t default to microservices: You’ll thank us later! Container CPU Requests & Limits Explained with GOMAXPROCS Tuning gRPC in Go: Streaming RPCs, Interceptors, and Metadata From Chaos to Clarity with VictoriaLogs Prometheus Alerting 101: Rules, Recording Rules, and Alertmanager Heading to London: Meet Our Team at KubeCon Europe 2025 Inside vmselect: The Query Processing Engine of VictoriaMetrics Meet Our Team at Scale 22x Practical Protobuf - From Basic to Best Practices VictoriaLogs Status Update: Heading Towards the Cluster Version 24th of February 2025 Statement: VictoriaMetrics Stands with Ukraine! Prometheus Metrics Explained: Counters, Gauges, Histograms & Summaries Prometheus Monitoring: Instant Queries and Range Queries Explained 300%+ Growth in 2024: Join Our Team in 2025! FOSDEM 2025 recap How Protobuf Works—The Art of Data Encoding OpenTelemetry, Prometheus, and More: Which Is Better for Metrics Collection and Propagation? How vmstorage Handles Query Requests From vmselect How vmstorage's IndexDB Works VictoriaMetrics Tech Talk Stream: A Deep Dive into Blackbox Monitoring How HTTP/2 Works and How to Enable It in Go VictoriaMetrics Cloud: What's New in Q4 2024? How vmstorage Processes Data: Retention, Merging, Deduplication,... How vmstorage Handles Data Ingestion From vminsert When Metrics Meet vminsert: A Data-Delivery Story From net/rpc to gRPC in Go Applications Piros | VictoriaMetrics Partner Allenta | VictoriaMetrics Partner CloudRaft | VictoriaMetrics Partner Sensedia & VictoriaMetrics: API-compatible Efficient Storage Scalable Prometheus: Why DSV Chose VictoriaMetrics Sensor Factory | VictoriaMetrics Partner Erythix | VictoriaMetrics Partner Groove X & VictoriaMetrics: Faster Device Health Monitoring Scaled & Performant Monitoring at Spotify with VictoriaMetrics Grammarly & VictoriaMetrics: 10× Lower Costs & Direct Access Zelarsoft | VictoriaMetrics Partner DFKI & VictoriaMetrics: Efficient Long-Term Metric Storage Niubits | VictoriaMetrics Partner Megazone Cloud | VictoriaMetrics Partner Cogito Software | VictoriaMetrics Partner Bajau | VictoriaMetrics Partner Find Out Why Dig Security Chose VictoriaMetrics! Ness | VictoriaMetrics Partner Alpha Data | VictoriaMetrics Partner SIOS Technology | VictoriaMetrics Partner
Never-firing alerts: What they are and how to deal with them
Roman Khavronenko · 2023-05-19 · via VictoriaMetrics: Simple & Reliable Monitoring for Everyone on VictoriaMetrics

Alerting is one of the main reasons for having a monitoring system. It is always better to be notified about an issue before an unhappy user or customer gets to you. For this, engineers build systems that would check for certain conditions all the time, day and night. And when the system detects an anomaly - it raises an alert.

Monitoring could break, so engineers make it reliable.

Monitoring could get overwhelmed, so engineers make it scalable.

But what if monitoring was just poorly instructed? What if it was checking for a wrong condition? This is what’s referred to as ’never-firing alerts’ in the monitoring world. This blog post looks at what these are, what they mean, and how to deal with them.


Alerting rules

#

VictoriaMetrics’ approach to alerting is very similar to the Prometheus one. Except that the ruler isn’t built-in in the database, but is a separate service - vmalert:
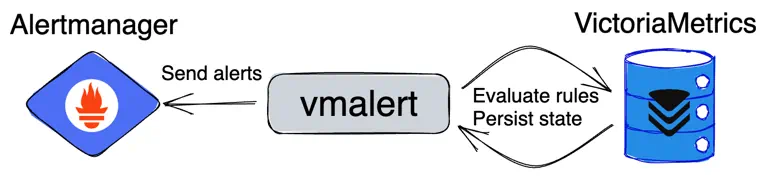
vmalert as an external Ruler for VictoriaMetrics vmalert as an external Ruler for VictoriaMetrics

vmalert accepts rules configuration in the same format as Prometheus does. For example, a simple alerting rule definition looks like the following:

  - alert: TooManyErrors
    expr: increase(http_errors_total[5m]) > 0

The logic of rules evaluation is very simple:

  1. If expression from field expr returns no results, then alerting condition isn’t met and no alerts will be fired;
  2. If expression from field expr returns results, then fire an alert for each returned time series.

For example:

  • expr: http_errors_total will fire an alert if database at least contains http_errors_total metric.
  • expr: increase(http_errors_total[5m]) > 0 will fire if this metric was recently increased.
  • expr: increase(http_errors_total[5m]) > 10 will fire only if metric http_errors_total increased by at least 10.

vmalert doesn’t understand the difference between http_errors_total and increase(http_errors_total[5m]) > 0. These are just expressions it needs to evaluate via query API and check if they return a response. That’s it.

The response from the query API has the following format:

{
  "status": "success",
  "data": {
    "result": [
      {
        "metric": {<labels>},
        "value": [<timestamp>, "<value>"]
      },
      ...
    ]
  }
}

If we update our expression with a condition that we unlikely meet, like expr: increase(http_errors_total[5m]) > 10000, then we’ll get an empty response:

{
  "status": "success",
  "data": {
    "result": []
  }
}

Getting an empty response for vmalert (as well as for Prometheus) means the condition wasn’t met. Hence, no need to fire any alerts. But the problem is that there is no way to distinguish whether we got an empty response because some threshold wasn’t reached. Or is it just that http_errors_total metric doesn’t exist because we don’t scrape it. Or we just made a typo in the metric name.

This type of error is very subtle and dangerous. Users may think they receive no alerts because everything is Ok. When, in fact, the alerting rule just contains a typo and will never ever fire.

How to validate alerting rules for typos?

#

Prometheus or vmalert can check the syntax for correctness, but they can’t catch a typo in the metric name. Users can manually verify if the query is correct and contains no typos. But this is a one-time event. What if a specific metric ceased to exist in a newer version of the application - how to verify that?

Lukasz Mierzwa from Cloudflare published a very detailed blog post elaborating more on this problem. I really enjoyed reading it! Lukasz suggests using pint - an opensource tool developed by Cloudflare to do an additional validation for rules. For example, pint can understand increase(http_errors_total[5m]) > 10000 expression and do an extra check by evaluating just increase(http_errors_total[5m]) to see if it returns at least something.

And that’s a good solution, I recommend taking a look at pint if you’re going serious about alerting rules. But pint is an extra tool you need to install and integrate into CI/CD pipeline to get this extra validation. Could it be simpler?

Alerts that never fire

#

Starting from v1.90, VictoriaMetrics returns an extra object in response to read queries:

"stats": {"seriesFetched": "42"}

The stats object contains a field seriesFetched with a number of time series read from the storage before the comparison operator was applied. So if you get seriesFetched: 0 it effectively means that expression doesn’t match a single time series. If it is > 0 but you still get an empty response - then matched time series were filtered out by the comparison operator.

vmalert can read and understand this new field in VictoriaMetrics response starting from v1.91. Based on that, it exposes a new metric vmalert_alerting_rules_last_evaluation_series_fetched showing how many time series were fetched during the last evaluation. The following expression would return you alerting rules which are likely to contain a typo or wrong time series selector:

max(vmalert_alerting_rules_last_evaluation_series_fetched) by(group, alertname) ==0

Alerting rules that do not match any series during evaluation will be highlighted in vmalert web UI:
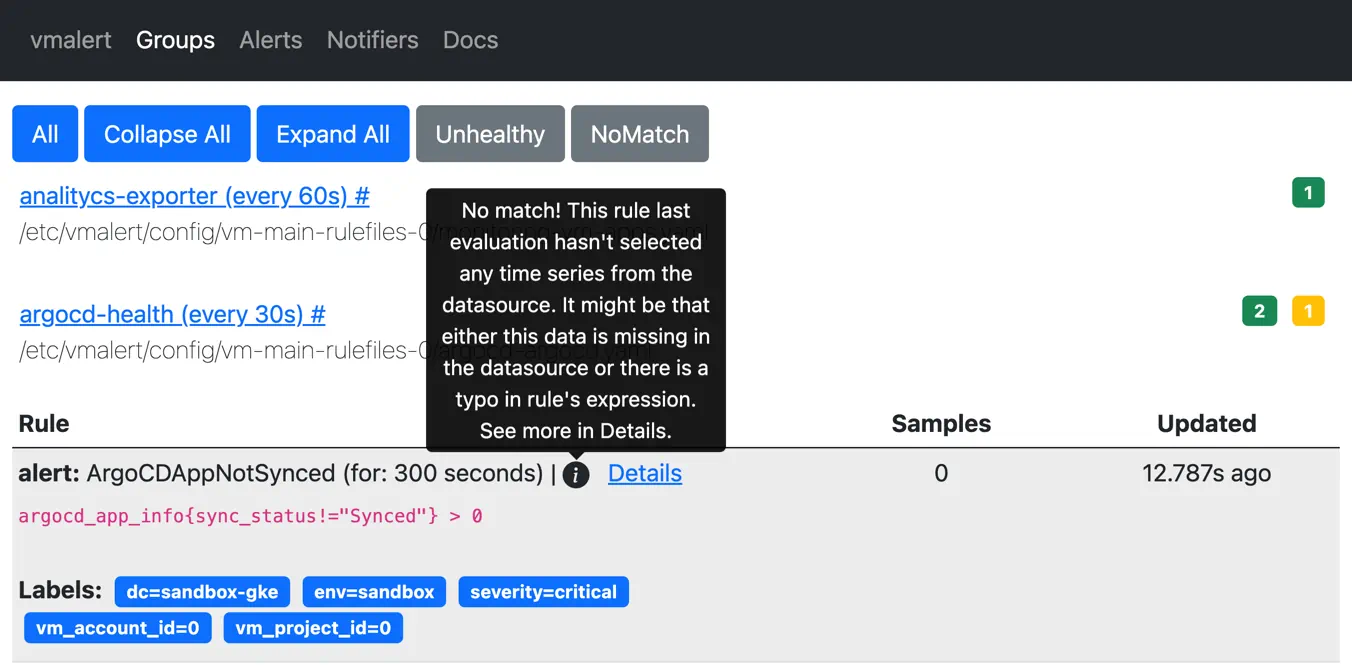
vmalert displays alerting rule matching no time series vmalert displays alerting rule matching no time series

Recording rules

#

Not-working recording rules are much easier to find compared to alerting rules. Simply because it is expected for the recording rule to always produce data samples, without conditions. To find recording rules which produce no data, run the following query:

sum(vmalert_recording_rules_last_evaluation_samples) by(group, recording) < 1

You can find this and many other useful alerting rules here.

False positives

#

Detecting never-firing alerts helped us to identify poorly configured alerting rules for internal infrastructure. However, we also had a few false positives. For example, we’re using ArgoCD for CI/CD purposes, and we use some recommended alerting rules like the following:

- alert: ArgoCDAppNotSynced
  expr: argocd_app_info{sync_status!="Synced"} > 0

This alerting rule will be highlighted by vmalert as never-firing because changing sync_status label for argocd_app_info metric means that metric with the previous status will be deleted. This results into short-living time series and is recognized as anti-pattern in monitoring. Because of this, the mentioned alerting rule will match no series until the sync_status stops being Synced.

Conclusion

#

Never-firing alerts is a real thing in modern monitoring. It is very easy to make a mistake while copy&pasting alerting rules. Or deploy a new version of the software with breaking changes in metric names. Such subtle errors don’t reveal themselves until it is too late. We hope that vmalert will help users to identify such problems quicker. Try it in new v1.91!