惯性聚合 高效追踪和阅读你感兴趣的博客、新闻、科技资讯
阅读原文 在惯性聚合中打开

推荐订阅源

Security Archives - TechRepublic
爱范儿
爱范儿
Recent Announcements
AI
AI
V
Visual Studio Blog
H
Heimdal Security Blog
L
LINUX DO - 最新话题
Attack and Defense Labs
宝玉的分享
宝玉的分享
cs.AI updates on arXiv.org
W
WeLiveSecurity
人人都是产品经理
人人都是产品经理
Exploit-DB.com RSS Feed
WordPress大学
WordPress大学
S
Secure Thoughts
S
Security Affairs
Threat Intelligence Blog | Flashpoint
N
News and Events Feed by Topic
让小产品的独立变现更简单 - ezindie.com
博客园 - 聂微东
博客园 - Franky
阮一峰的网络日志
阮一峰的网络日志
Schneier on Security
Hugging Face - Blog
Hugging Face - Blog
Apple Machine Learning Research
Forbes - Security
Forbes - Security
The Cloudflare Blog
博客园 - 【当耐特】
酷 壳 – CoolShell
酷 壳 – CoolShell
OSCHINA 社区最新新闻
OSCHINA 社区最新新闻
月光博客
月光博客
有赞技术团队
有赞技术团队
博客园 - 司徒正美
博客园_首页
Recent Commits to openclaw:main
钛媒体:引领未来商业与生活新知
钛媒体:引领未来商业与生活新知
K
KPMG report finds enterprise disconnect between AI and its ROI | CIO
NISL@THU
NISL@THU
C
Cybersecurity and Infrastructure Security Agency CISA
奇客Solidot–传递最新科技情报
奇客Solidot–传递最新科技情报
P
Proofpoint News Feed
罗磊的独立博客
V
Vulnerabilities – Threatpost
S
Securelist
N
News and Events Feed by Topic
Cloudbric
Cloudbric
P
Proofpoint News Feed
CTFtime.org: upcoming CTF events
V2EX - 技术
V2EX - 技术
小众软件
小众软件

VictoriaMetrics: Simple & Reliable Monitoring for Everyone on VictoriaMetrics

Operator now has Long-Term Support (LTS) version Multi-tiered Observability: A Practical Way to Handle Diverse Workloads VictoriaMetrics April 2026 Ecosystem Updates Not All Telemetry Requires Premium Pricing VictoriaMetrics at KubeCon Amsterdam: Community Highlights What's new in VictoriaMetrics Anomaly Detection (Q1 2026) What's New in VictoriaMetrics Cloud Q1 2026? Logs, MCP Server, Better Alerting, and... a Secret Project VictoriaMetrics at KubeCon: Optimizing Tail Sampling in OpenTelemetry with Retroactive Sampling VictoriaMetrics March 2026 Ecosystem Updates Observability Lessons From OpenAI Benchmarking Kubernetes Log Collectors: vlagent, Vector, Fluent Bit, OpenTelemetry Collector, and more VictoriaMetrics February 2026 Ecosystem Updates VictoriaMetrics at FOSDEM, Cloud Native Days France, and CfgMgmtCamp Ghent VictoriaLogs in VictoriaMetrics Cloud: Fast, Cost-Effective Log Management is Here What’s new in VictoriaMetrics Anomaly Detection (2025) VictoriaMetrics January 2026 Ecosystem Updates VictoriaLogs Basics: What You Need to Know, with Examples & Visuals What's New in VictoriaMetrics Cloud Q4 2025? New tiers, more deployment options, IaC and alerting rules. Vibe coding tools observability with VictoriaMetrics Stack and OpenTelemetry How a US Software Provider Improved Traffic Alerting with VictoriaMetrics Anomaly Detection VictoriaMetrics 2025 Developer Experience: A Year in Review Spotify’s performance & control across large monitoring environments with VictoriaMetrics VictoriaMetrics Achieves Red Hat OpenShift Operator Certification Our latest updates across the VictoriaMetrics Observability ecosystem New Capacity Tiers in VictoriaMetrics Cloud Announcing 1B+ Downloads & Product Development With Logs, Traces, Metrics AI Agents Observability with OpenTelemetry and the VictoriaMetrics Stack Discarding gRPC-Go: The Story Behind OTLP/gRPC Support in VictoriaTraces What's New in VictoriaMetrics Cloud Q3 2025? From new region in Asia to proactive alerts How DreamHost Slashed Memory Usage by 80% and Scaled to 76 Million Time Series Upcoming Conferences & Meetups: Where to Meet Our Team VictoriaMetrics Long-Term Support (LTS): H2 2025 Update Creating a Sustainable Open Source Business Model - Introduction Full-Stack Observability with VictoriaMetrics in the OTel Demo Alerting Best Practices vmanomaly Deep Dive: Smarter Alerting with AI (Tech Talk Companion) VictoriaLogs Practical Ingestion Guide for Message, Time and Streams Monotonic and Wall Clock Time in the Go time package Hello Singapore! VictoriaMetrics Cloud Expands to Asia Pacific MCP Server Integration & Much More: What's New in VictoriaMetrics Cloud Q2 2025 FIPS 140-3 Compatible Builds for VictoriaMetrics Enterprise Components VictoriaLogs Unleashed: Cluster Version Now Available for Exceptional, Linear Scaling Integrations made easy with VictoriaMetrics Cloud Developer's Note: Research on Distributed Tracing, Comparing With Tempo and ClickHouse vmagent: Key Features Explained in Under 15 Minutes Go synctest: Solving Flaky Tests vmalert: Maximize Your Monitoring (Tech Talk Companion) Celebrating 14K Stars on GitHub: Spring Update vmalert: Maximize Your Monitoring VictoriaMetrics Connects with the Open Source Community at LinuxFest Northwest 2025 Graceful Shutdown in Go: Practical Patterns VictoriaLogs: Gaps, Gains & Growth Prometheus Monitoring: Functions, Subqueries, Operators, and Modifiers VictoriaMetrics Cloud: What's New in Q1 2025? Don’t default to microservices: You’ll thank us later! Container CPU Requests & Limits Explained with GOMAXPROCS Tuning gRPC in Go: Streaming RPCs, Interceptors, and Metadata From Chaos to Clarity with VictoriaLogs Prometheus Alerting 101: Rules, Recording Rules, and Alertmanager Heading to London: Meet Our Team at KubeCon Europe 2025 Inside vmselect: The Query Processing Engine of VictoriaMetrics Meet Our Team at Scale 22x Practical Protobuf - From Basic to Best Practices VictoriaLogs Status Update: Heading Towards the Cluster Version 24th of February 2025 Statement: VictoriaMetrics Stands with Ukraine! Prometheus Metrics Explained: Counters, Gauges, Histograms & Summaries Prometheus Monitoring: Instant Queries and Range Queries Explained 300%+ Growth in 2024: Join Our Team in 2025! FOSDEM 2025 recap How Protobuf Works—The Art of Data Encoding OpenTelemetry, Prometheus, and More: Which Is Better for Metrics Collection and Propagation? How vmstorage Handles Query Requests From vmselect How vmstorage's IndexDB Works VictoriaMetrics Tech Talk Stream: A Deep Dive into Blackbox Monitoring How HTTP/2 Works and How to Enable It in Go VictoriaMetrics Cloud: What's New in Q4 2024? How vmstorage Processes Data: Retention, Merging, Deduplication,... How vmstorage Handles Data Ingestion From vminsert When Metrics Meet vminsert: A Data-Delivery Story From net/rpc to gRPC in Go Applications Piros | VictoriaMetrics Partner Allenta | VictoriaMetrics Partner CloudRaft | VictoriaMetrics Partner Sensedia & VictoriaMetrics: API-compatible Efficient Storage Scalable Prometheus: Why DSV Chose VictoriaMetrics Sensor Factory | VictoriaMetrics Partner Erythix | VictoriaMetrics Partner Groove X & VictoriaMetrics: Faster Device Health Monitoring Scaled & Performant Monitoring at Spotify with VictoriaMetrics Grammarly & VictoriaMetrics: 10× Lower Costs & Direct Access Zelarsoft | VictoriaMetrics Partner DFKI & VictoriaMetrics: Efficient Long-Term Metric Storage Niubits | VictoriaMetrics Partner Megazone Cloud | VictoriaMetrics Partner Cogito Software | VictoriaMetrics Partner Bajau | VictoriaMetrics Partner Find Out Why Dig Security Chose VictoriaMetrics! Ness | VictoriaMetrics Partner Alpha Data | VictoriaMetrics Partner SIOS Technology | VictoriaMetrics Partner
Cardinality explorer
Dmytro Kozlov · 2022-10-04 · via VictoriaMetrics: Simple & Reliable Monitoring for Everyone on VictoriaMetrics

In monitoring, the term cardinality defines the number of unique time series stored in a time series database (TSDB). The higher the cardinality, the more resources are usually required for metrics processing and querying. For example VictoriaMetrics single version needs 850MB RAM for 1 million unique time series and 4GB for 10 million series, but InfluxDB RAM needs 5GB for 1 million unique time series and reaches 9GB for 4 million unique time series, Prometheus starts from 6.5GB and stabilizes at 14GB, respectively. Besides memory, cardinality affects CPU usage, latency of executing queries, and data compression on disk, which may significantly increase the cost of running a TSDB or a monitoring solution.

Time series and metrics

#

TSDBs like VictoriaMetrics or Prometheus share very similar data models. It consists of metrics, time series, and samples. A metric is a numeric measure or observation of something. For example, we can measure how many requests users make via the metric http_request_total. We use labels to add some additional information, like which instance handles this request or which path was requested. A combination of a metric name and its labels defines a time series:

http_request_total{instance=’1’, path=’/read’}
http_request_total{instance=’1’, path=’/write’}

The example above contains two unique time series of the same metric. The number of time series defines the cardinality of the data set.

See more information about VictoriaMetrics data model in Key Concepts.

High cardinality

#

The term high cardinality is used to define some number of unique time series, which may become concerning for TSDB’s performance. Different TSDBs have different ways of dealing with it, but it is still very important to keep cardinality under control. For example, our metric http_request_total has the cardinality=2 so far. But if we decide to collect it from many instances, let’s say 3, cardinality jumps to 6 = 2 unique path labels * 3 unique instance labels. If we wanted to have metric per client, we’d add a client_id label to it. And if we have a 1000 of clients, cardinality elevates to 6000 = 2 path * 3 instances * 1000 clients. Adding a new path label adds another 3000 cardinality:
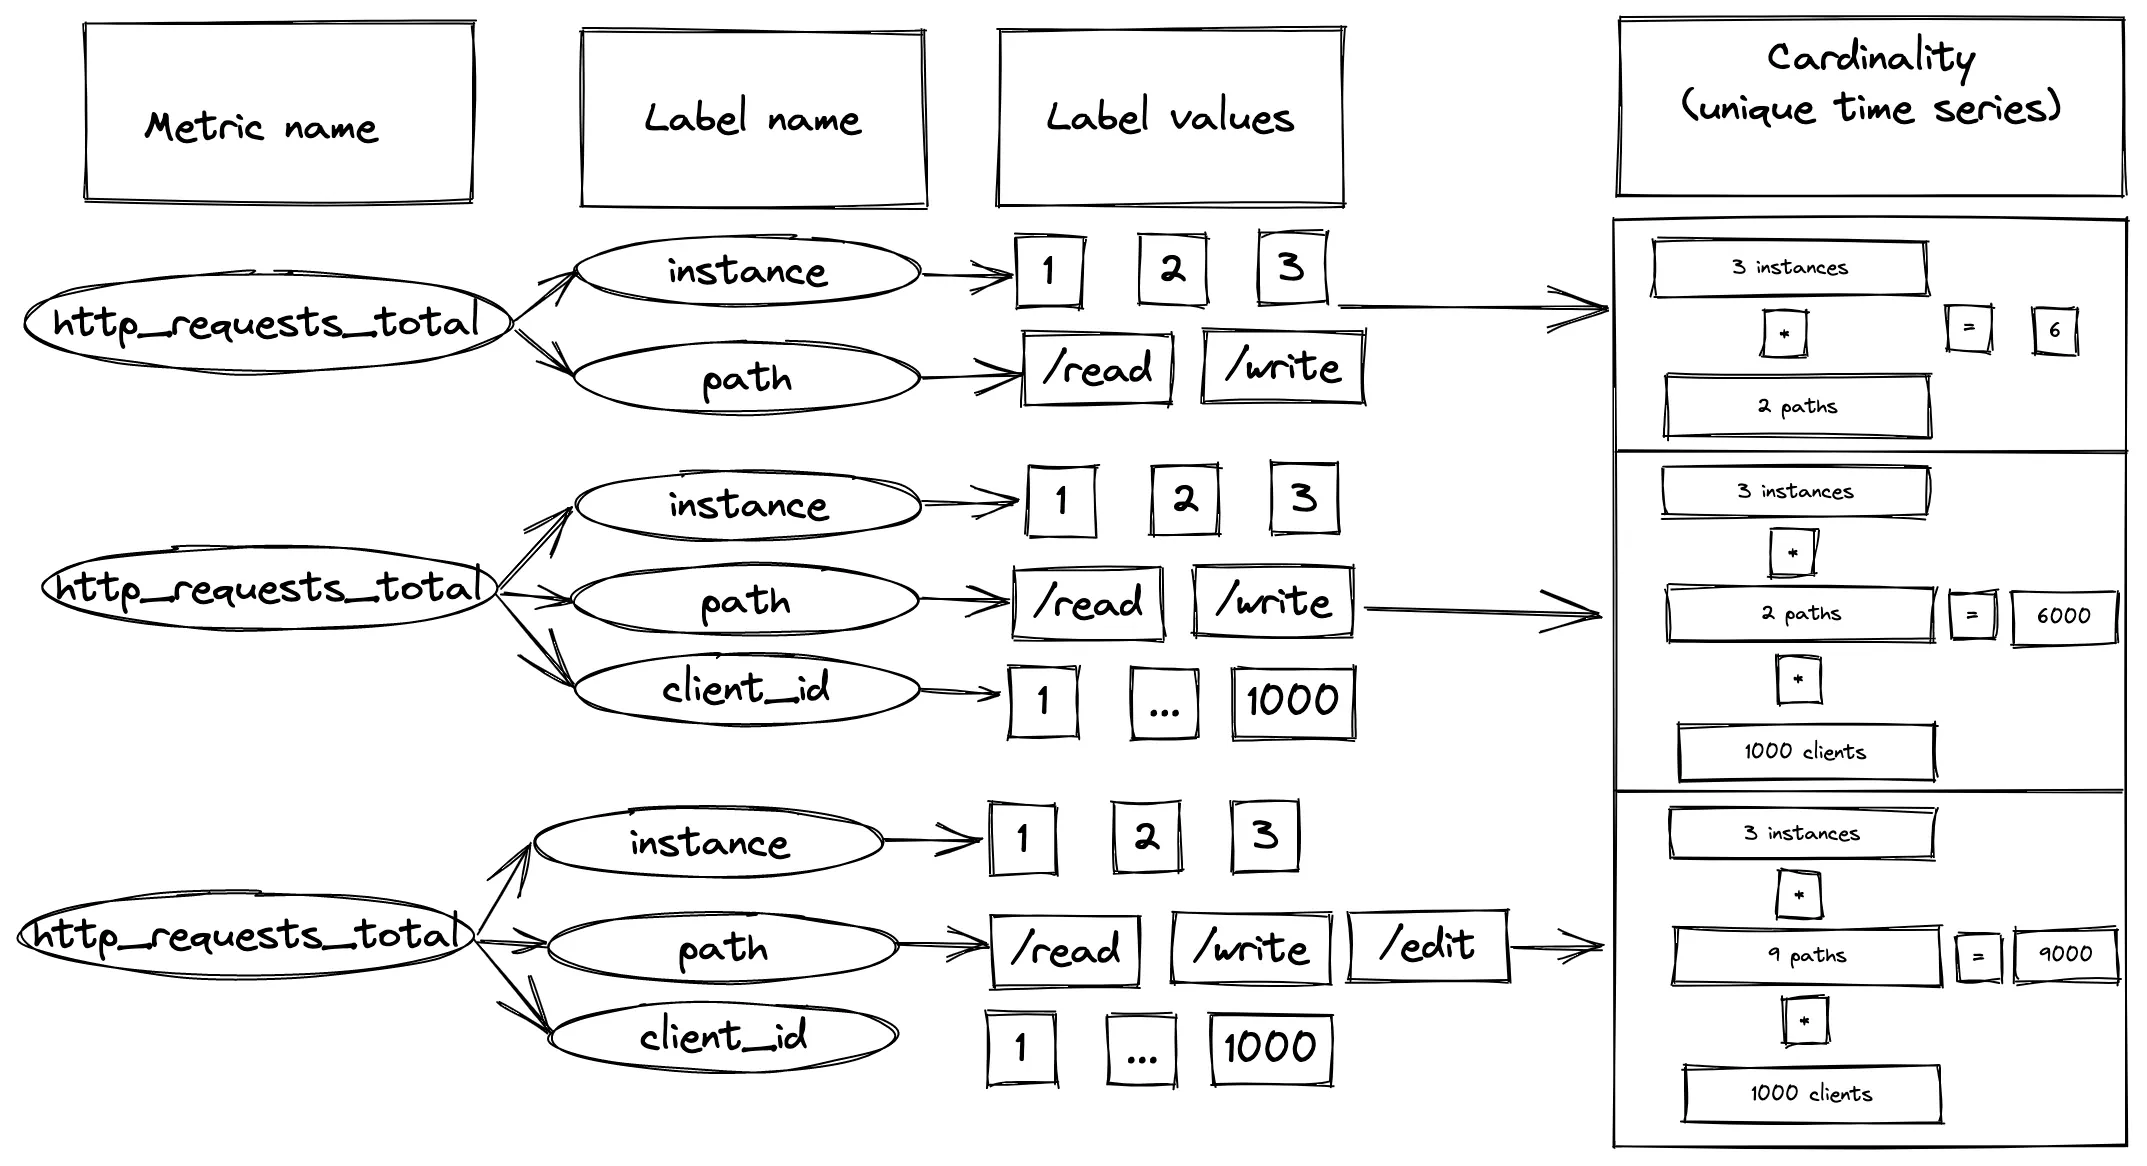
How metric labels contribute into the total cardinality How metric labels contribute into the total cardinality

This is where people start to talk about keeping cardinality under control, because adding one simple label can multiply the cardinality level. When we have many label value combination pairs our cardinality grows very quickly. This situation is especially concerning when you have monitoring solution as a service for different engineering teams. Each team can ingest arbitrary metrics into it, and a simple mistake in choosing the wrong label can significantly impact the monitoring platform. This is why it is essentially to have control over cardinality.

How can you explore cardinality in VictoriaMetrics?

#

VictoriaMetrics provides a special tool called cardinality explorer. Cardinality explorer is built on top of the /api/v1/status/tsdb API. Try it on our playground!

In the blogpost, I’m going to analyze our “Sandbox” environment, monitored by VictoriaMetrics cluster. Sandbox runs in Kubernetes cluster and contains various internal services, k8s exporters, node exporter, etc.
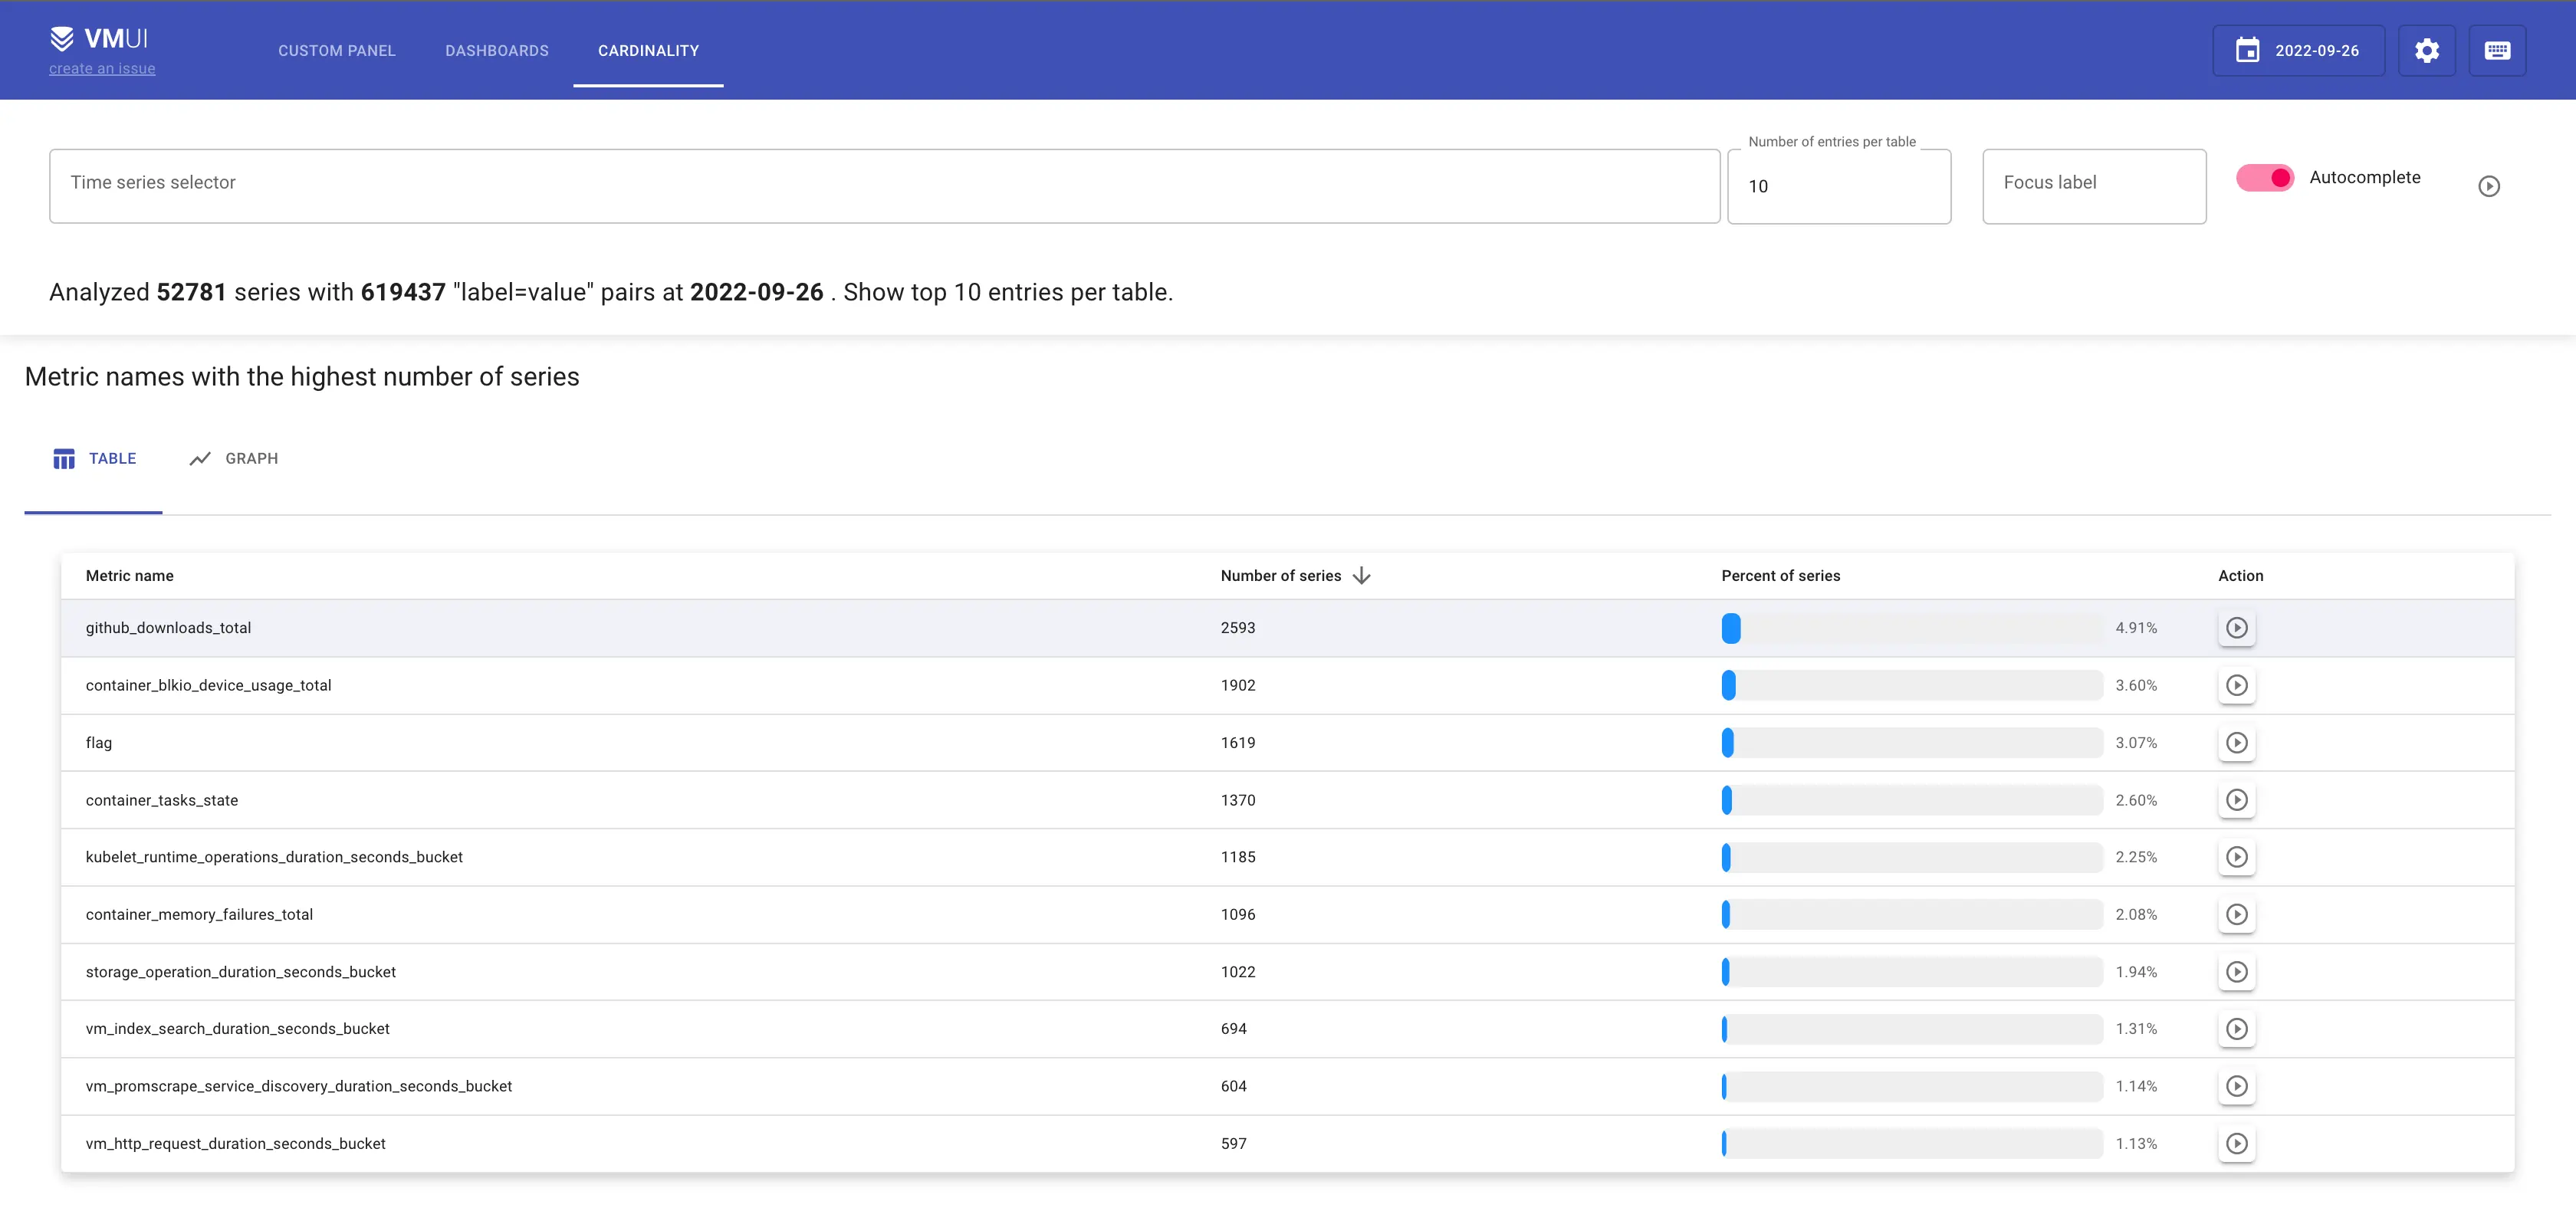
Cardinality explorer view for internal Sandbox cluster in VictoriaMetrics Cardinality explorer view for internal Sandbox cluster in VictoriaMetrics

According to the cardinality explorer screenshot, the top 3 metrics by number of series are:

  • github_downloads_total with 2593 unique series;
  • container_blkio_device_usage_total with 1902 unique series;
  • container_tasks_state with 1370 unique series.

Let’s start the analysis from the metric with the highest cardinality github_downloads_total by clicking on the icon in Action column:

Labels with the highest number of series for `github_downloads_total` metric Labels with the highest number of series for `github_downloads_total` metric

As in any profiling, always look for outliers. In the screenshot above, all labels are present in the same amount of series, which means the number of labels per series never changes. But let’s check the next section “Labels with the highest number of unique values”.
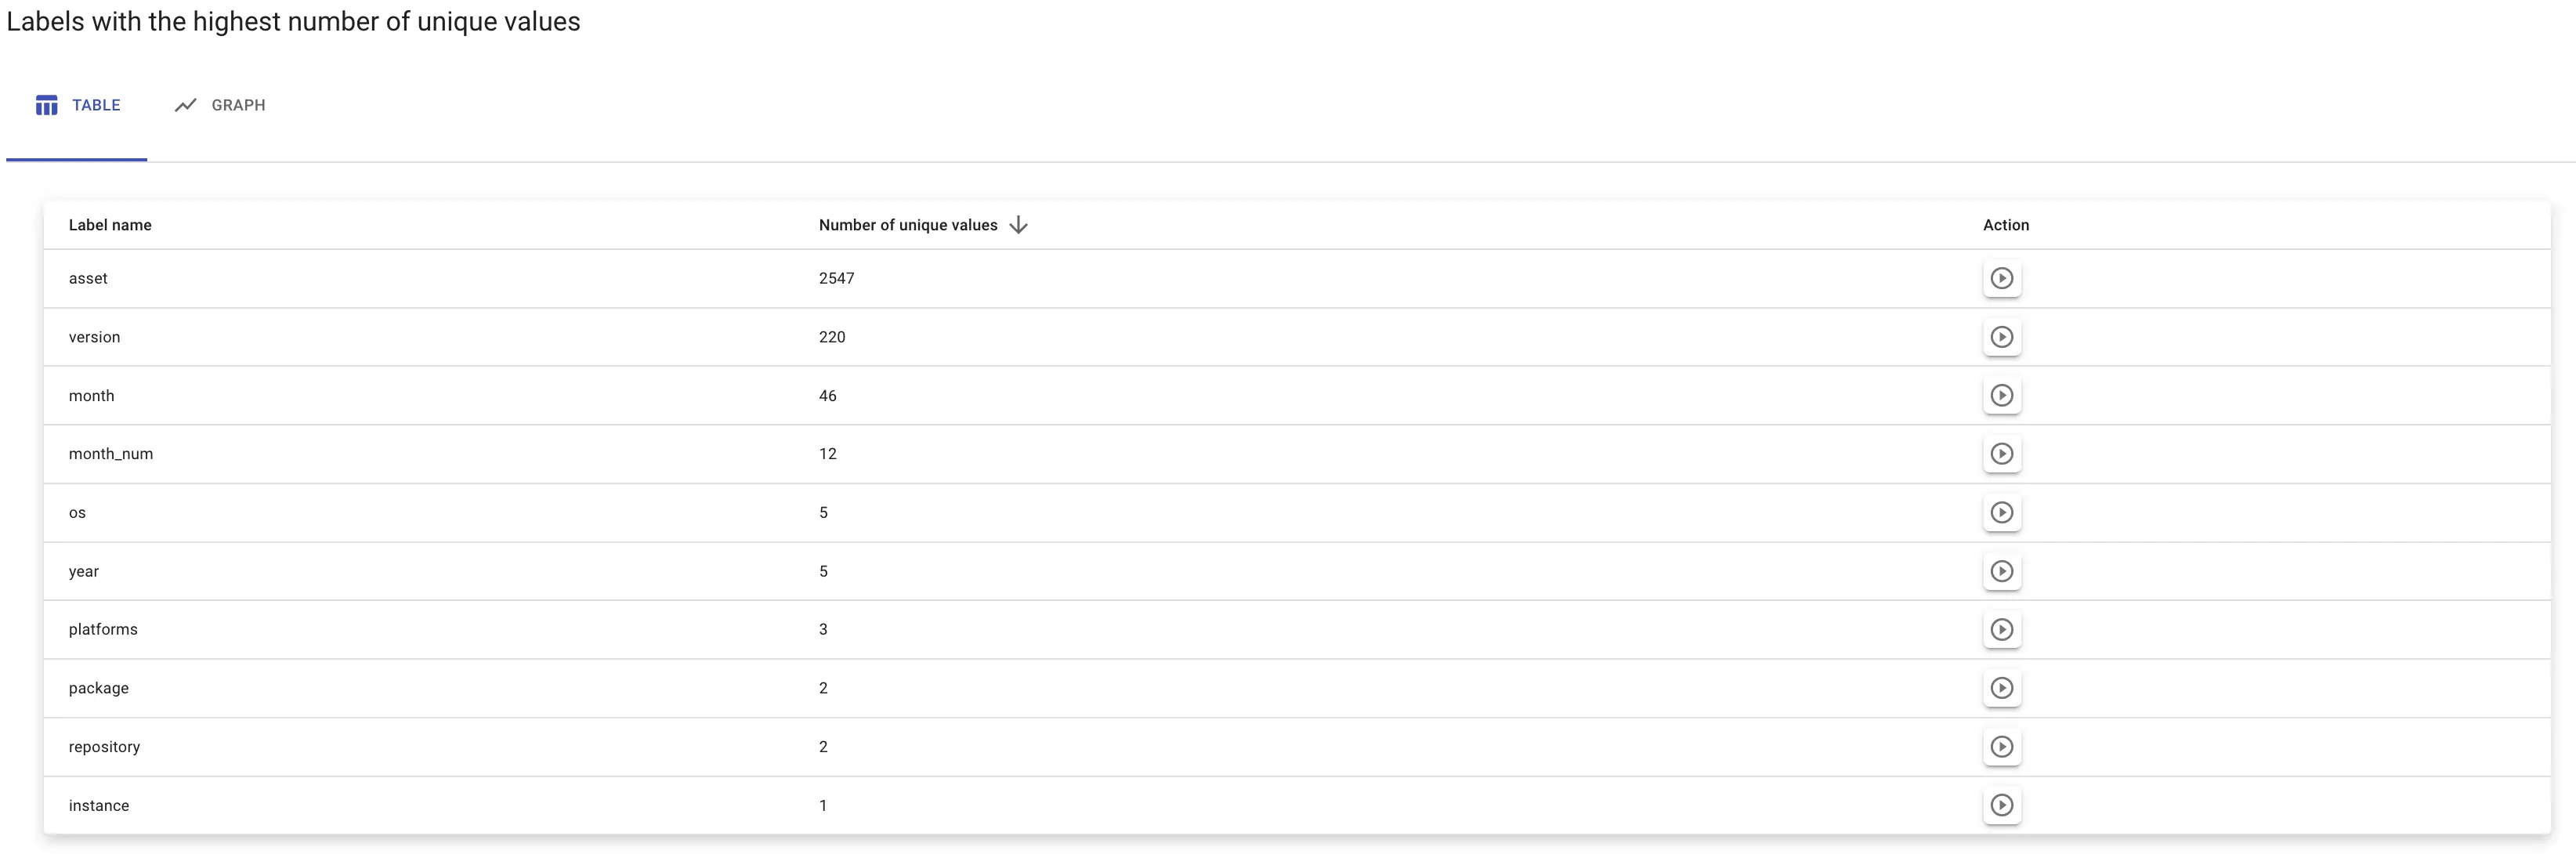
Highest numbers of unique values Highest numbers of unique values

Most unique values belong to the label asset. Let’s see what they are by clicking on the icon in Action column:
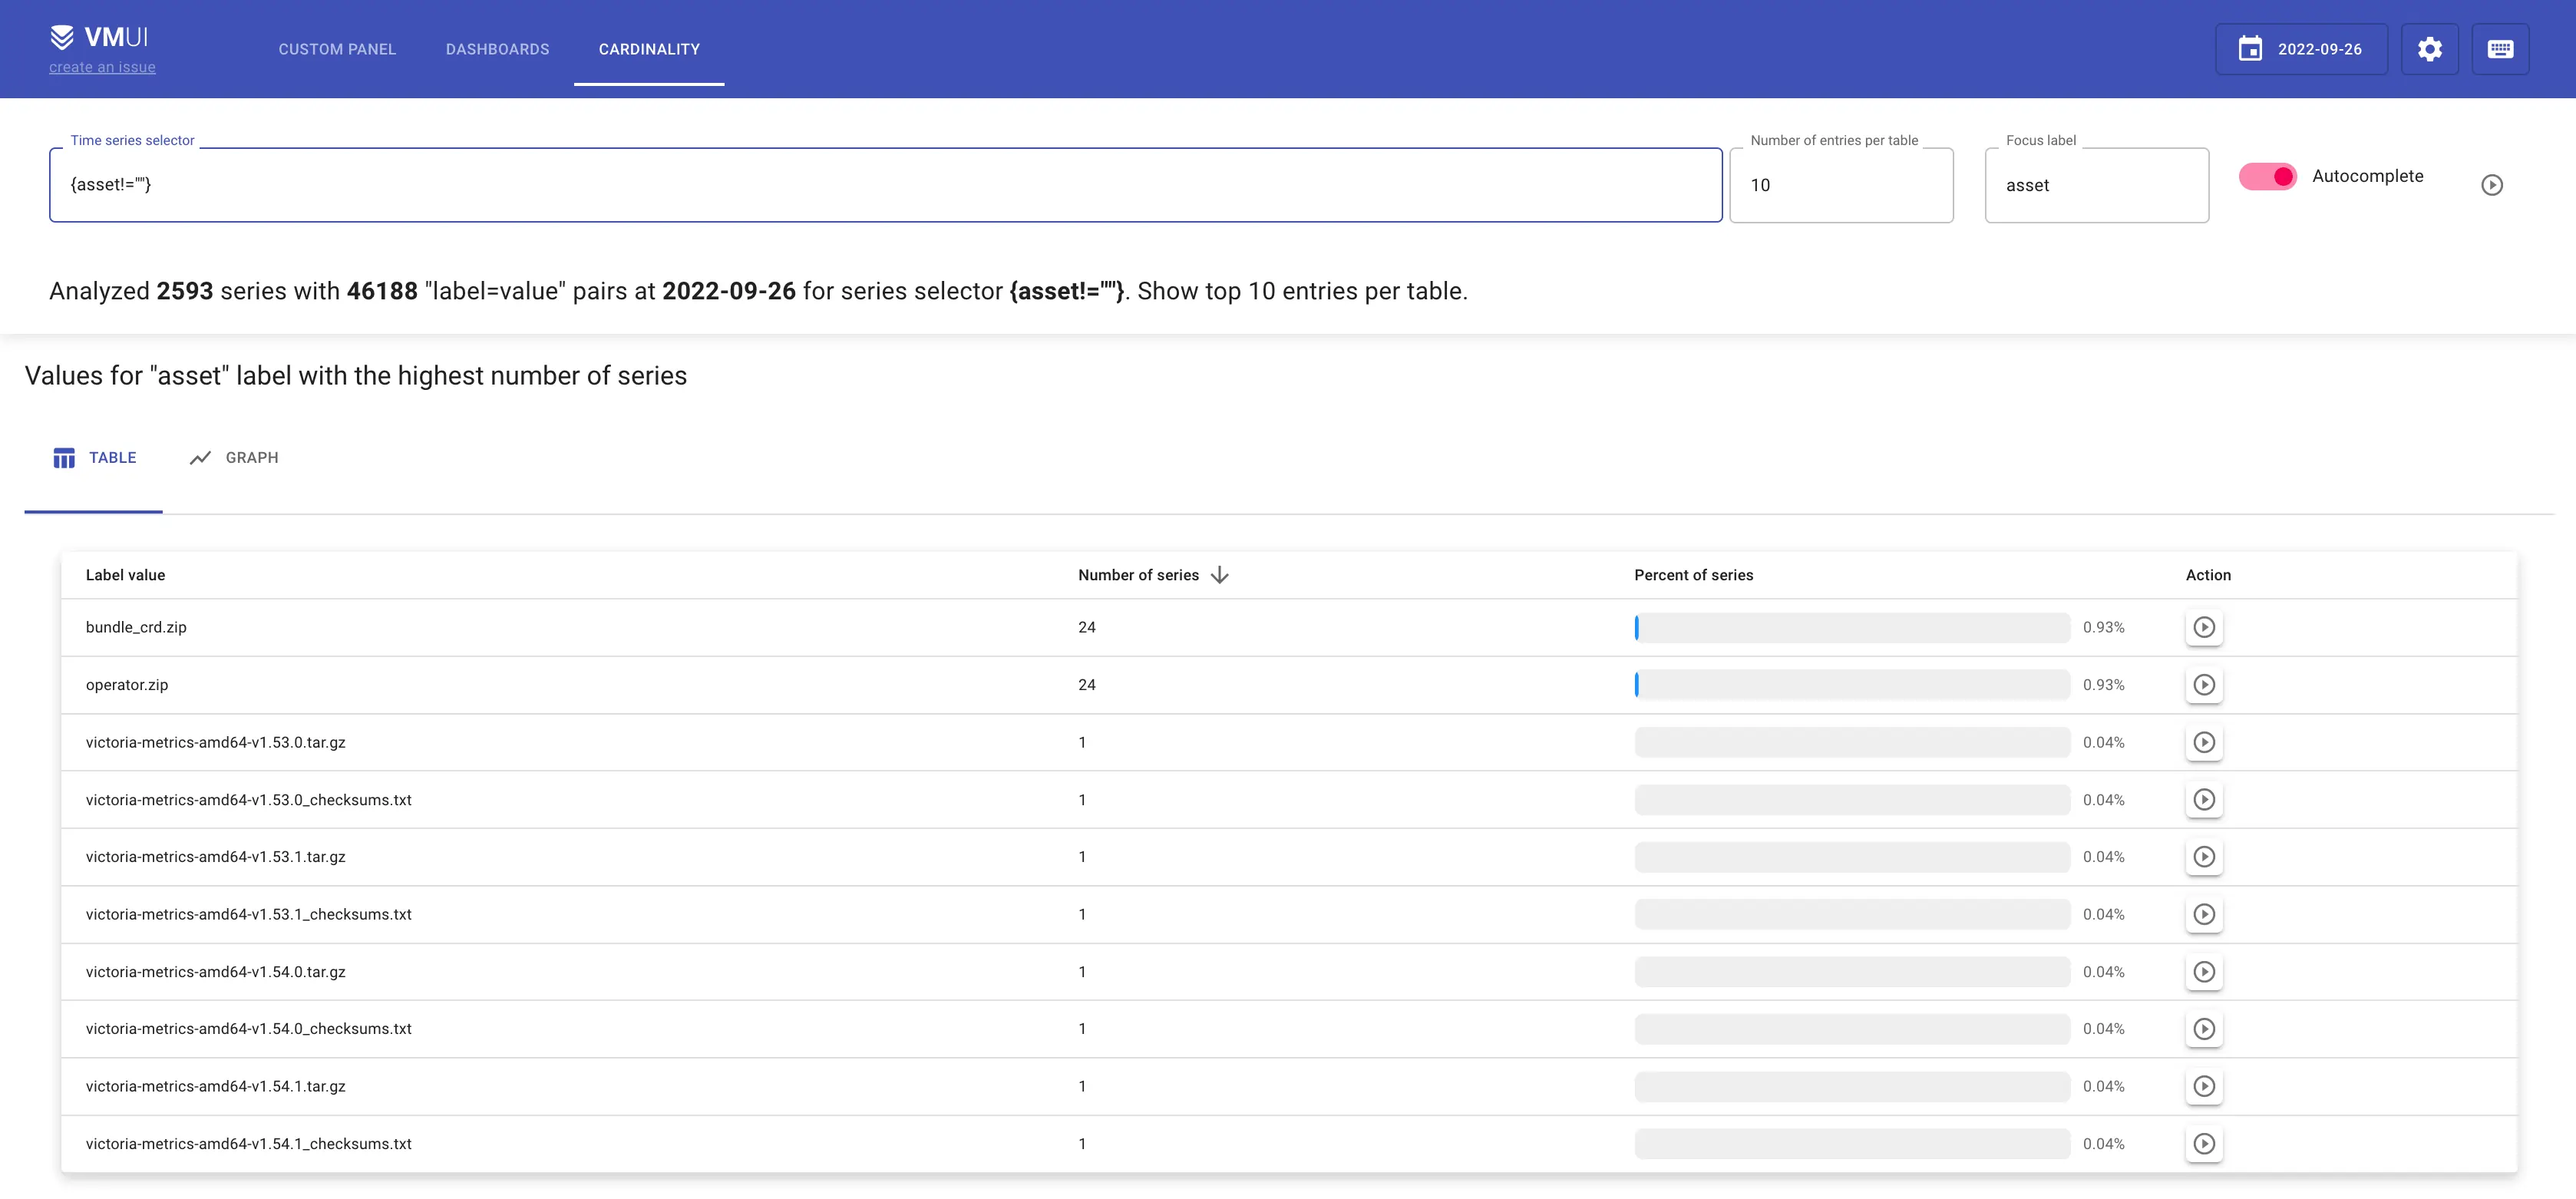
Values for `asset` label with the highest number of series Values for `asset` label with the highest number of series

The screenshot above shows the values for asset label with the highest number of series. The lower is the number of series, the more unique this value is. So if you’re looking to reduce the cardinality of the metric, look for the lowest values.

Label asset belongs to our github stats collector. It fetches information about github downloads, so we can know which release or which platform is the most popular. Turns out, among asset values there are checksum assets like (victoria-metrics-darwin-amd64-v1.81.2-enterprise_checksums.txt). Checksum assets are important for users, but not for our internal stats and metrics. We don’t use them in our Grafana dashboards or in other statistic reports. Let’s filter those assets via regexp {assets~=”.*.txt”}:

Values for `asset` label Values for `asset` label

It looks like checksum assets are producing about 1207 series, which is roughly 50% of all time series in github_downloads_total metric. And removing these series is the right thing to do since we have no use for them.

The other metrics from our top-3 list aren’t used as well, so I decided to remove them by updating our relabeling config:

metricRelabelConfigs:
  - source_labels: [ asset ]
    regex: ".*.txt"
    action: drop
  - sourceLabels:
    - __name__
    regex: container_(blkio_device_usage_total|tasks_state)
    action: drop
  - sourceLabels:
    - __name__
    regex: kubelet_runtime_operations_duration_seconds_bucket
    action: drop

We have applied our new relabel config at 18:00. The way it impacts our data you will see on the graph. So what we got:

  1. Decrease of datapoints ingestion rate:
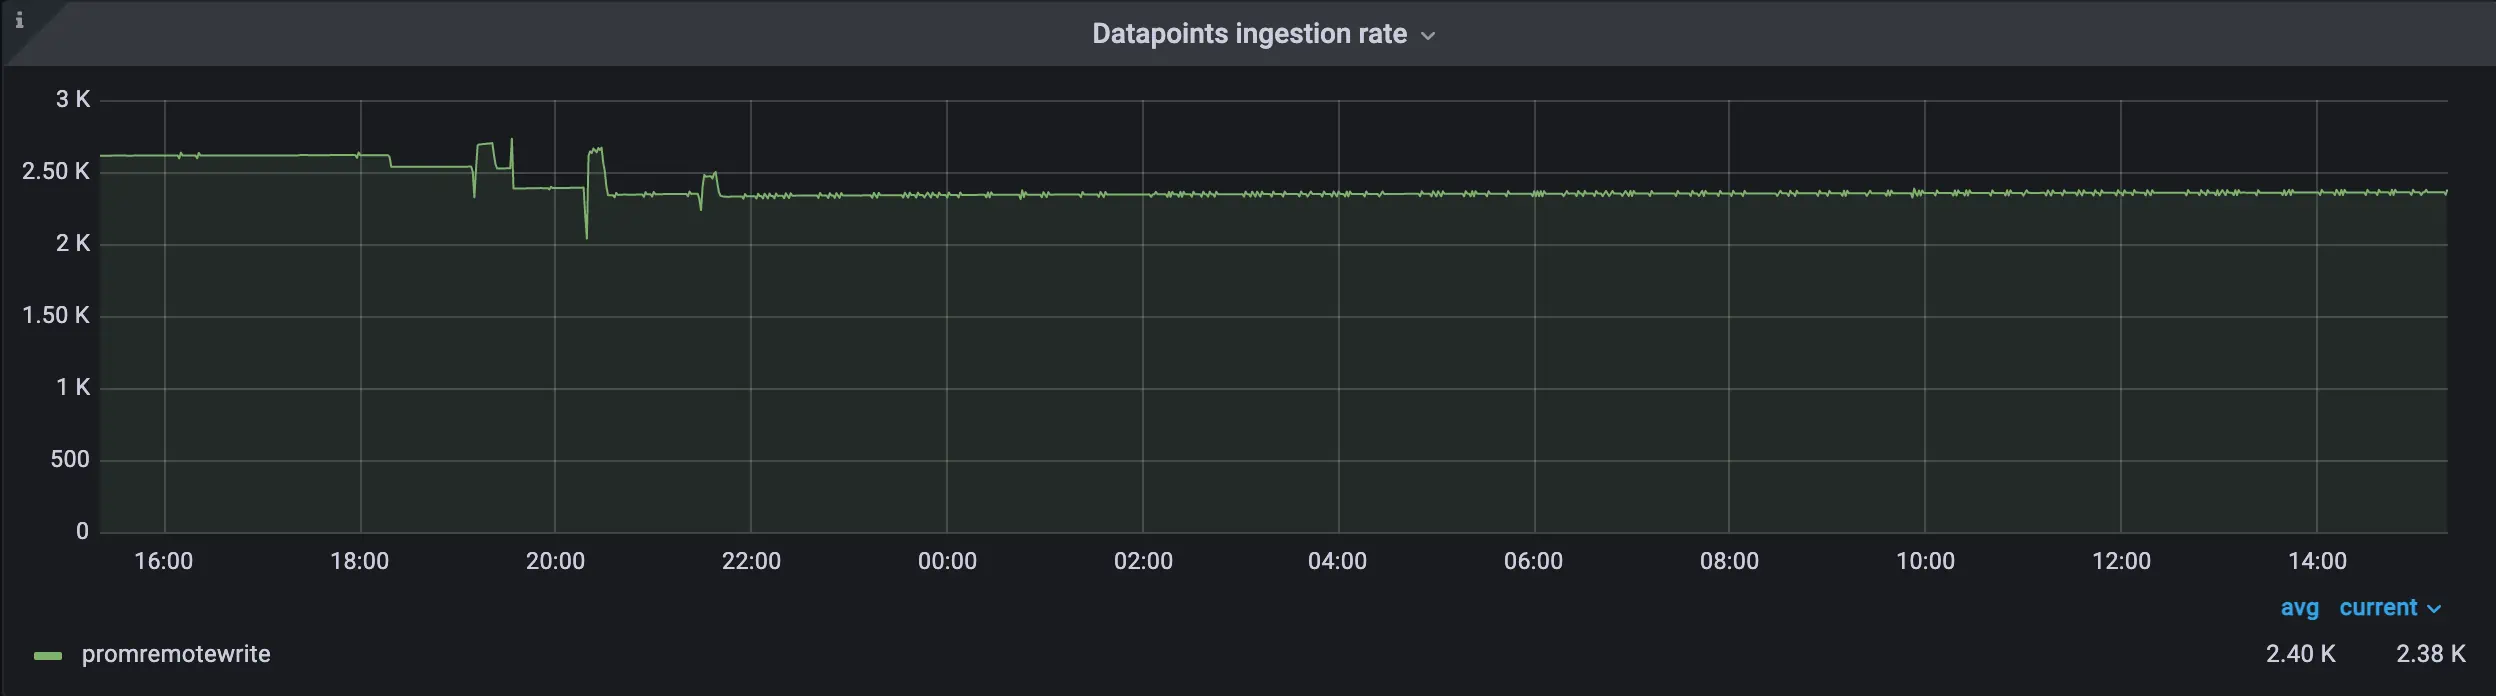
    Datapoints ingestion rate after applying relabeling config Datapoints ingestion rate after applying relabeling config

    Before we applied relabeling config the ingestion rate was 2.62K, and after it decreased to 2.35K
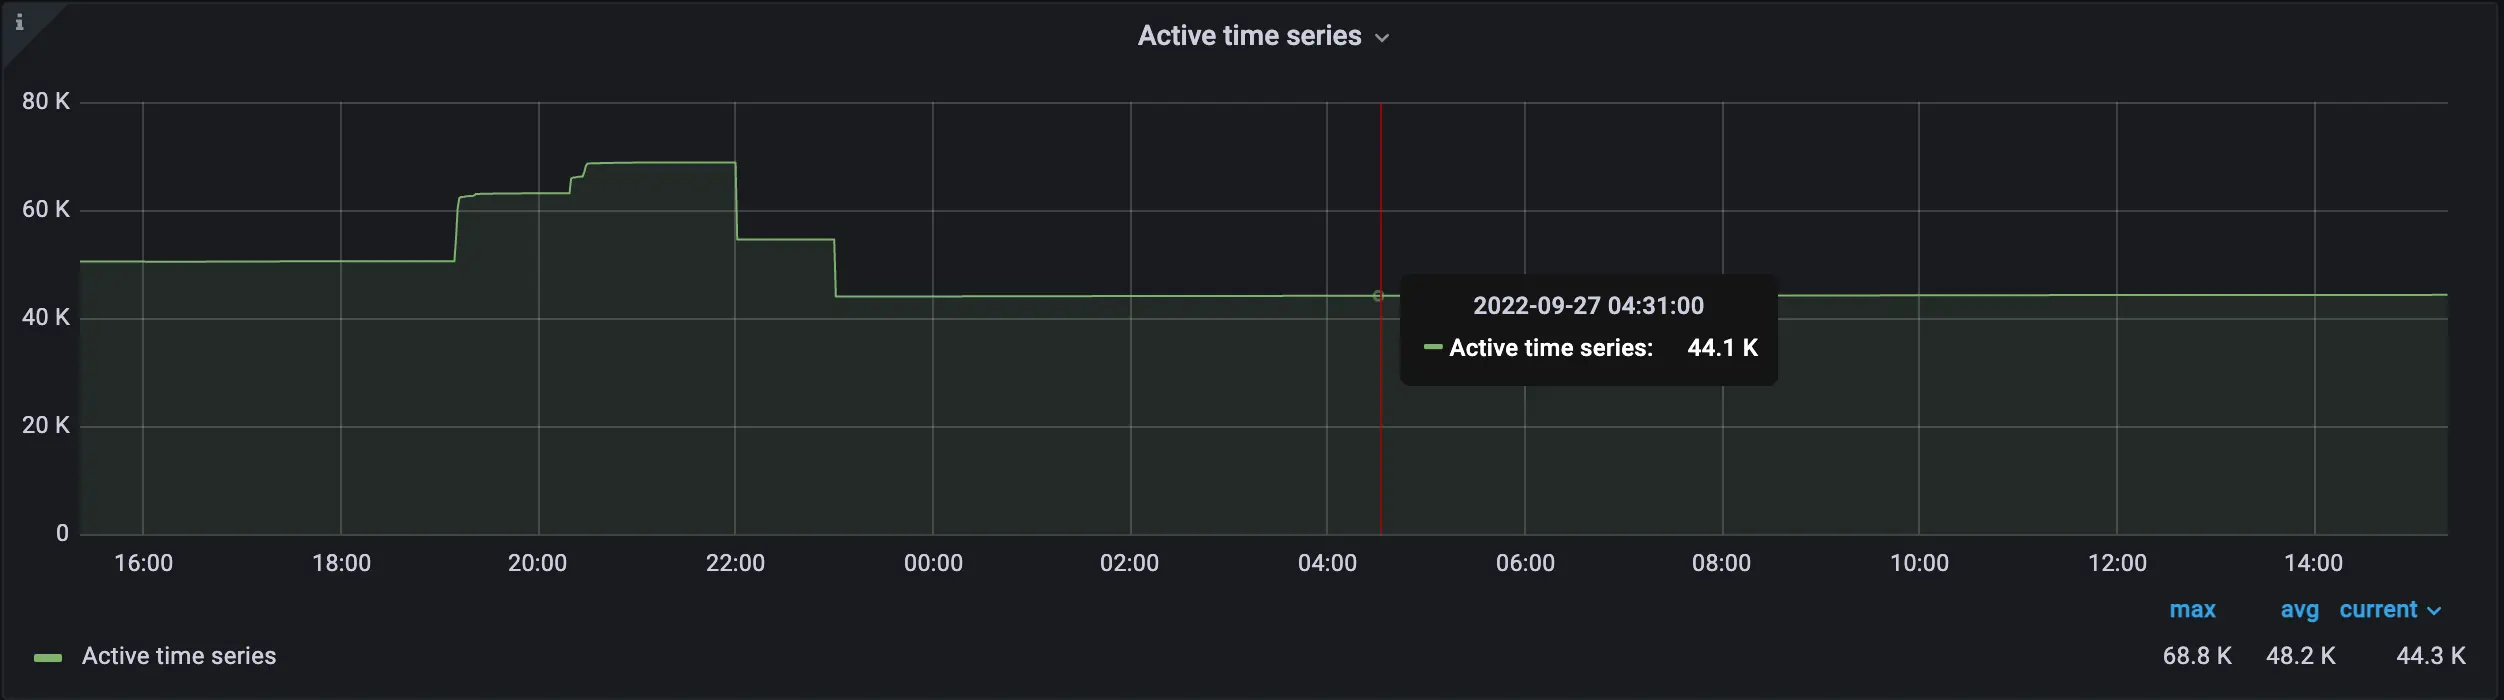
  2. Decrease of active time series:

    Active time series after applying relabeling config Active time series after applying relabeling config

    Before we applied relabeling config active time series was 50.5K, and after it decreased to 44.1K
  3. Increase of storage full ETA (shows the time needed to reach 100% of disk capacity):
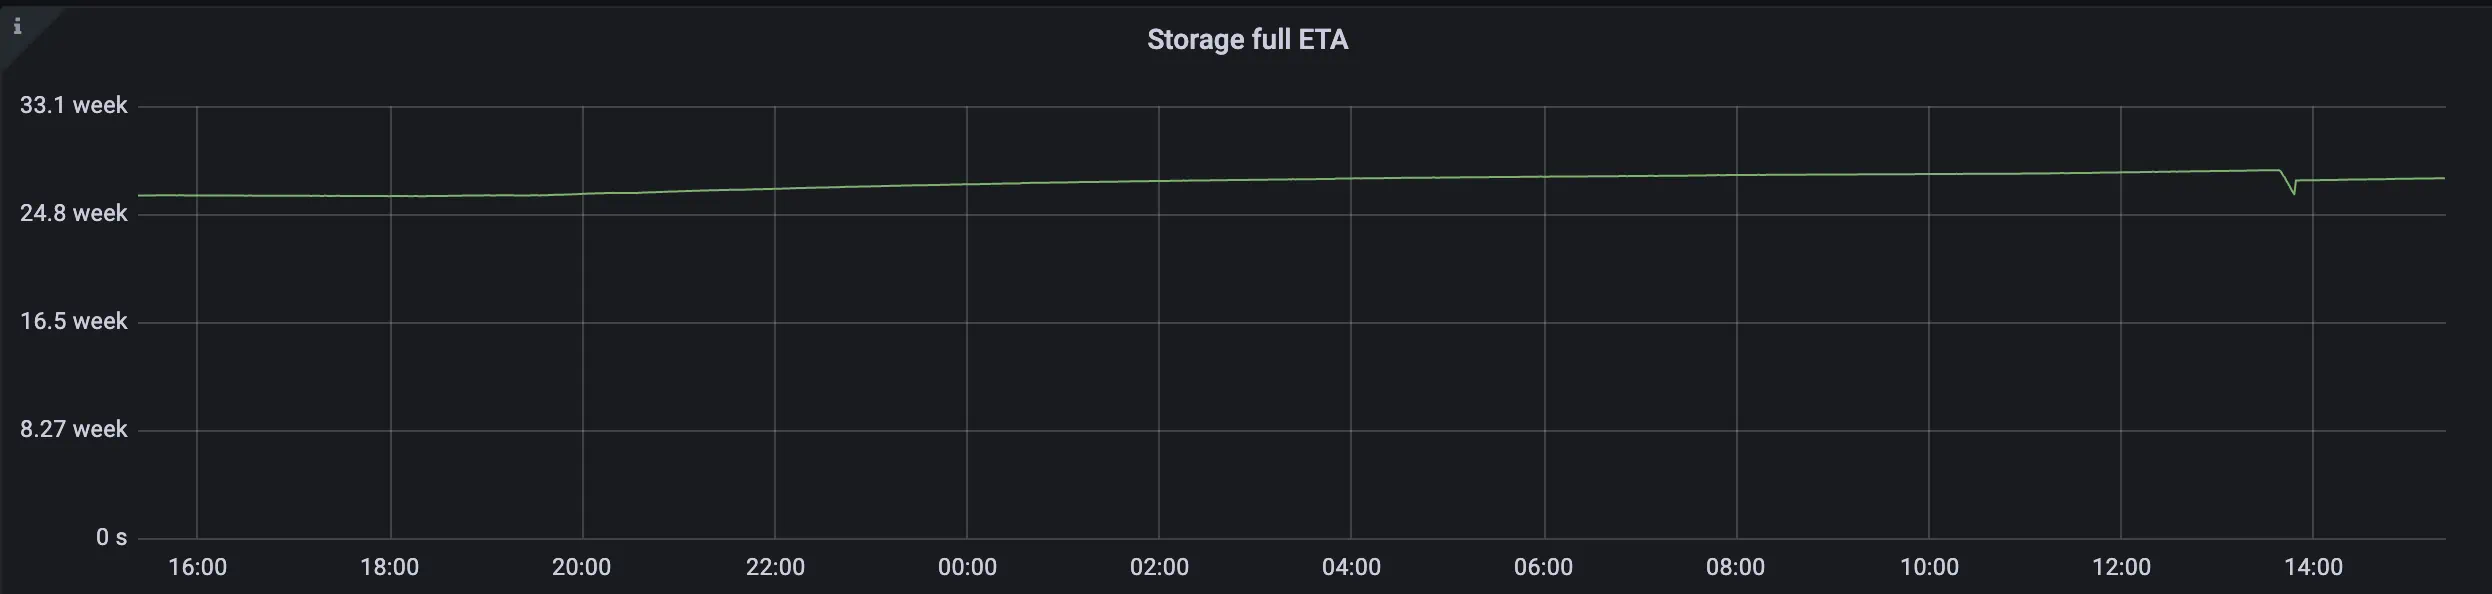
    Storage capacity ETA after applying relabeling config Storage capacity ETA after applying relabeling config

    The change in amount of inserted data helped us to increase our storage capacity from 26.2 weeks to 28.1 weeks

Summary

#

Cardinality explorer is a helpful instrument for analyzing the data of VictoriaMetrics TSDB. It helps to understand which metrics contribute to the cardinality (and so to the resource usage), so users can act accordingly. Always pay attention to the data you write and store. According to our observations, more than 50% of stored metrics are never used. So having an insight to the stored data and its structure can significantly improve the reliability and resource usage of the monitoring solution.