






Last week, members of the VictoriaMetrics team, including myself, spoke at three very different but equally important community events: FOSDEM in Brussels, Cloud Native Days France in Paris, and CfgMgmtCamp in Ghent. Each event drew a different crowd with its own expectations, making them a good way to see where open source observability stands today and how VictoriaMetrics is adapting to real-world needs.
The talks we gave were snapshots of the problems we are actively working on: scaling time series storage reliably, reducing the cost and environmental impact of observability, simplifying log management, and exploring how new interaction models, such as AI assistants, can improve how engineers work with their data.
FOSDEM is primarily a developer-focused conference centered on open source and free software. While this year did not include a dedicated observability dev room, many talks highly relevant to observability practitioners appeared across other tracks, including network, databases, energy, and eBPF.
One such talk focused on the internal mechanics of building a time-series database capable of sustaining very high ingestion rates over long periods. Our CTO, Aliaksandr Valialkin, presented VictoriaMetrics, a database written from scratch in Go and optimized for write-heavy workloads. VictoriaMetrics installations routinely ingest millions of samples per second, with larger clusters pushing far beyond that.
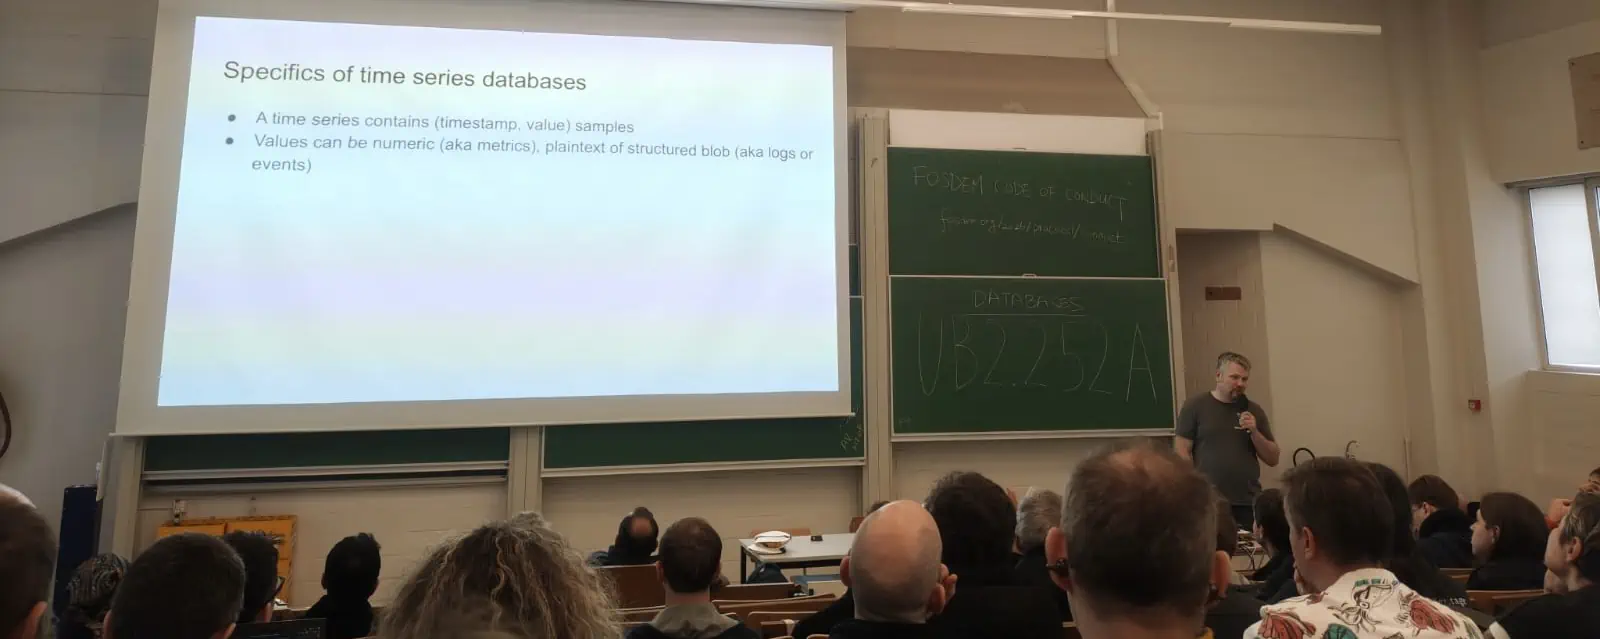
At that scale, performance is inseparable from storage design. Filesystem behavior, write amplification, snapshotting strategies, and crash safety are not abstract concerns; they decide whether a system stays predictable under load.
The presentation walked through how VictoriaMetrics approaches these problems, drawing directly from production code. Topics such as snapshot creation without stopping ingestion, protecting data integrity after power loss, and the trade-offs around write-ahead logging were discussed in the context of real failure modes we have seen in the field. The goal was not to promote a specific implementation, but to share patterns that apply to any system that continuously writes large volumes of data. You can watch the full recording of this talk here.
The second FOSDEM talk approached observability from a very different angle: sustainability and carbon footprint.
As our Developer Advocate, I pointed out that the question isn’t how much data we can collect, but how much we truly need. Observability stacks are often designed to maximize visibility, but at scale, this frequently leads to excessive ingestion, long retention periods, and inefficient queries. All of these translate directly into higher energy consumption.
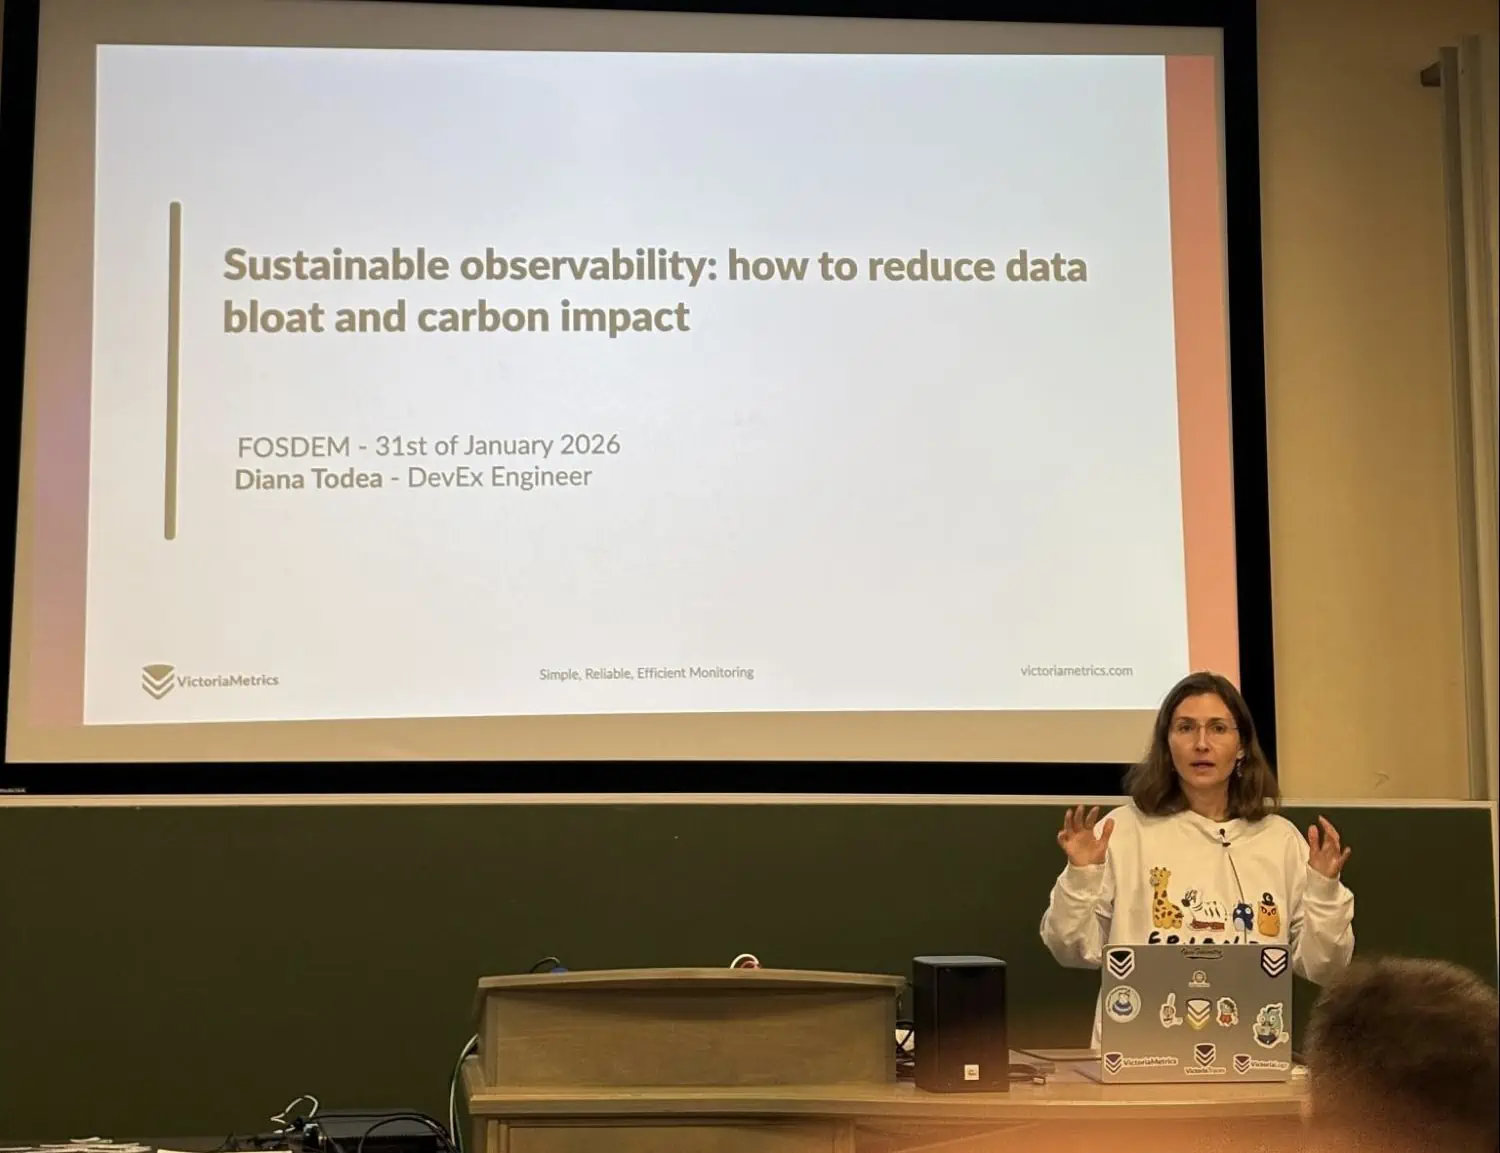
I pointed out that sustainability in observability is primarily an engineering problem. Choices around metric cardinality, aggregation, retention, and query patterns determine not just cost and performance, but also environmental impact. My talk connected these decisions to the principles promoted by the Green Software Foundation and showed how more careful observability design can reduce data volume while improving system reliability. The demo of my talk illustrated one such useful feature, Cardinality Explorer, which helps identify expensive metrics and reduce high cardinality, found within the VictoriaMetrics vmui.
You can watch the full recording of this talk here.
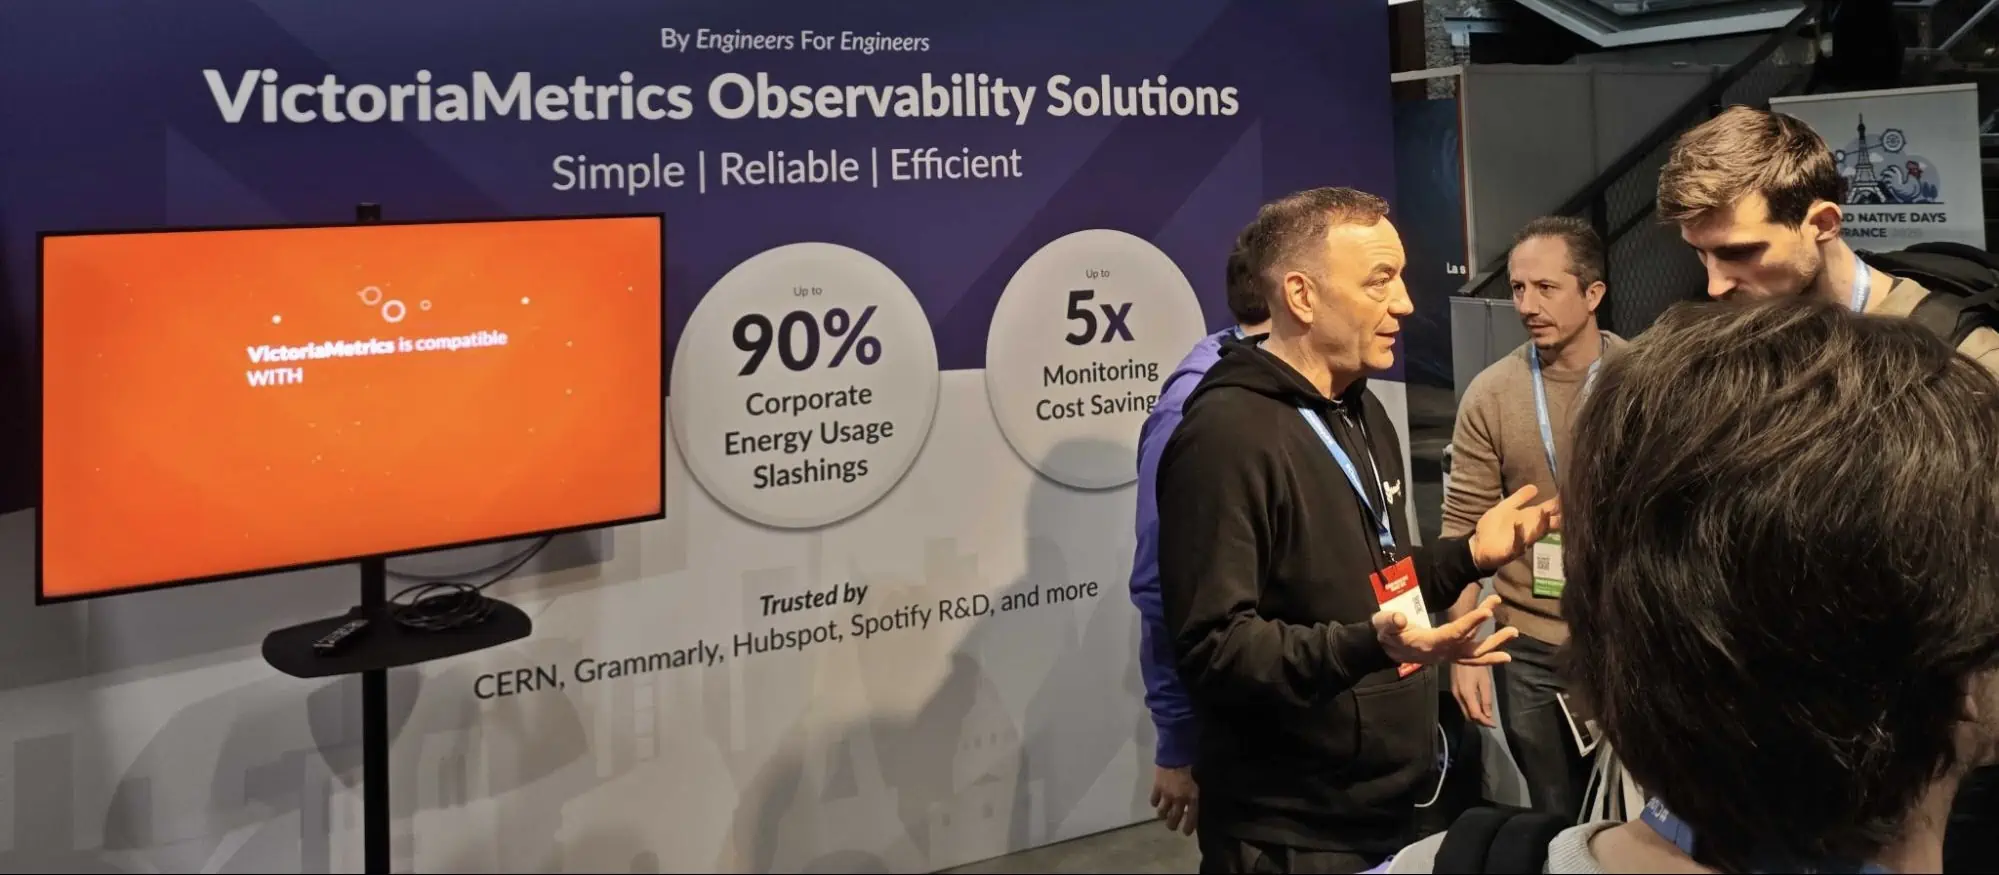
Cloud Native Days France attracted a more practitioner-focused audience, with many developers and SREs who deal daily with the operational realities of cloud-native systems. Along with our talk, we joined as a Gold Sponsor, which allowed us to spend more time connecting with attendees outside the presentation room.
We used this opportunity to present VictoriaLogs and to explain why we built it the way we did. In many organizations, log pipelines evolve into heavyweight systems that require constant tuning and significant infrastructure resources. Our experience operating large-scale observability platforms led us to a different set of priorities: minimal configuration, predictable performance, and efficient use of CPU, memory, and disk.
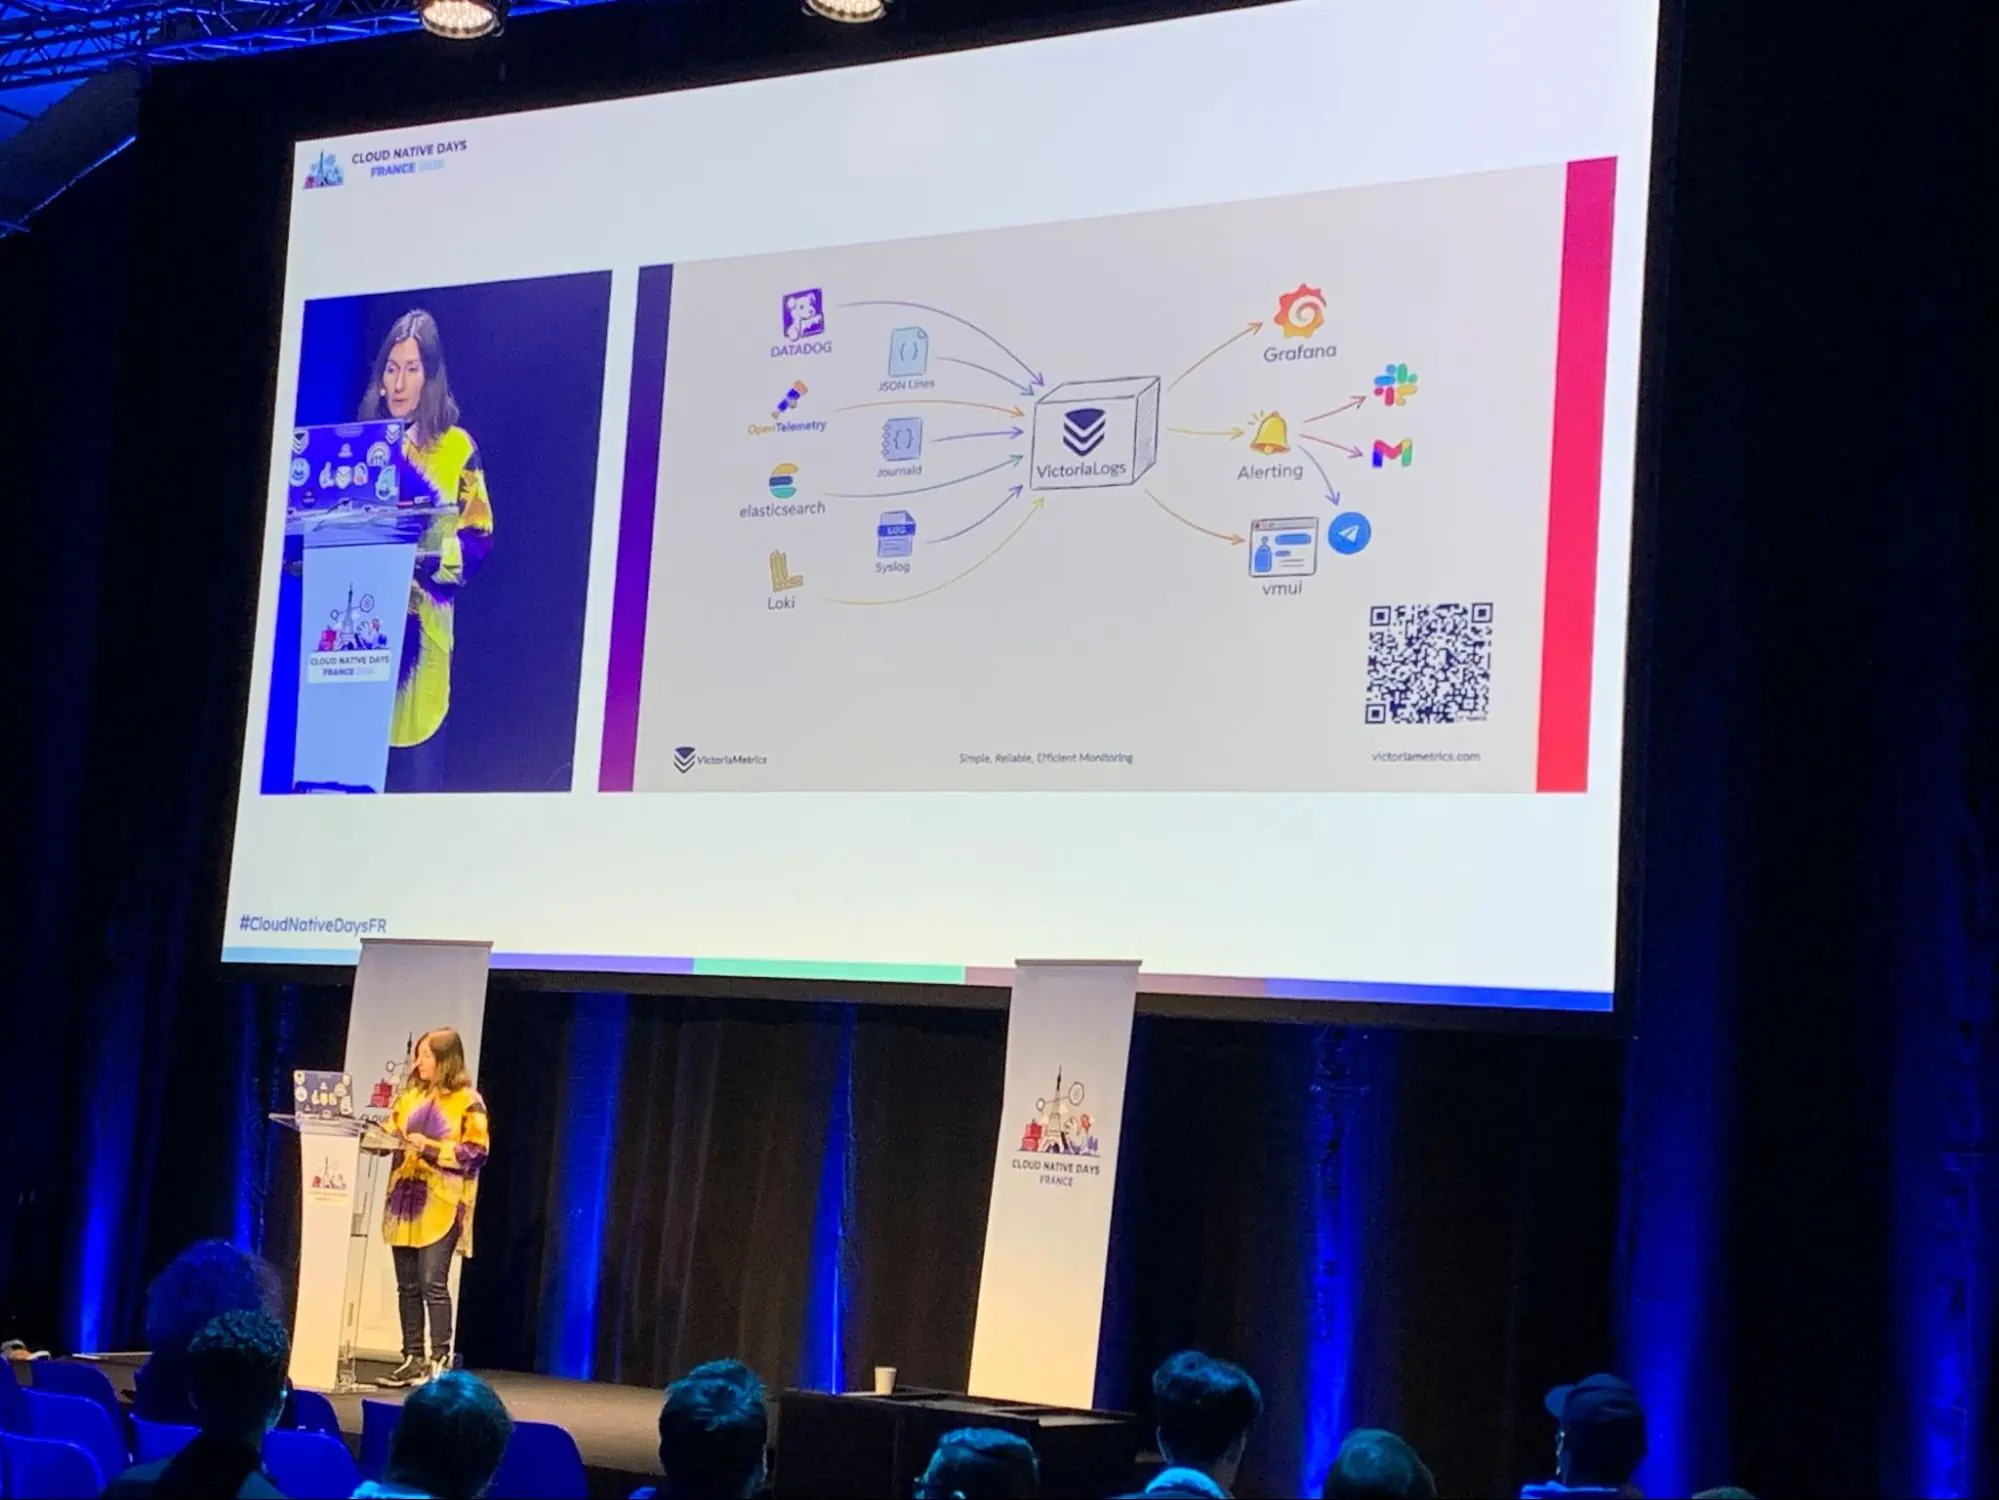
The session showed how VictoriaLogs approaches log ingestion and querying with these constraints in mind. Instead of pushing complexity onto users, it aims to provide fast full-text search, live tailing, and out-of-the-box support for backfilling historical data. A significant part of the discussion focused on resource efficiency, with concrete examples illustrating how reduced memory and disk usage affect the economics of running log systems at scale.
Another important aspect was query ergonomics. High-cardinality log fields are common in modern systems, yet they are often avoided because of performance concerns. By demonstrating LogsQL in practice, the talk showed how to explore such fields instantly without the usual penalties. Integrations with existing tools, such as Grafana, reinforced the idea that logs should fit naturally into engineers’ workflows rather than forcing them to adopt entirely new mental models.
Those conversations were as valuable as the session itself. At the booth and during breaks, we discussed real production setups, migration paths from existing log stacks, and the operational pain points teams face when logs start to dominate infrastructure costs. Many of these discussions focused on predictable performance, memory usage, and the difficulty of maintaining complex log pipelines over time.
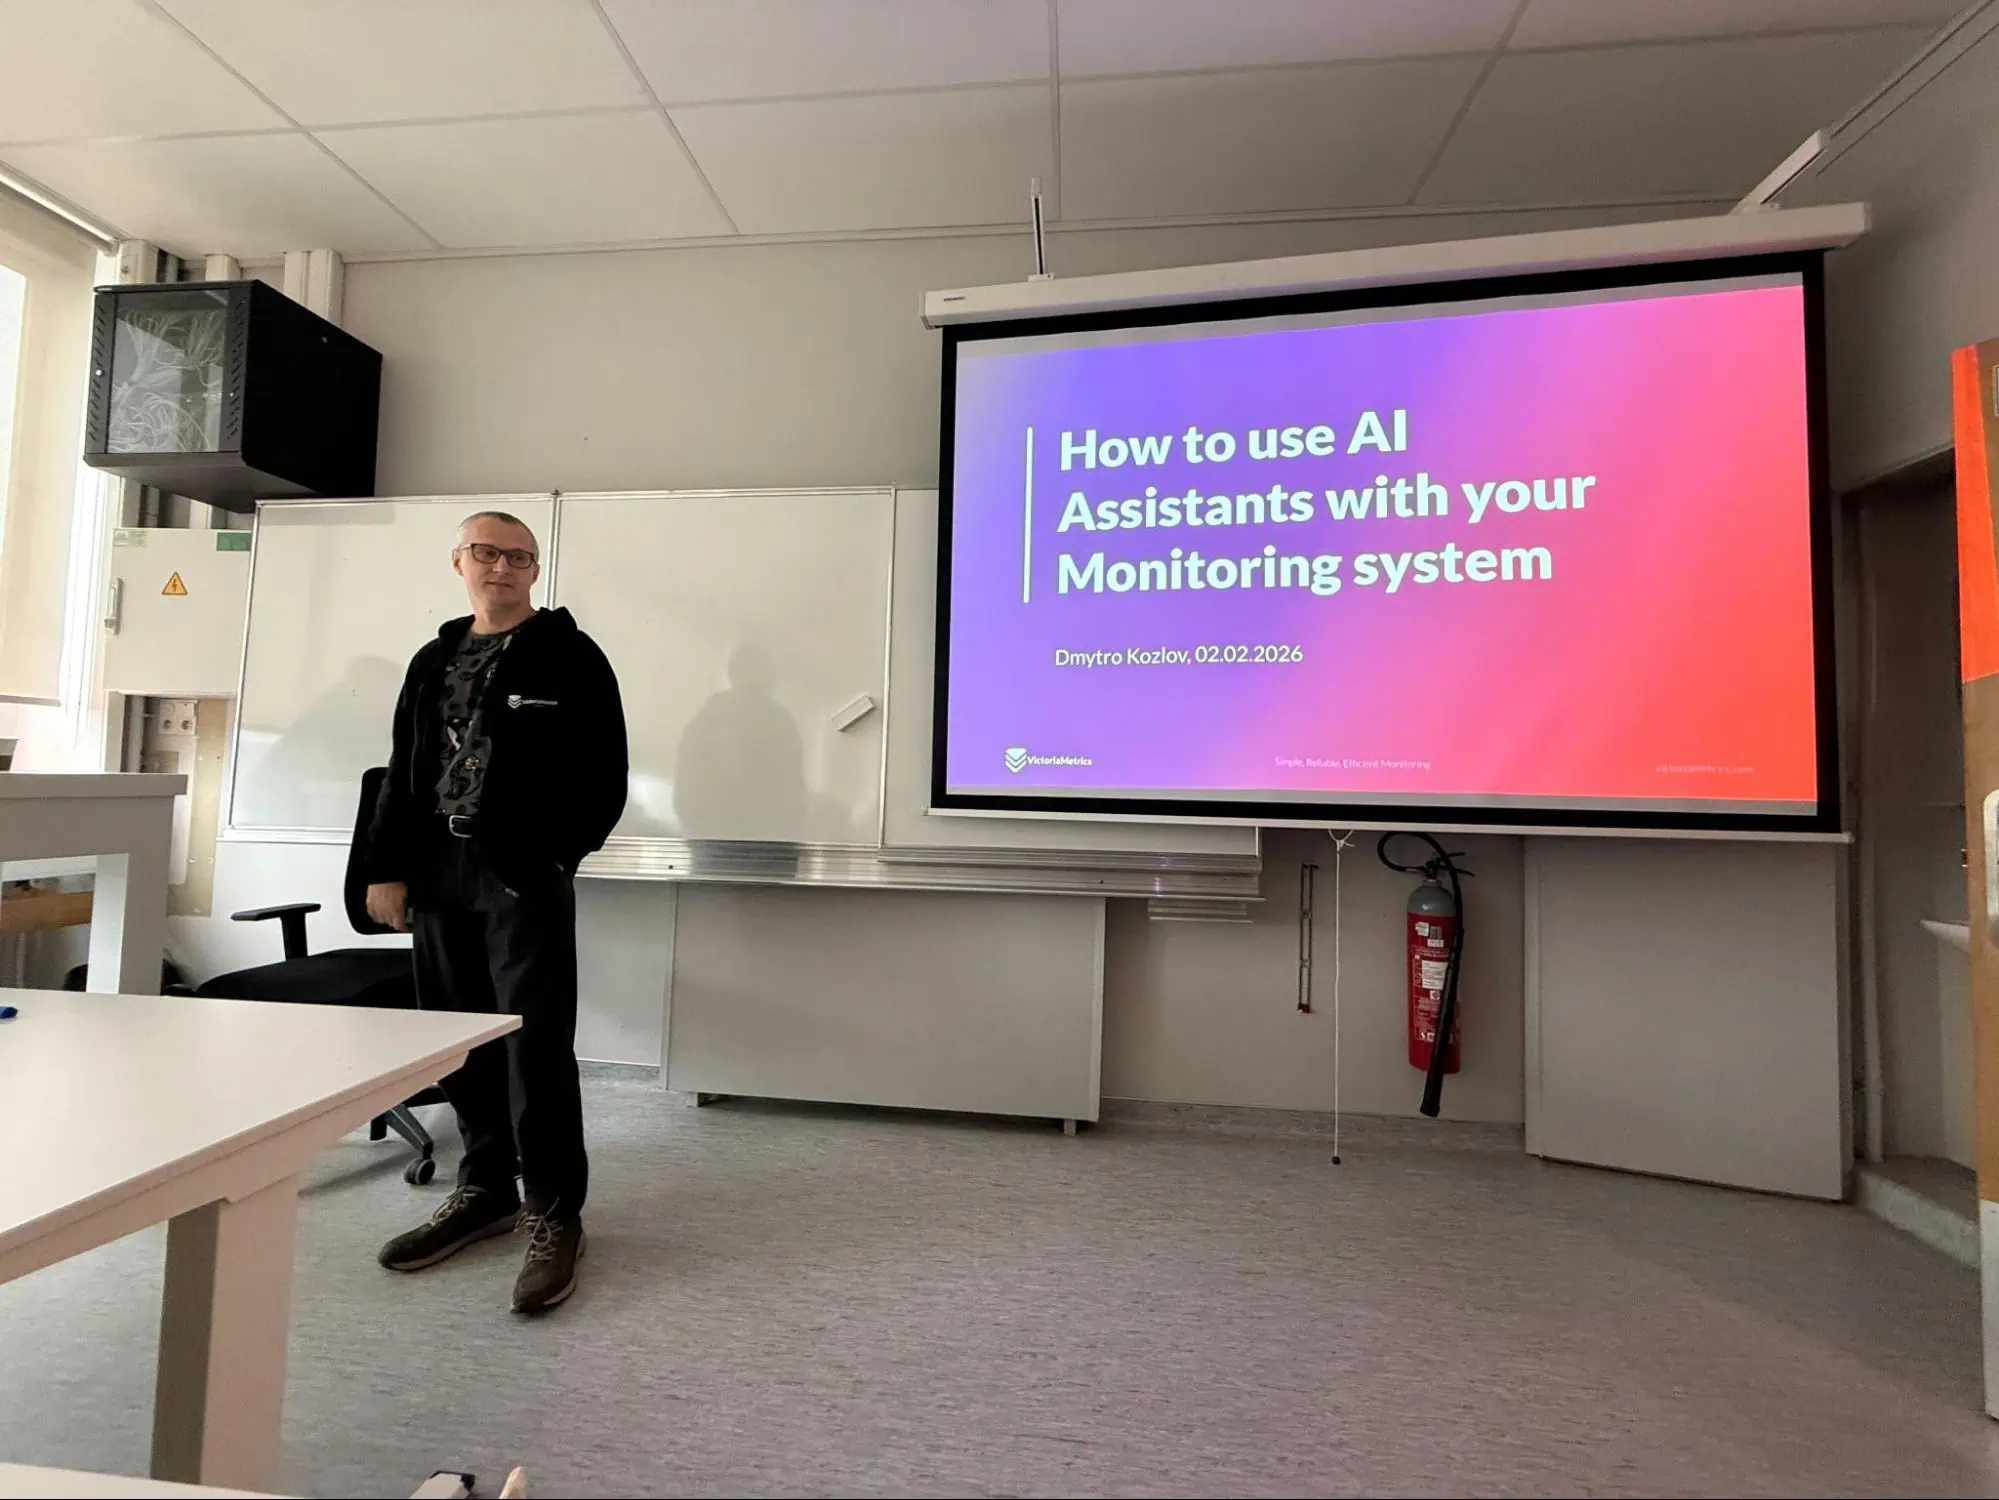
One of the talks at this conference examined how AI assistants could act as a new interface to observability systems. Our software engineer, Dmytro Kozlov, explained how, instead of treating large language models as replacements for expertise, we can use them as amplifiers of existing knowledge. By introducing MCP (Model Context Protocol) servers, AI assistants can interact with observability backends in a controlled and explicit way.
Using VictoriaMetrics’s MCP server as an example, the session demonstrated how engineers can query metrics, logs, and traces in natural language, ask for explanations of complex queries, or explore cardinality and alerting rules without needing to memorize every detail of a query language.
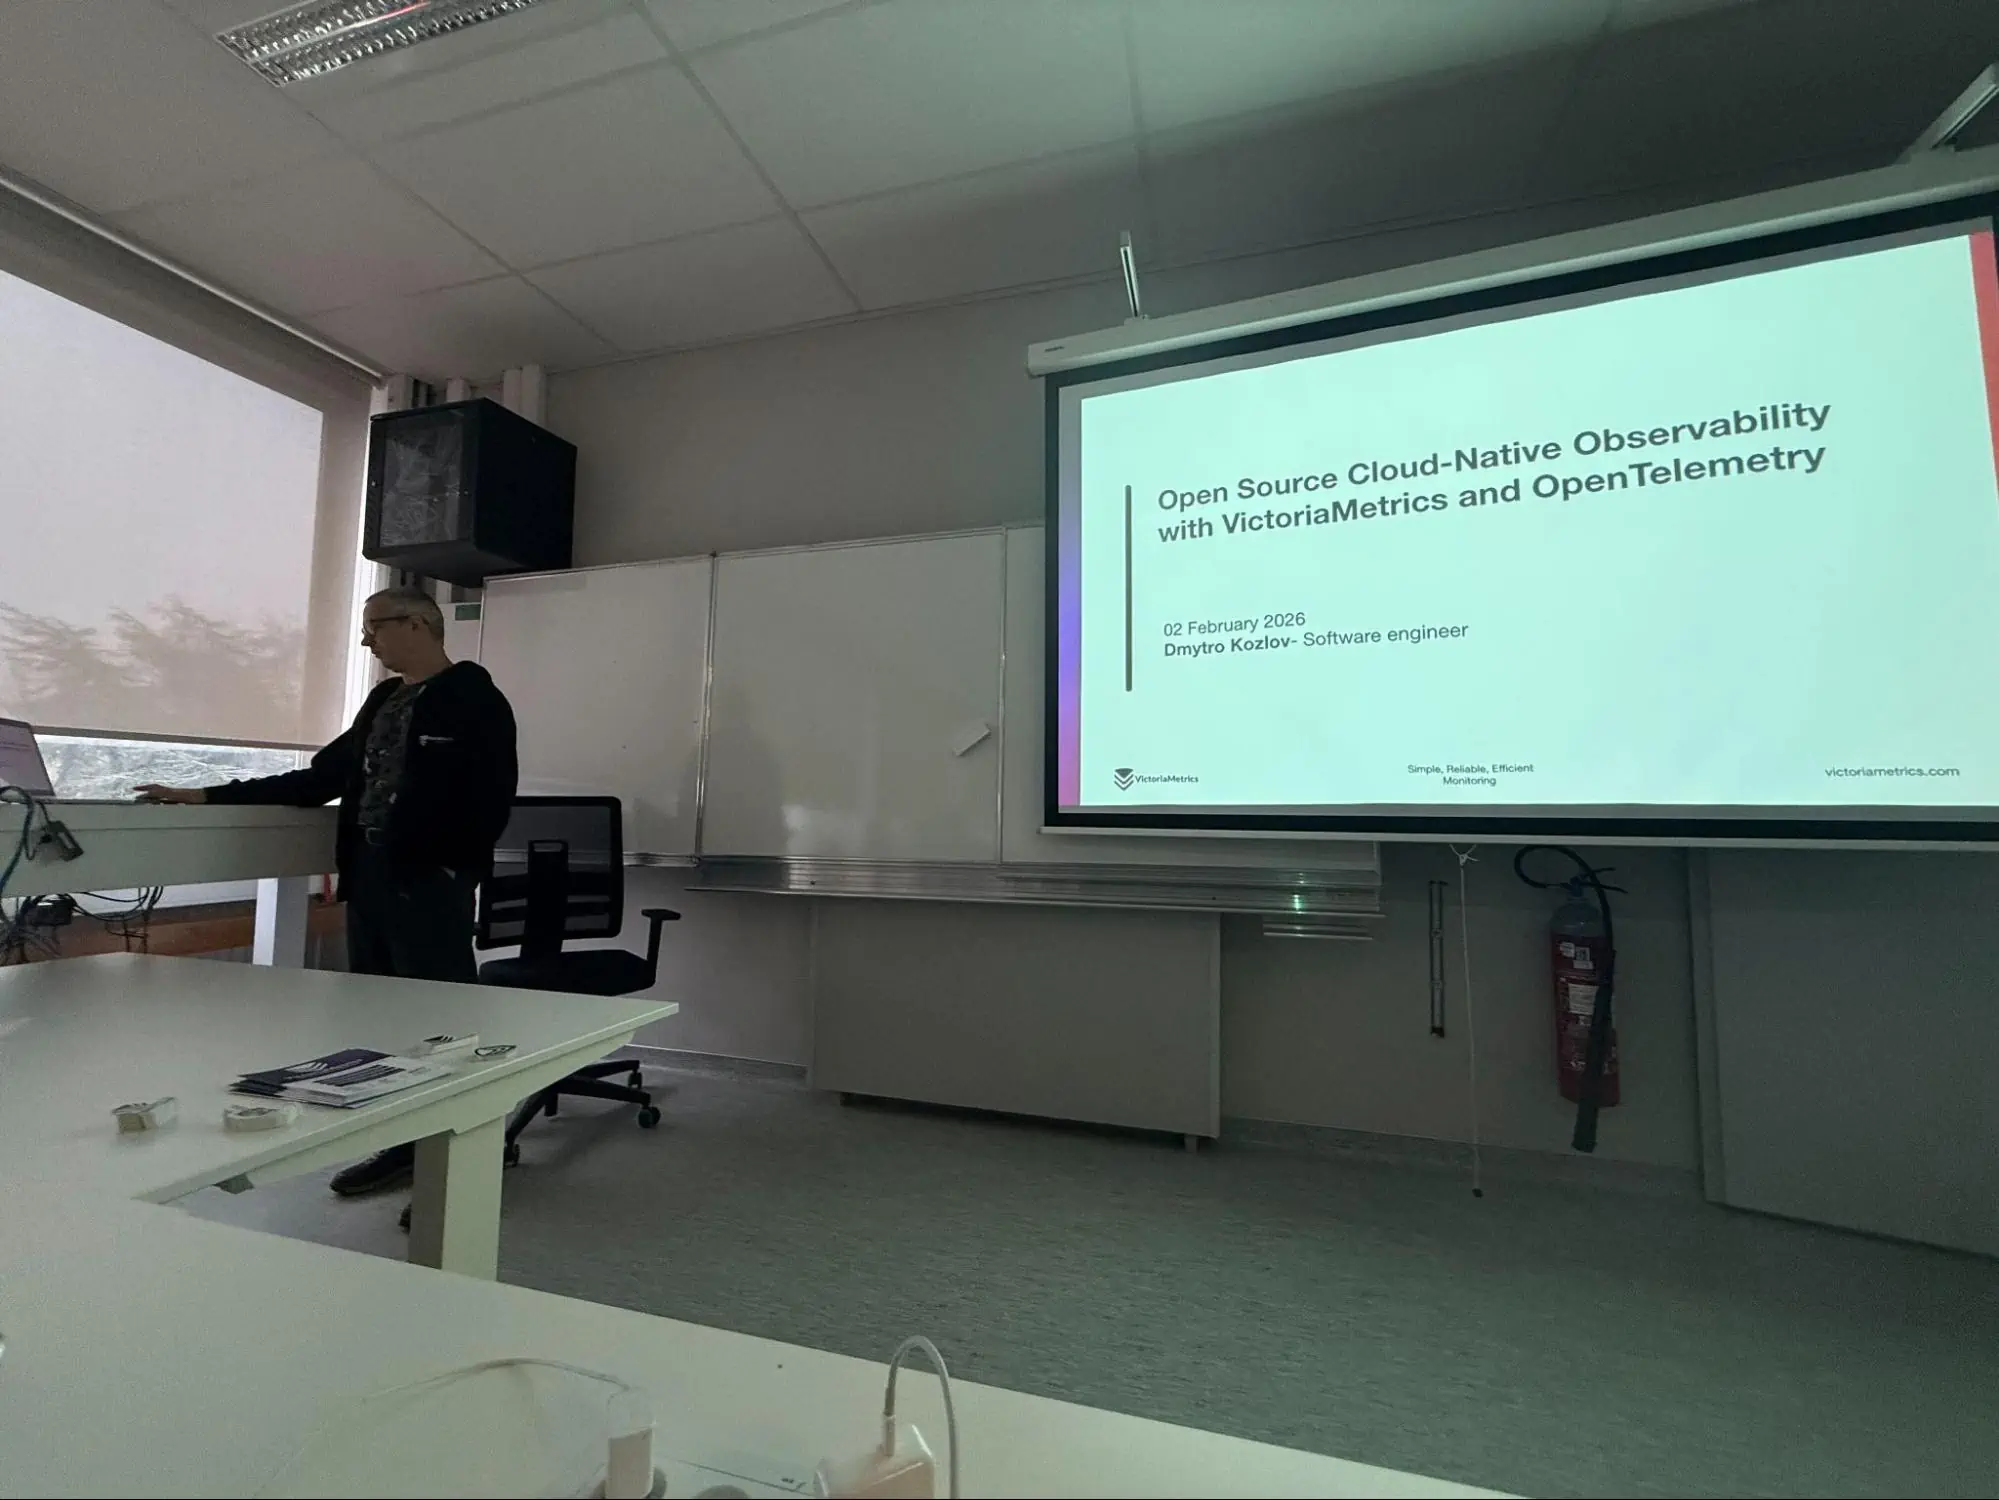
The second CfgMgmtCamp session returned to a more classical observability topic: collecting and correlating metrics, logs, and traces in cloud-native environments. OpenTelemetry has become the standard for instrumentation, but its effectiveness depends heavily on the backend that stores and serves the data.
By walking through an OpenTelemetry-based demo, we showed how VictoriaMetrics can serve as a single open-source backend for all three signals. Metrics compatibility with the Prometheus ecosystem remains a core strength, but extending the same performance and efficiency principles to logs and traces allows teams to simplify their architectures. One can explore the correlated observability signals in our Grafana playground highlighting how the operational overhead can be reduced while preserving deep visibility into distributed systems.
Across all three events, these conferences provided valuable feedback from practitioners building and operating real systems. At Cloud Native Days France, attendees were particularly interested in hearing about VictoriaMetrics’ evolution from a time-series-based monitoring solution to a full observability stack covering metrics, logs, and traces. Our log solution resonated strongly, and people were curious to learn that tracing capabilities are now part of the stack. Features like anomaly detection drew significant interest, and security aspects prompted numerous technical questions, reflecting the practical concerns of operating observability at scale.
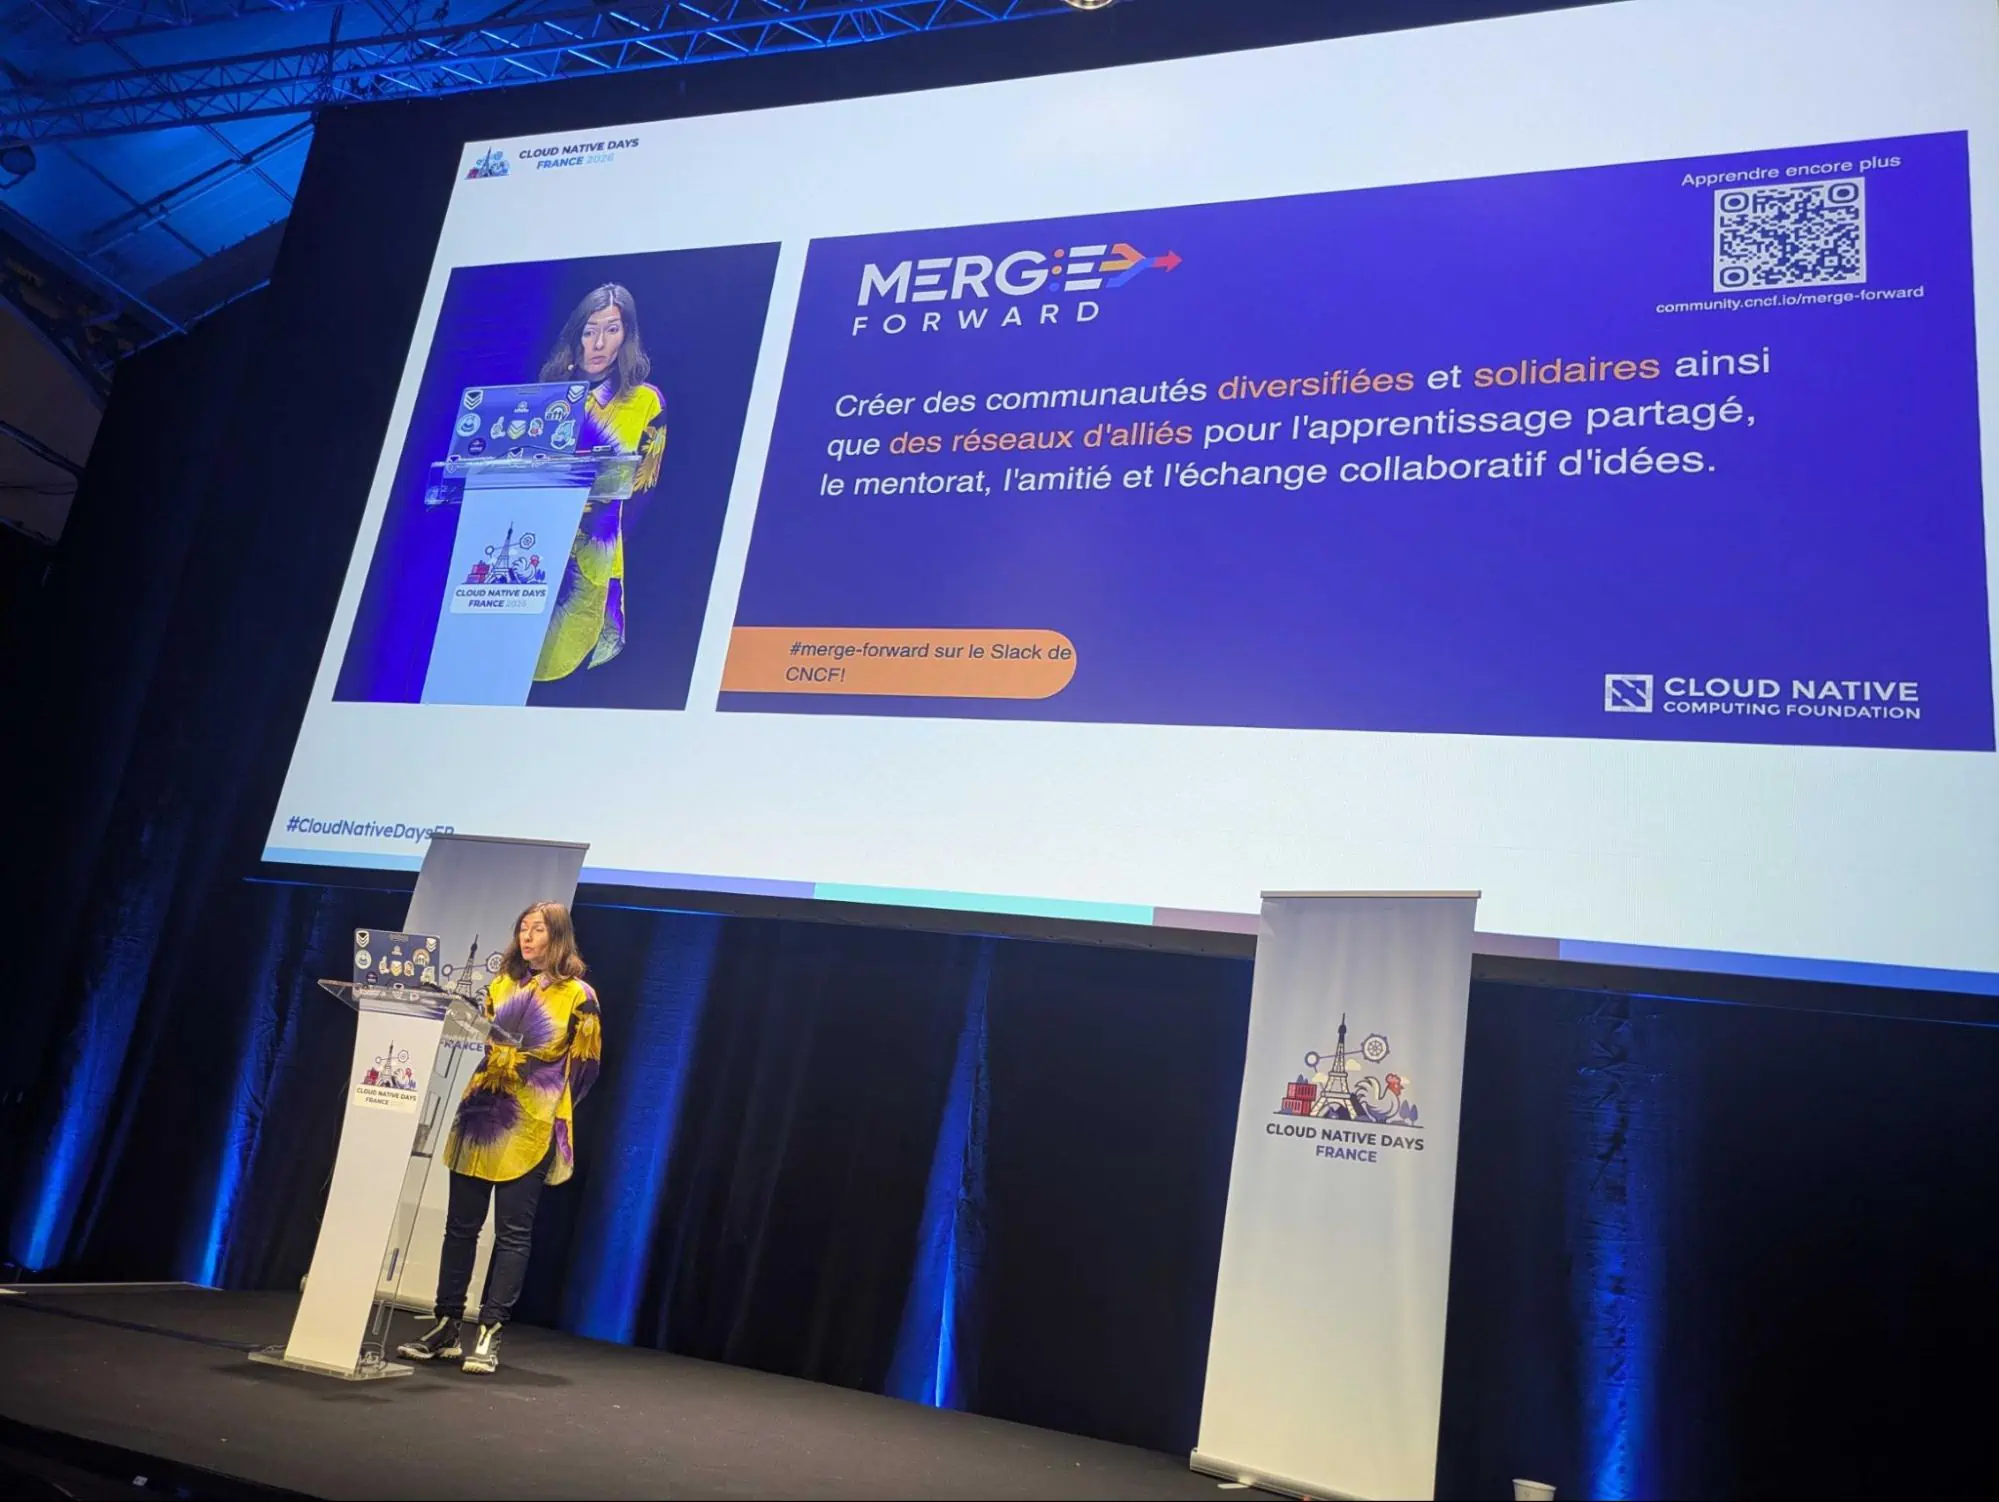
Beyond presenting technical work, we also used these events to actively support the broader cloud-native community. Through our talks and conversations, we highlighted initiatives such as the CNCF Merge-Forward, which focuses on welcoming and supporting underrepresented groups in tech. These discussions reinforced the idea that observability does not exist in isolation, but as part of a broader ecosystem that depends on shared standards, open governance, and sustained community investment.
Check out VictoriaMetrics, VictoriaLogs, and VictoriaTraces for more details, and get involved with our community. If you spot anything outdated or have questions, don’t hesitate to reach out. You can drop me a DM on LinkedIn.
此内容由惯性聚合(RSS阅读器)自动聚合整理,仅供阅读参考。 原文来自 — 版权归原作者所有。