


When it comes to observability, people often refer to its three pillars: metrics, tracing, and logging. At VictoriaMetrics, we already have solutions for metrics and logging: VictoriaMetrics and VictoriaLogs. Throughout these years, we’ve heard a common question from the community: When will VictoriaTraces be released?
If you are interested in this topic, then this blog post is for you. We’ll share the results of our research into distributed tracing and explore two key questions: Will there be a VictoriaTraces? And how competitive could it be?
A trace is a collection of many spans. So if we are going to build VictoriaTraces from scratch, the first thing we need to consider is: what does a span look like, and what type of database is best suited to store this kind of data?
Here’s an example of a trace span:
{
  "name": "/v1/sys/health",
  "context": {
    "trace_id": "7bba9f33312b3dbb8b2c2c62bb7abe2d",
    "span_id": "086e83747d0e381e"
  },
  "parent_id": "",
  "start_time": "2021-10-22 16:04:01.209458162 +0000 UTC",
  "end_time": "2021-10-22 16:04:01.209514132 +0000 UTC",
  "status_code": "STATUS_CODE_OK",
  "status_message": "",
  "attributes": {
    "http.method": "GET",
    "http.target": "/v1/sys/health",
    "http.server_name": "mortar-gateway",
  },
  "events": [
    {
      "name": "",
      "message": "OK",
      "timestamp": "2021-10-22 16:04:01.209512872 +0000 UTC"
    }
  ]
}
You can easily observe that it is essentially a collection of key-values. Only a small subset (such as trace_id and attributes) is used for querying, while the rest is primarily for display.
If you’re familiar with some logging solutions, you may know that logs can be categorized into two branches: structured logs and unstructured logs. Trace spans and structured logs are quite similar and have a lot in common, including:
Currently, very few data structures are optimized for read performance, write performance, and disk space (or data compression) all at once. In most cases, only one or two of these can be effectively achieved. For structured logs and trace spans, the design typically prioritizes write throughput and storage efficiency. As a result:
So far, our goal has become slightly more defined: VictoriaTraces is likely an LSM-Tree-based columnar storage database.
Before reinventing the wheel, we first checked which existing databases already meet these requirements. If you are a Jaeger user, you may be familiar with one of its storage backends: ClickHouse. It worked as a plugin in Jaeger v1, and by Jaeger v2, the community had introduced native support for it—proof that LSM-Tree-based columnar storage works well for trace span data.
_ch_ prefixes) characteristic of ClickHouse when reviewing exported trace span data. So Tencent Cloud should also be one of the ClickHouse users.Shortly after the release of VictoriaLogs v1.0.0, we found that it might already meet the requirements for storing trace spans. It is designed for structured logs, and as we mentioned earlier, structured logs and trace spans are similar in many aspects.
 The idea
So instead of building VictoriaTraces from scratch, we decided to run a proof of concept using VictoriaLogs: What if it works? What if it works really well?
In VictoriaLogs, each log entry consists of multiple fields, including several special fields and ordinary fields:
{application_name="...", env="..."}. High-cardinality values (e.g., ip, user_id, trace_id) are unsuitable for stream fields.When storing trace spans in VictoriaLogs, the process is straightforward: flatten all content into fields and select specific fields as stream fields/time field.
For example, service name and span name (also known as operation name in Jaeger) are commonly used as primary search conditions. Since they usually have low cardinality, they are well-suited as stream fields. All other span attributes are flattened into ordinary fields.
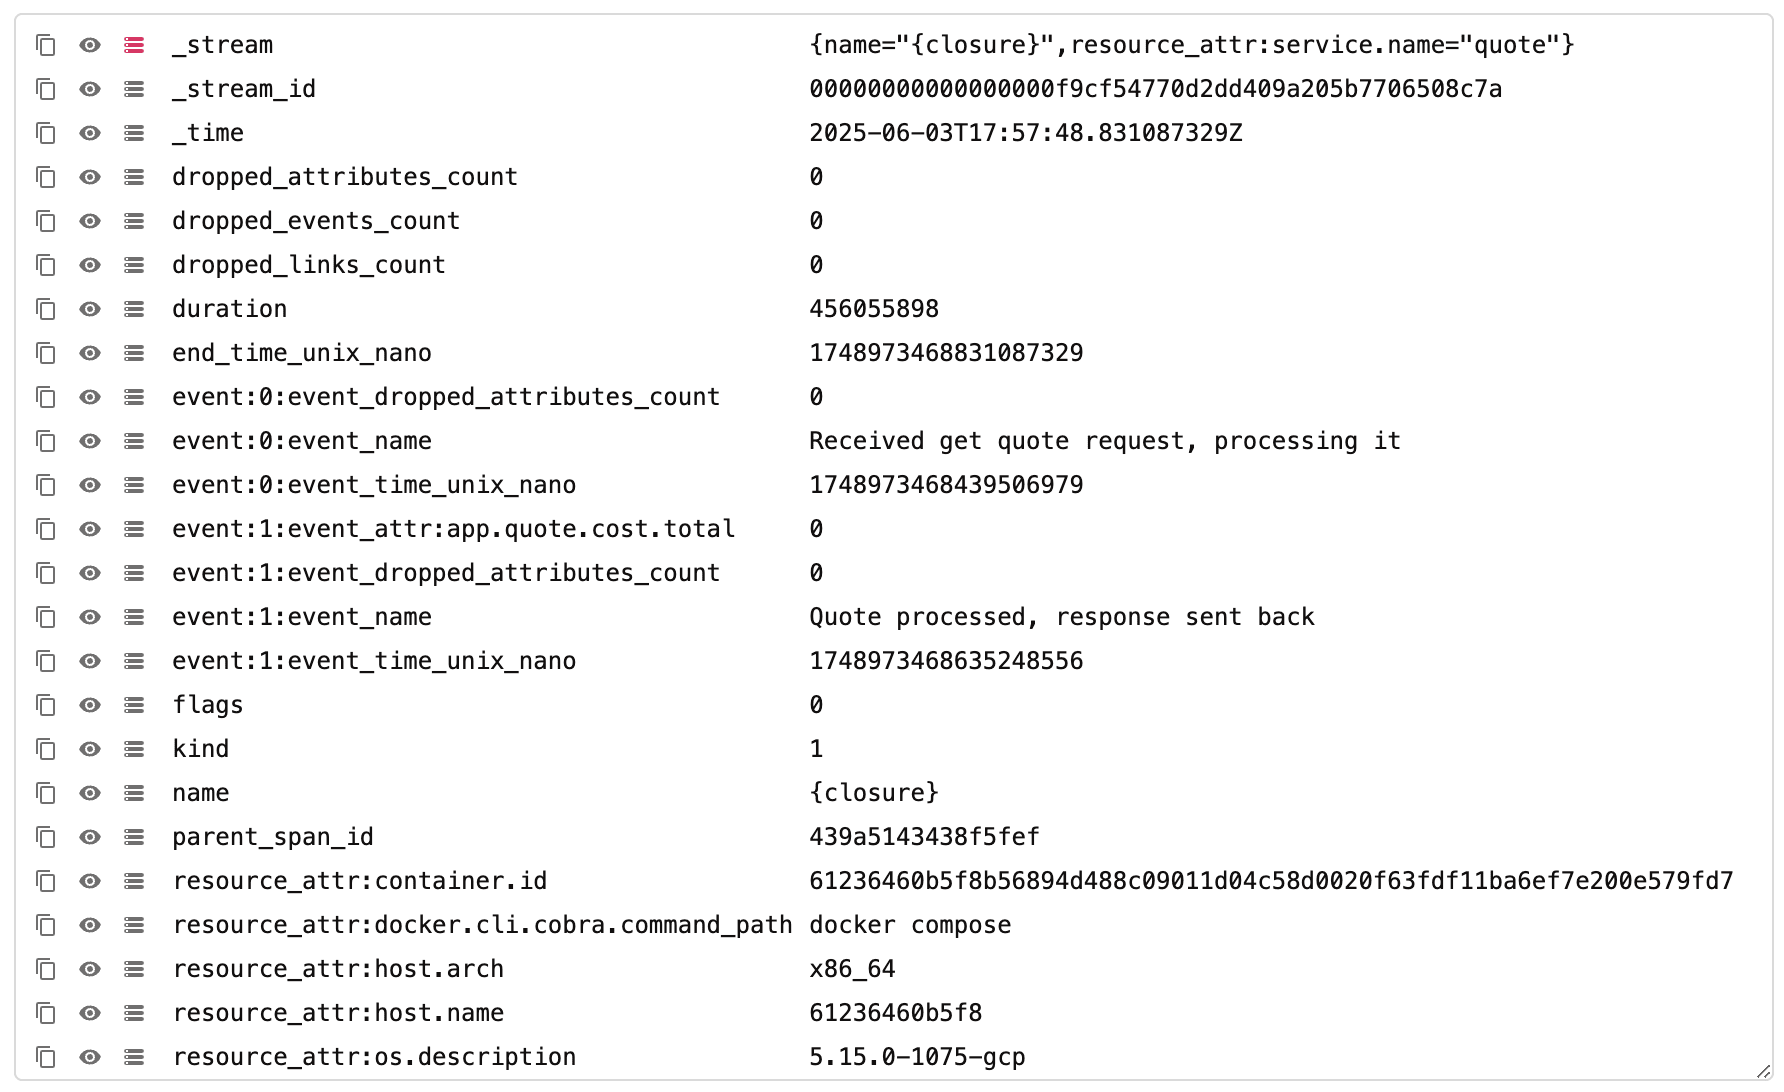 Trace spans in VictoriaLogs
What we care about most is how VictoriaLogs’ data ingestion performance compares to other competitors.
Jaeger and Grafana Tempo are widely used in distributed tracing. For our proof of concept, we selected the following setups for comparison with VictoriaLogs: Jaeger + ClickHouse, Jaeger + Elasticsearch, and Grafana Tempo + S3.
VictoriaLogs, ClickHouse, Elasticsearch and Tempo were allocated 4 CPUs and 8 GiB of memory, while other components were provided with sufficient resources as needed to ensure no bottlenecks. All components were using balanced persistent disk (backed by solid-state drives).
The overall benchmark architecture is very simple:
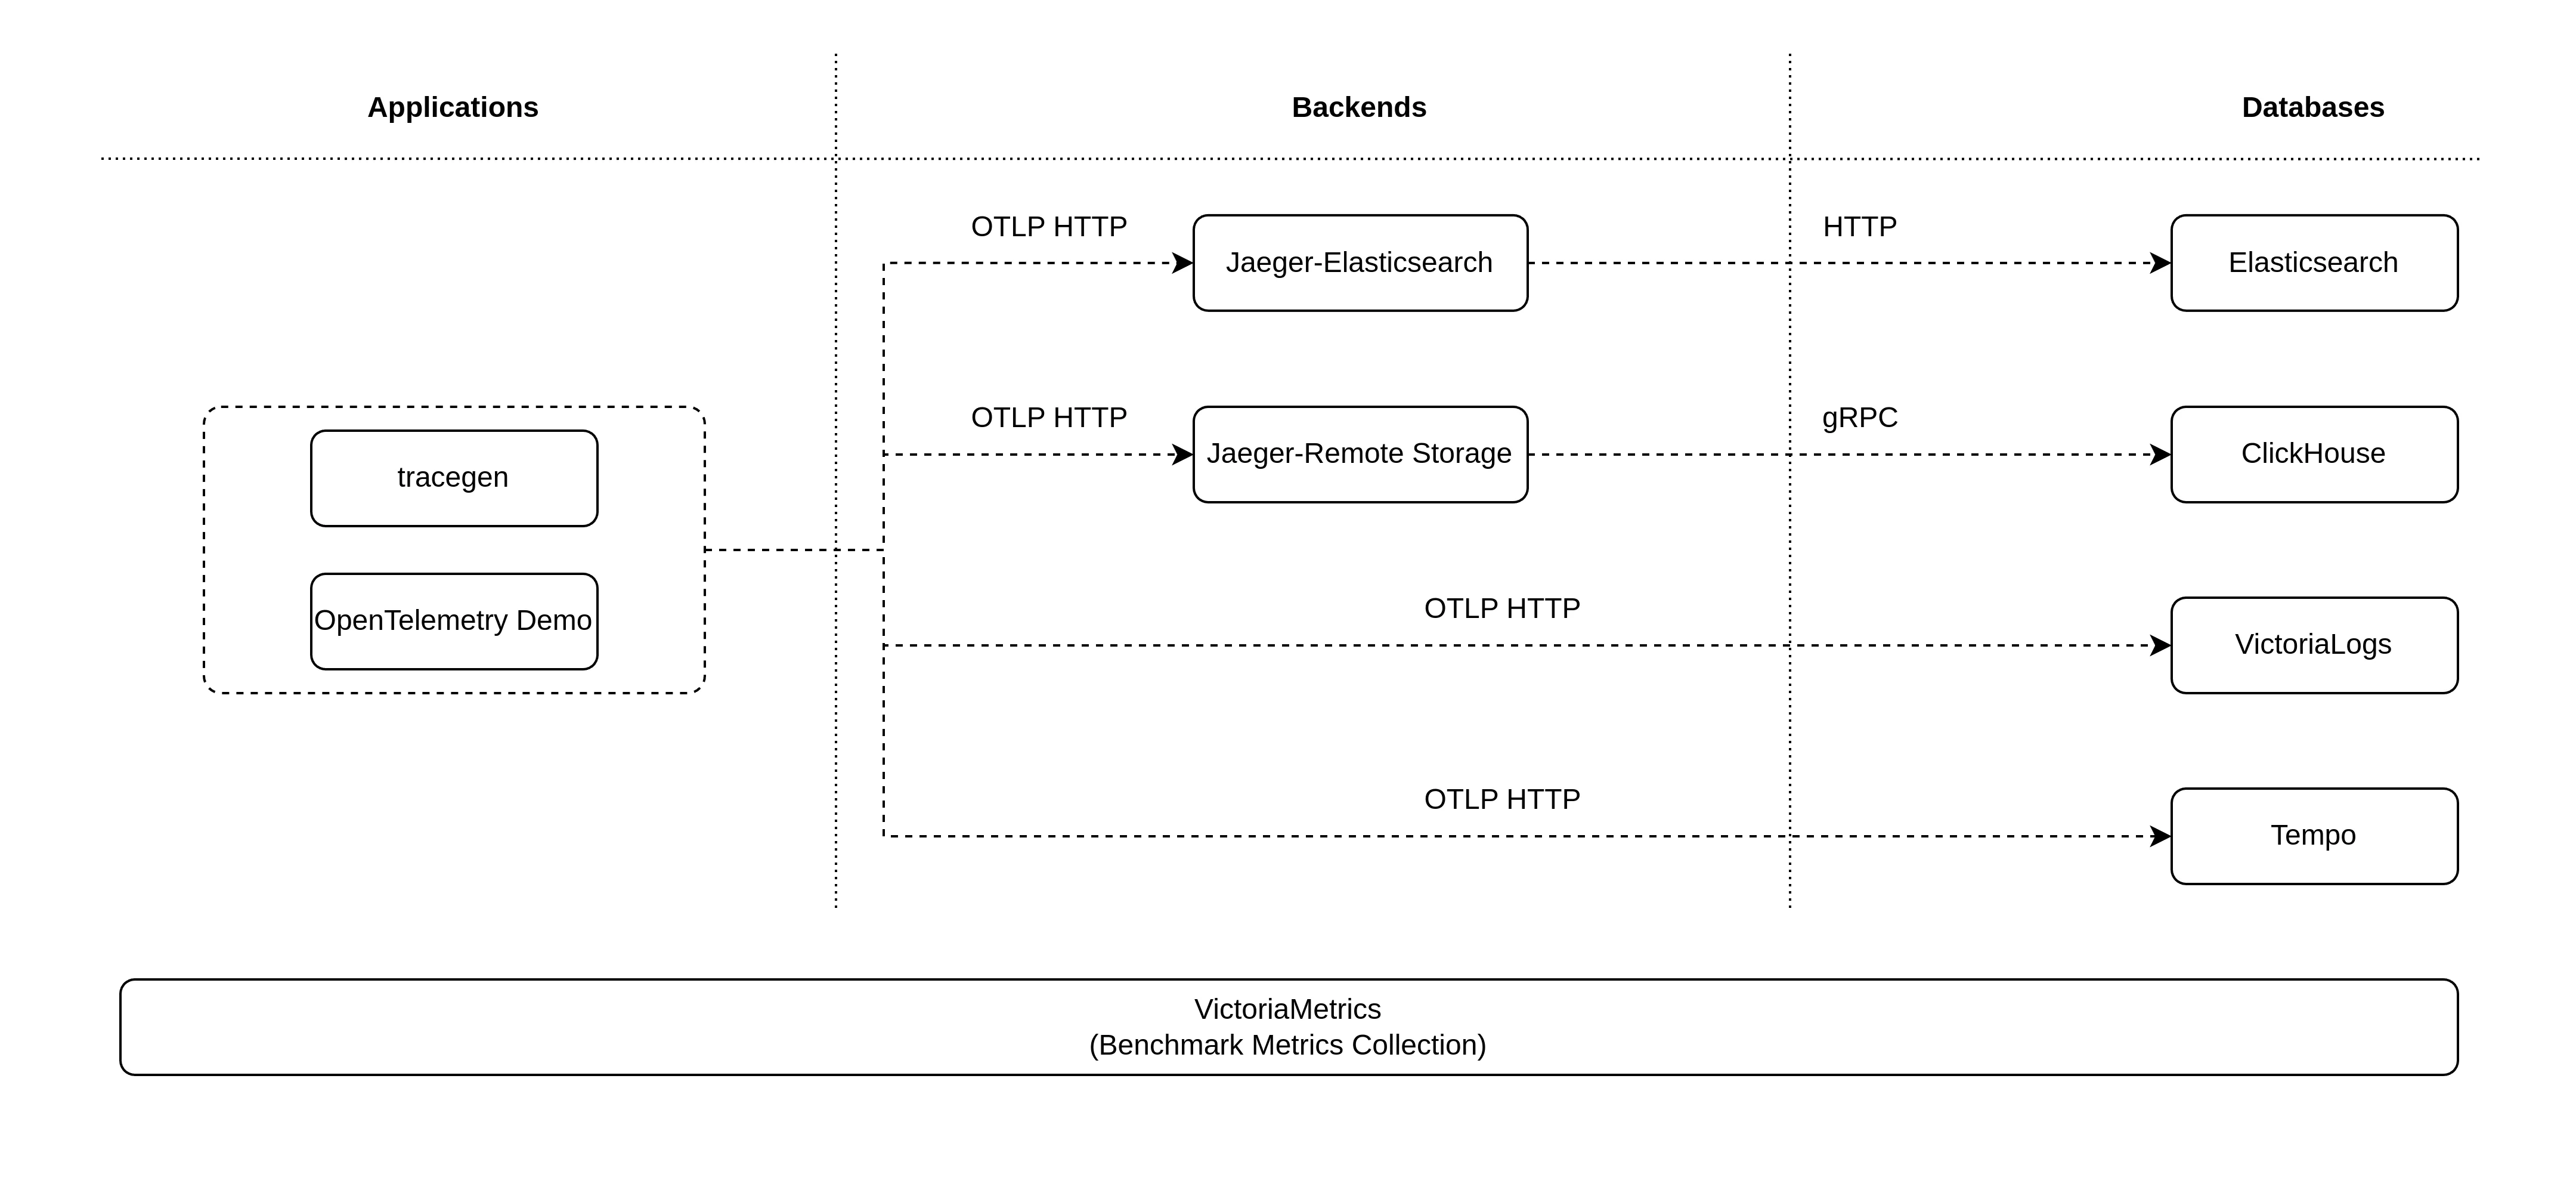 Benchmark architecture
To compare the hardware resource requirements of different solutions, we set the ingestion rate to 10,000 spans/s. The performance results are shown in the monitoring dashboard:
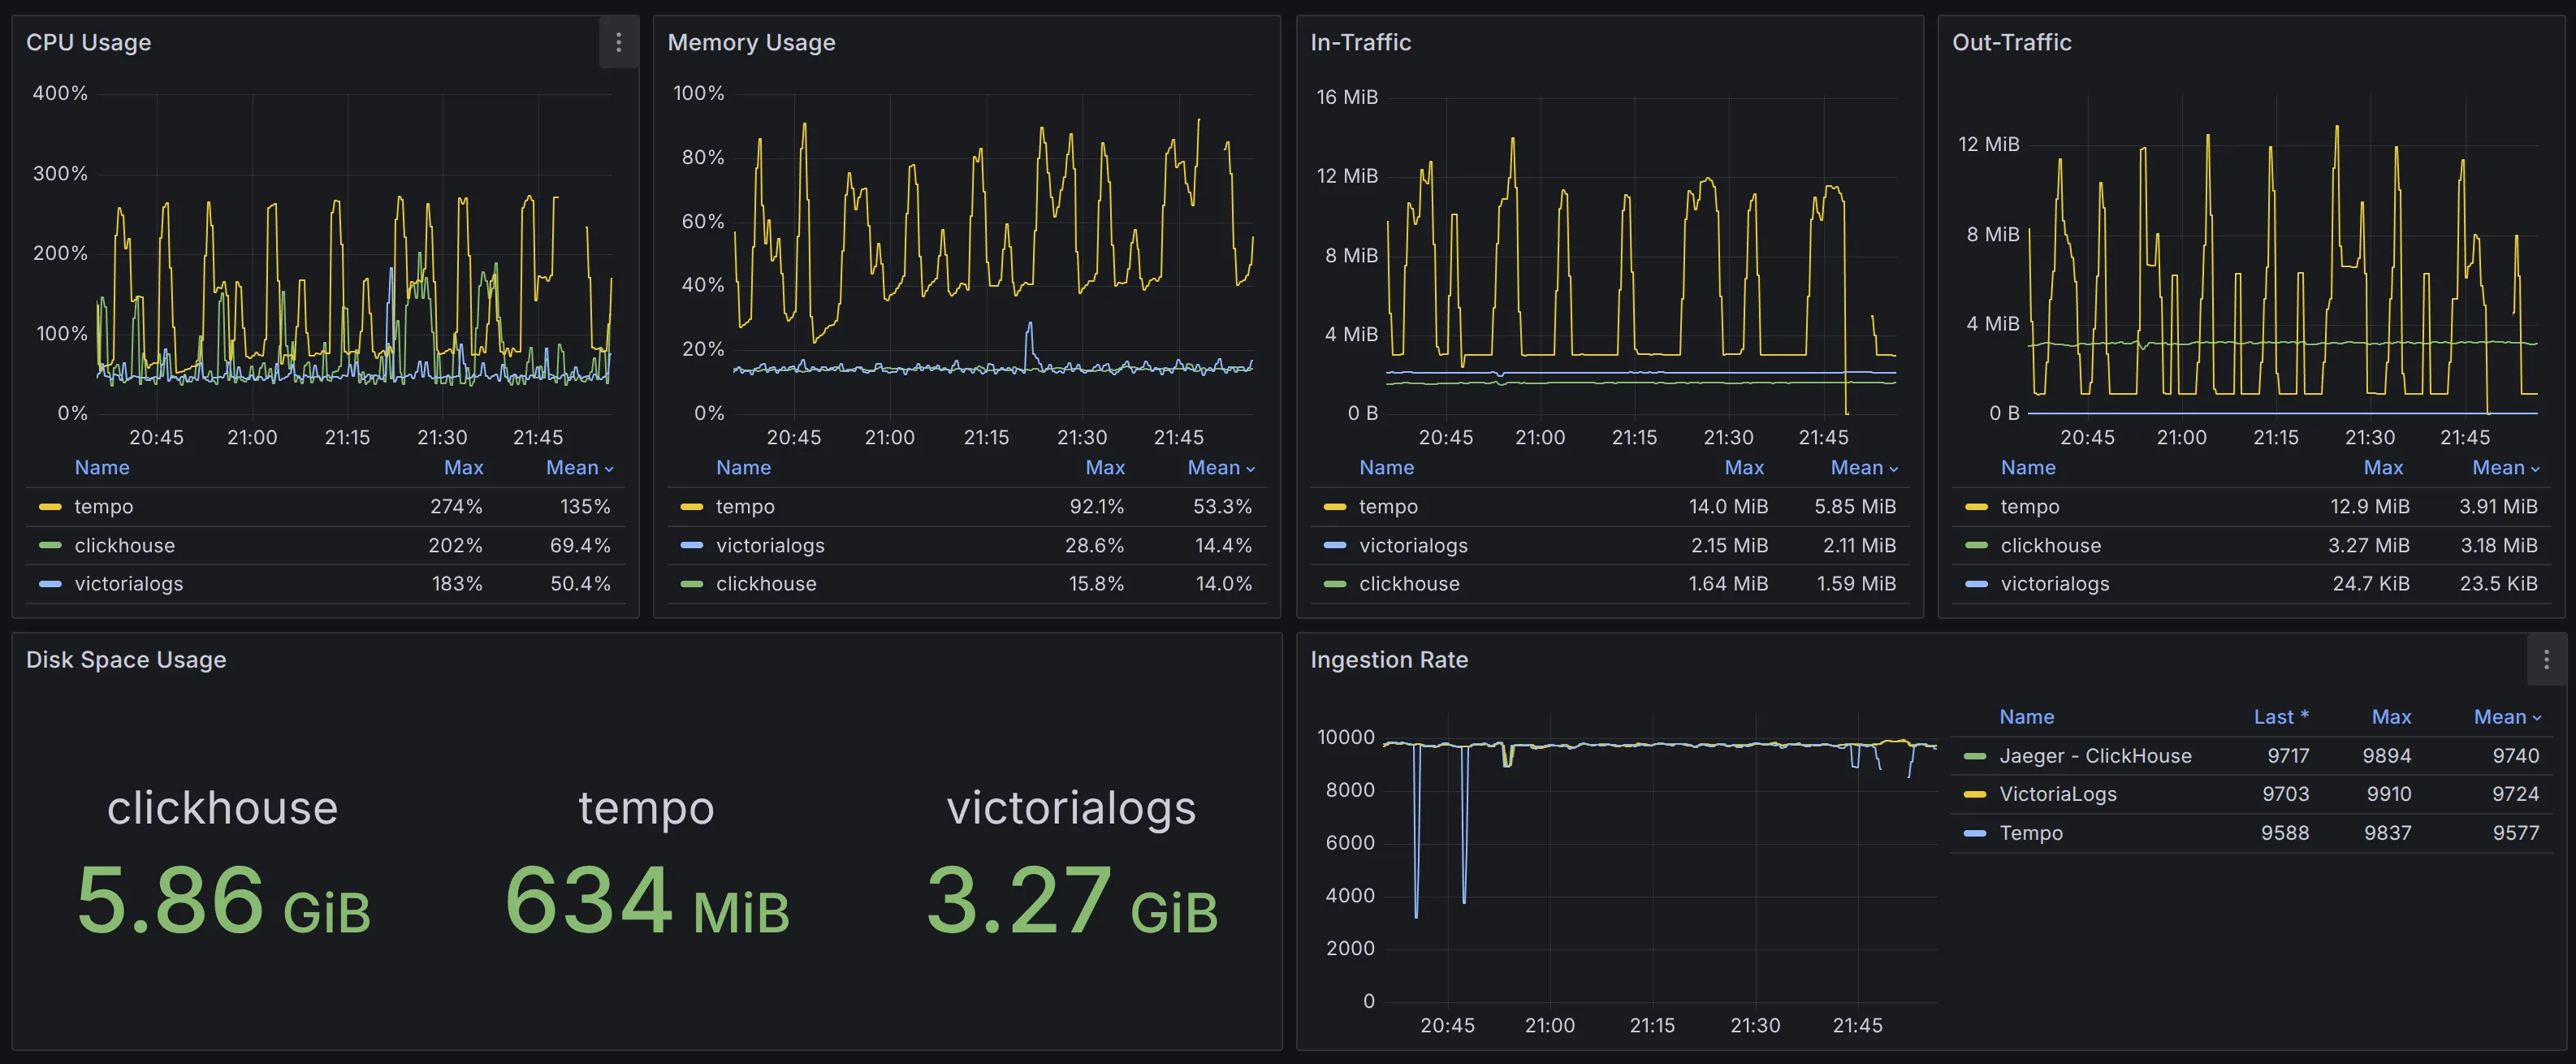 Benchmark result overview
The Elasticsearch-based solution began to crash at an ingestion rate as around 5,000 spans/s, and it couldn’t remain stable under higher loads with default settings. That’s why it’s excluded from the final comparison.
We conducted multiple benchmarks under different loads to ensure all competitors could run smoothly. If you’re interested in these more extreme benchmark cases, feel free to comment below or join our Slack channel for discussion.
In terms of CPU utilization, the result is: VictoriaLogs (0.50 vCPU) < ClickHouse (0.69 vCPU) < Tempo (1.35 vCPU). Meanwhile, CPU usage of ClickHouse and Tempo was more volatile.
When comparing only VictoriaLogs and ClickHouse, the CPU spike issue in ClickHouse becomes more noticeable as the load increases to 17,000 spans/s.
 Result #1 CPU
In terms of memory usage, ClickHouse (14%, 1.12 GiB) ≈ VictoriaLogs (14.4%, 1.15 GiB) < Tempo (53.3%, 4.26 GiB). Both VictoriaLogs and ClickHouse maintain stable memory usage. In contrast, Tempo uses over 4x more memory, with significant fluctuations, and ultimately runs into an out-of-memory issue.
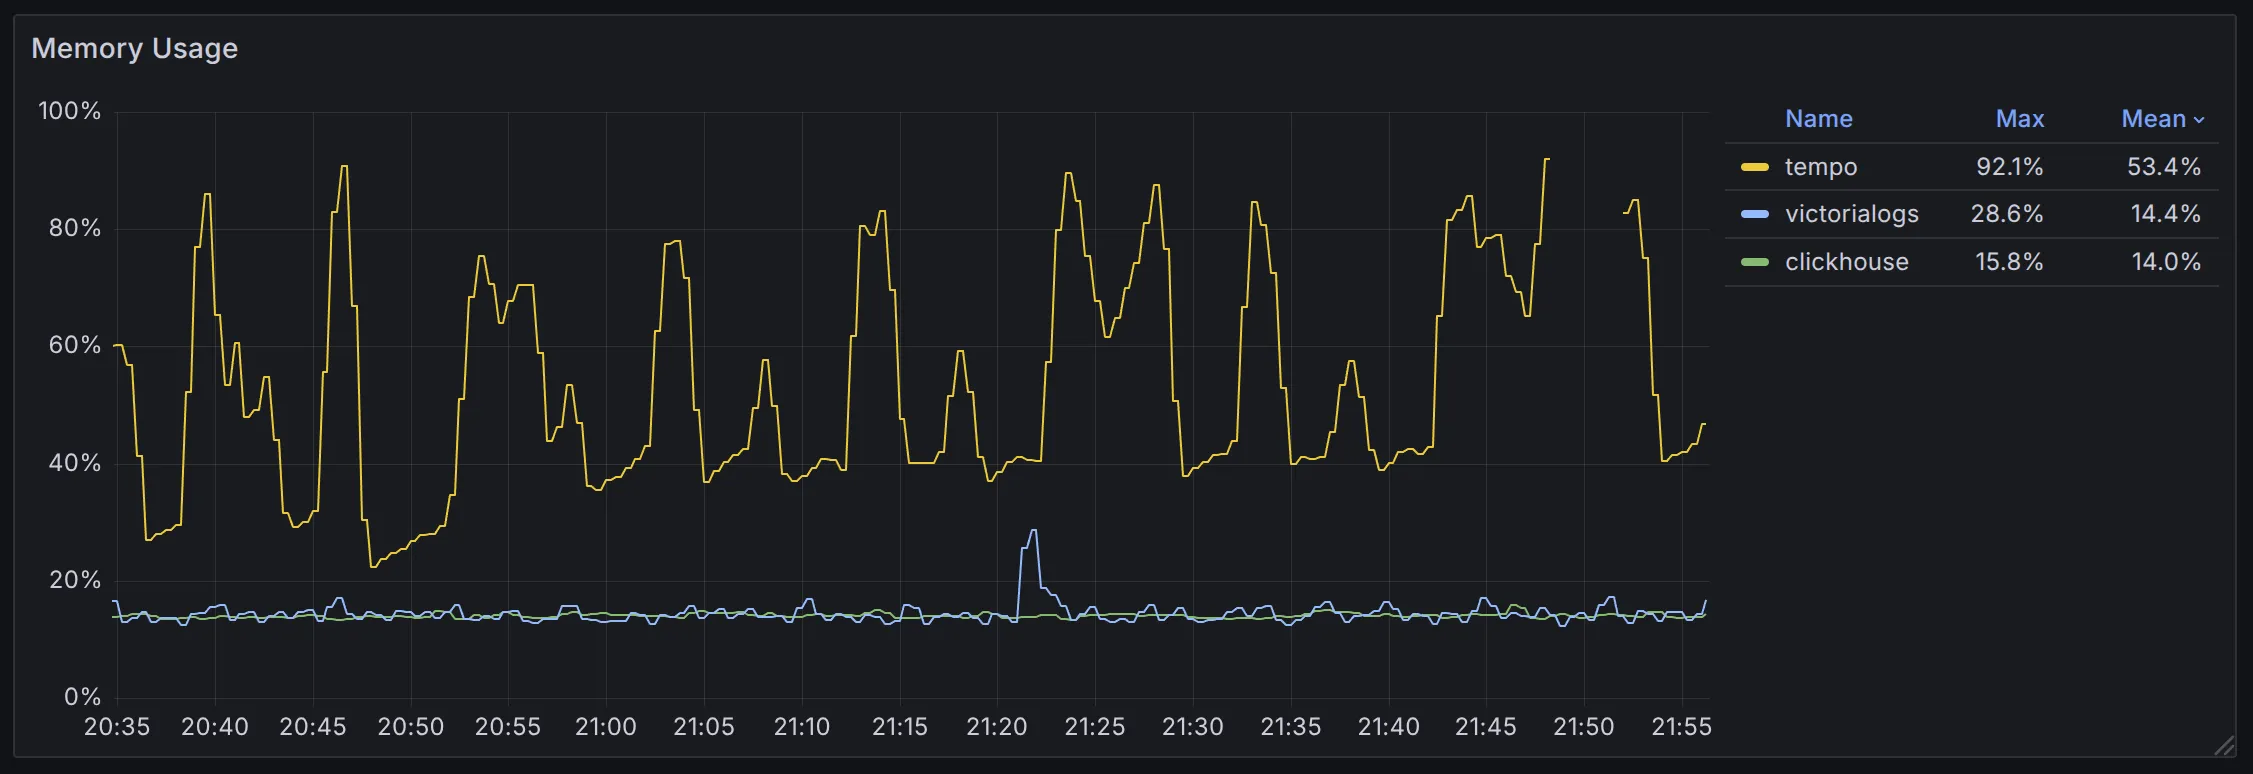 Result #2 memory
When it comes to data size within the same time range, VictoriaLogs (3.27 GiB) < ClickHouse (5.86 GiB). Tempo uses object storage, and according to cloud provider’s metrics, its data size is approximately 4.4 GiB but the scrape interval was 15 minutes, so it’s not accurate enough. To improve accuracy, we re-ran the benchmark using Tempo with local disk storage:
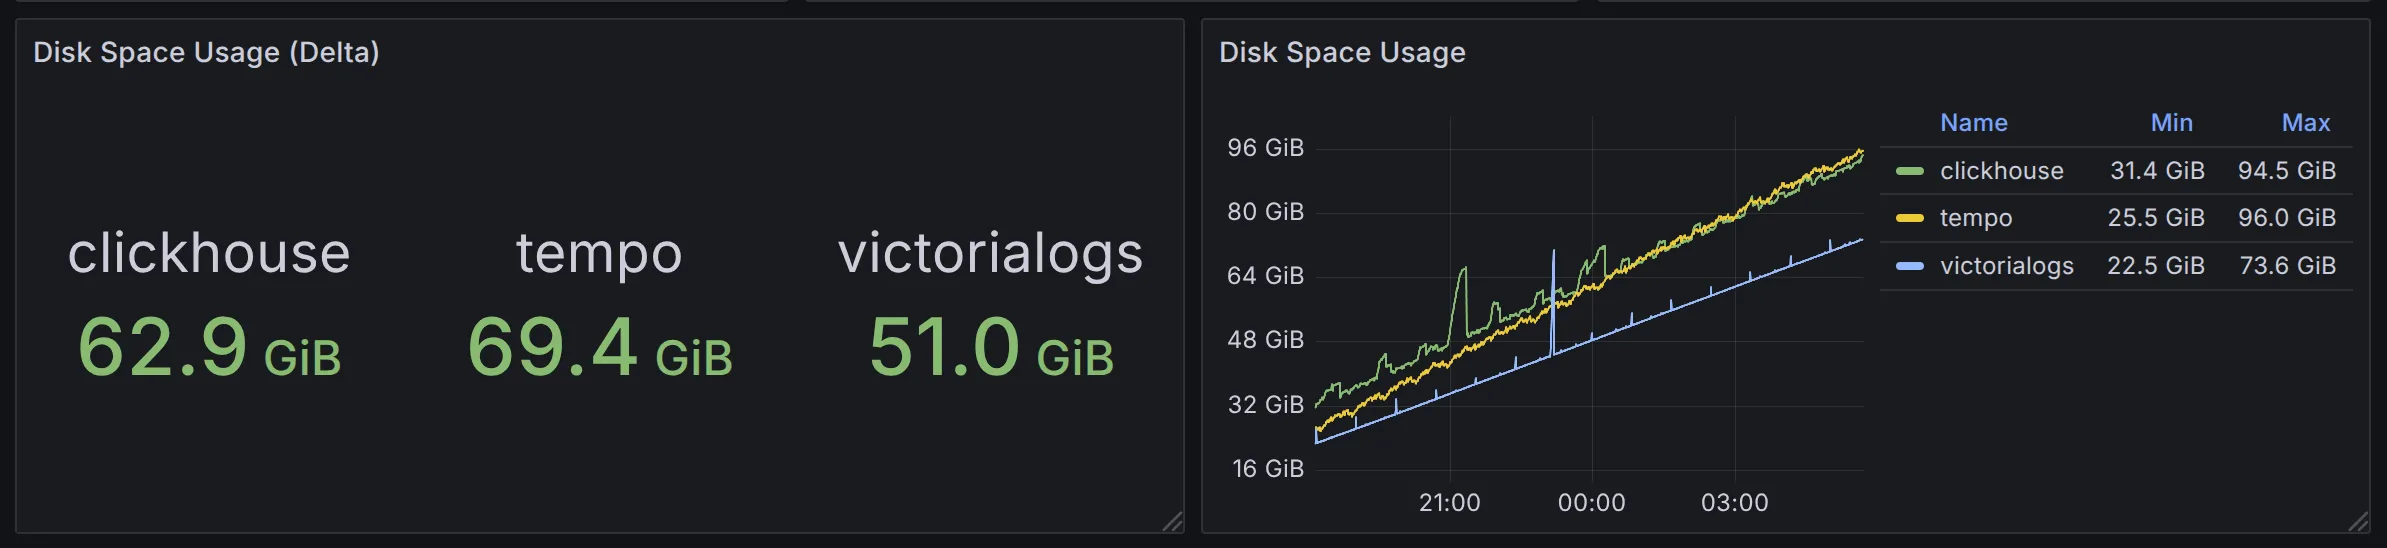 Result #3 disk space
Although Tempo’s object storage delivers cost advantages, its compression efficiency lags behind VictoriaLogs and ClickHouse. Also, VictoriaLogs is going to provide support for object storage in the future, which will further sharpen its edge.
Did you notice the differences in input/output traffic across the various solutions? What caused these differences? Here are a couple of hints to consider:
Below is a summary of resource comparisons across solutions under the same load, using VictoriaLogs as the benchmark:
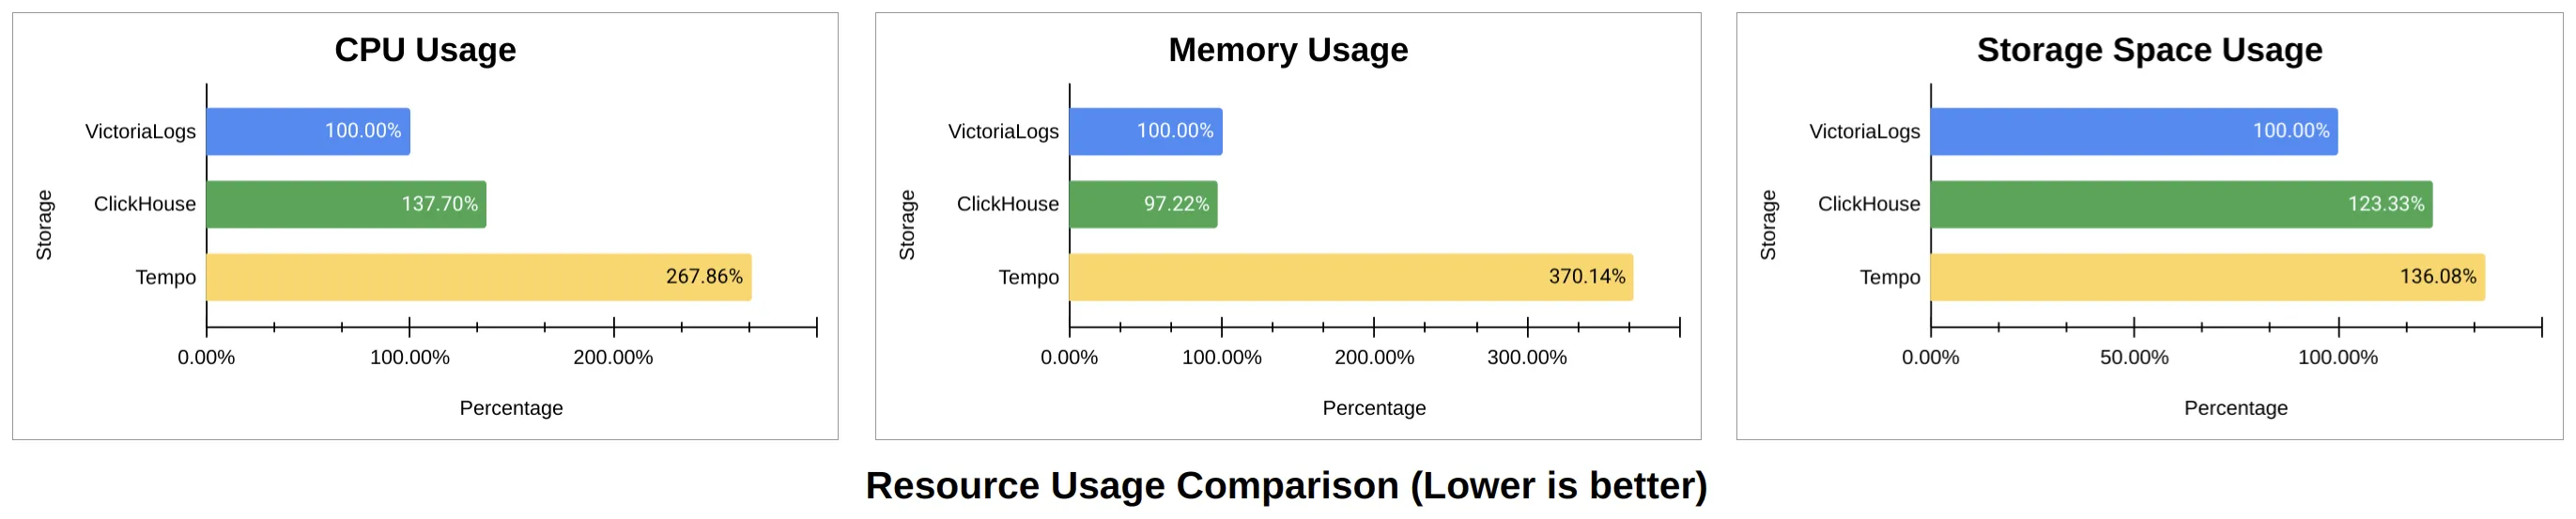 Benchmark summary
The popular OpenTelemetry standard in the industry only defines the OTLP protocol for data transmission, but there is no clear standard for querying or visualizing trace data. As a result, projects like Jaeger and Tempo have each implemented their own query APIs.
Currently, VictoriaLogs does not offer a built-in trace visualization solution. However, to verify whether VictoriaLogs’ query language LogsQL can cover all scenarios required for trace display, we attempted to implement Jaeger’s APIs in VictoriaLogs.
We chose to implement Jaeger HTTP APIs in the proof of concept for two reasons:
Data visualization is essentially the reverse process of section 3, and it is not complicated.
During implementation, we found that the time range filter has the greatest impact on query performance. For example, when querying data with a specific trace_id (e.g., c3b94b884c236e1e7ae39e7ca3589d18), as VictoriaLogs doesn’t have trace_id index, it cannot determine the time range or number of spans associated with this trace_id. As a result, it must scan all data blocks that match the search criteria, most of which are irrelevant. Narrowing the time range to a specific window (e.g., 10 or 30 minutes) can significantly speed up queries.
Therefore, when using VictoriaLogs as trace storage, it is optimal to configure specific lookbehind windows. For example, setting metadata_lookbehind=3d ensures that only service names from the past 3 days are retrieved.
 Listing service names within lookbehind windows
Another example of optimization: When trace_id_lookbehind_step=7d is set, each lookup of trace spans by trace_id searches for data in 7-day increments. Once the relevant data is found within a given interval, the search stops and does not proceed to the next.
After implementing Jaeger APIs, VictoriaLogs can now be used with both the Jaeger UI and Grafana for querying. Its response latency is significantly shorter than Elasticsearch, demonstrating that VictoriaLogs is well-suited for scenarios requiring trace visualization.
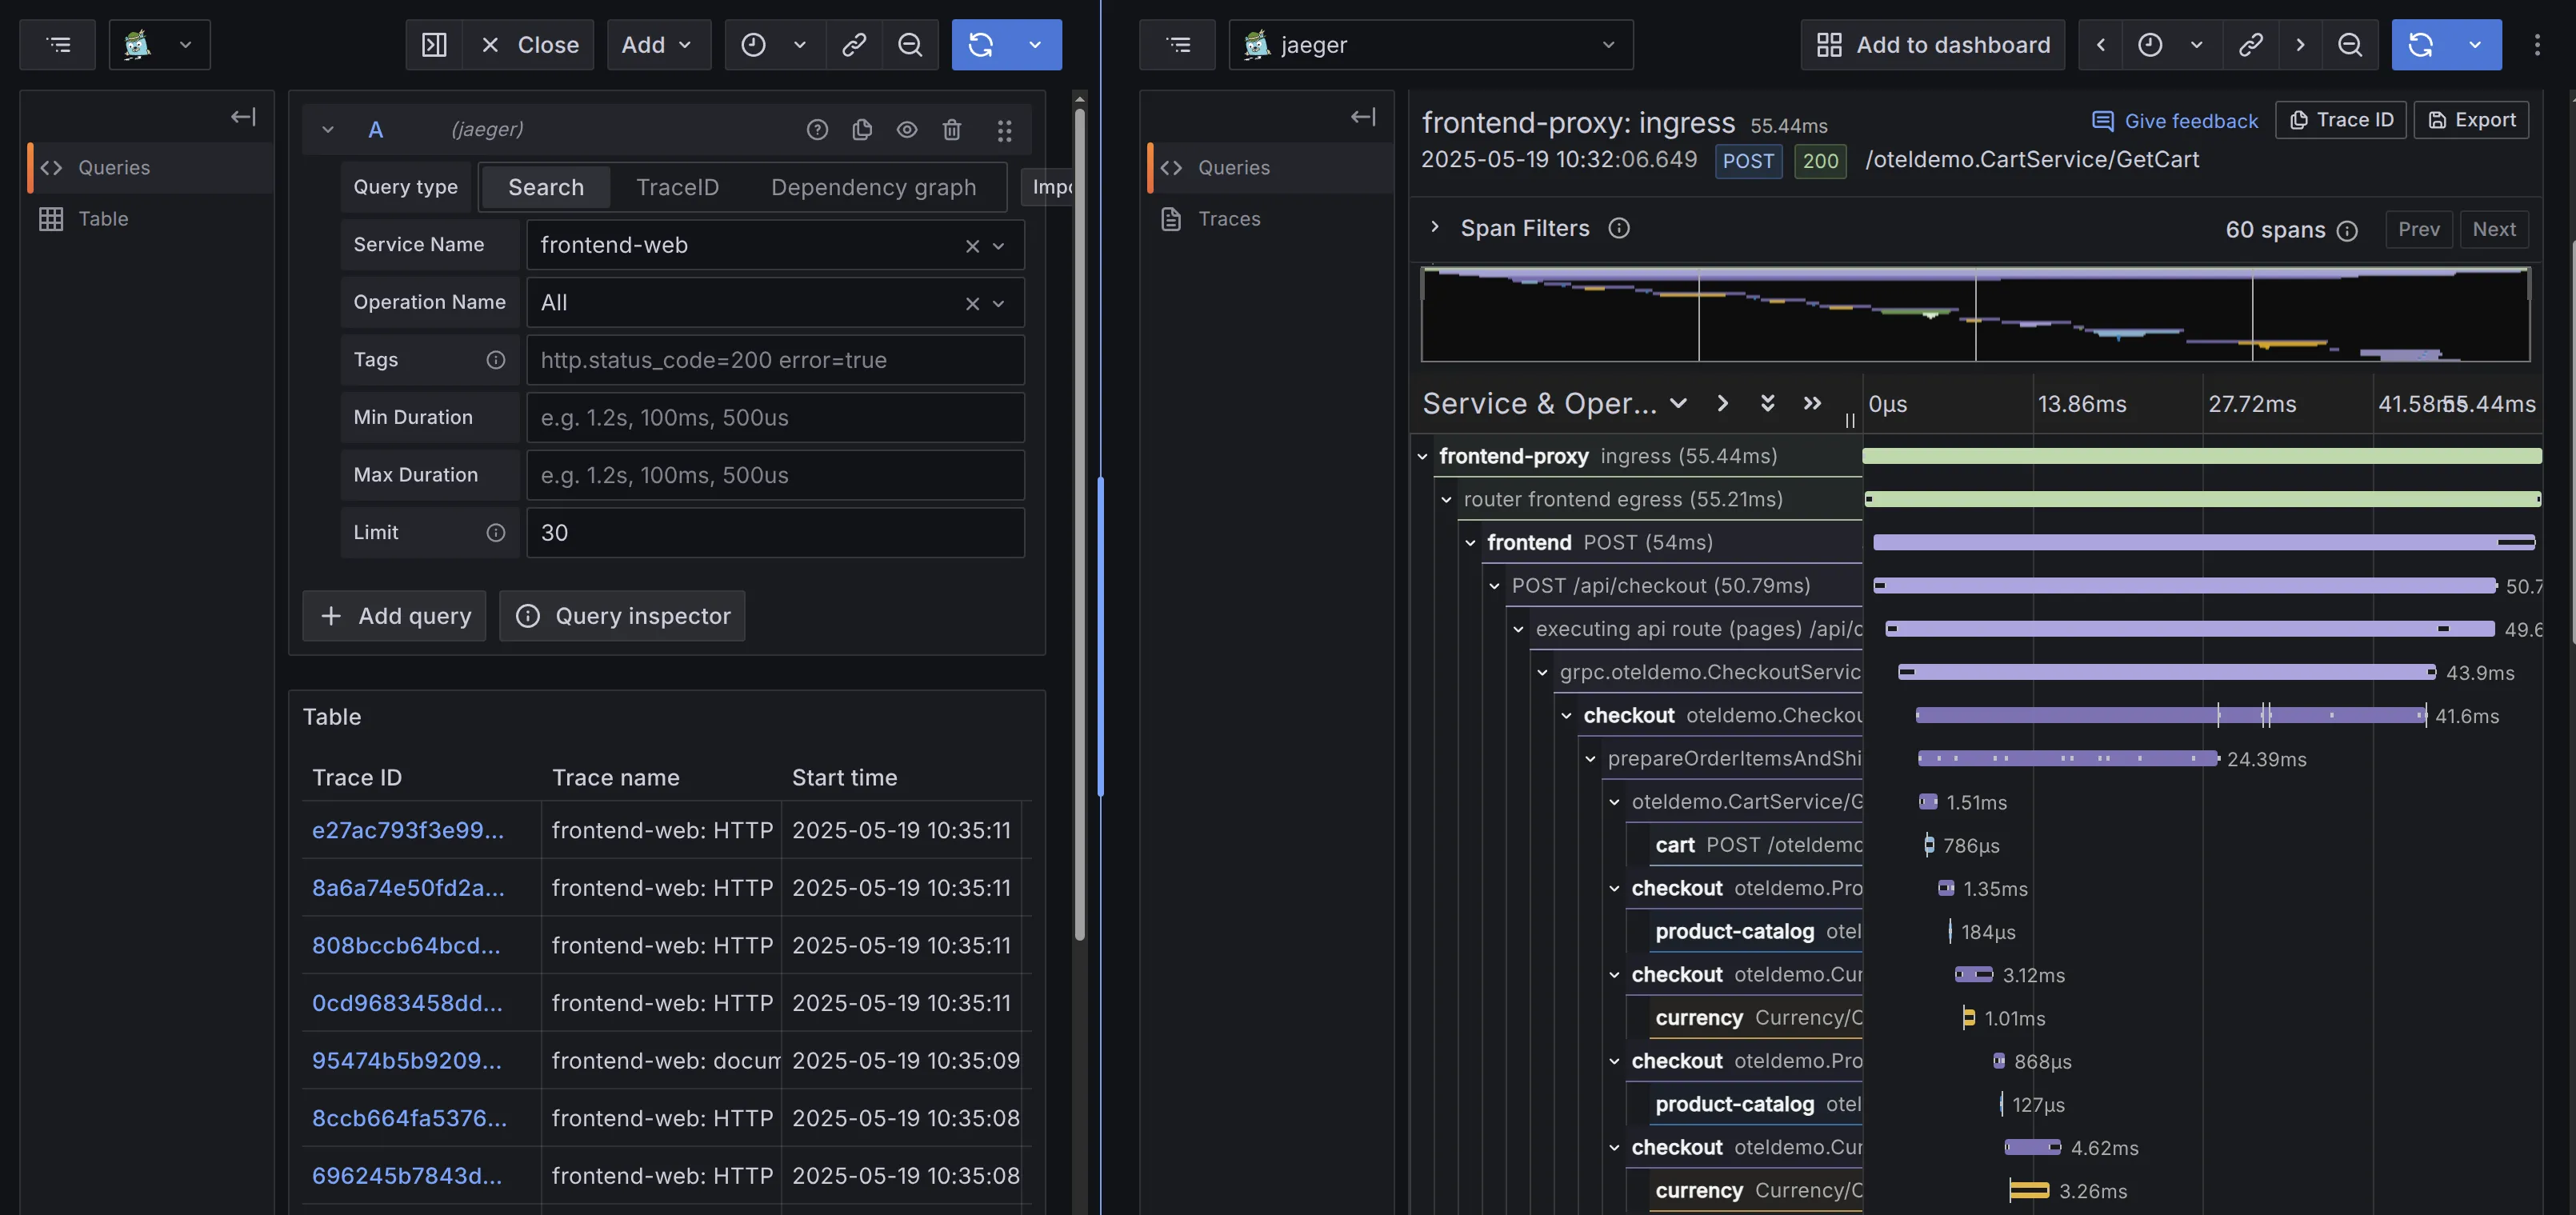 Use VictoriaLogs as Grafana Jaeger datasource
Do you like this Grafana Jaeger data source UI? Personally, I find it more user-friendly than the native Jaeger UI!
We aim to address the following questions by this blog post:
We believe the first four questions have been addressed in the previous sections.
As for the last one—Do we still need VictoriaTraces?—we haven’t started developing it as a standalone solution yet. Well, when VictoriaTraces is released, it will undoubtedly share a lot of code with VictoriaLogs. Running VictoriaTraces on top of VictoriaLogs also sounds like a promising direction. And unlike VictoriaMetrics, object storage support for VictoriaLogs is already on our roadmap, and we believe VictoriaTraces over VictoriaLogs will benefit from this.
Given the lack of robust implementations for many tools in the distributed tracing ecosystem, there may also be value in developing sampling-related tools—perhaps something like vtagent.
Currently, we actively seek user feedback on this functionality. Our primary goal is to provide a high-performance, low-cost solution with a simple and scalable architecture to users. Everything else comes second.
In current benchmark, VictoriaLogs can support an ingestion rate of 30,000 spans/s with an average CPU usage of 1.2 cores (peak 2.6 cores). Since we haven’t started profiling or optimization yet, we expect even better performance in the official release.
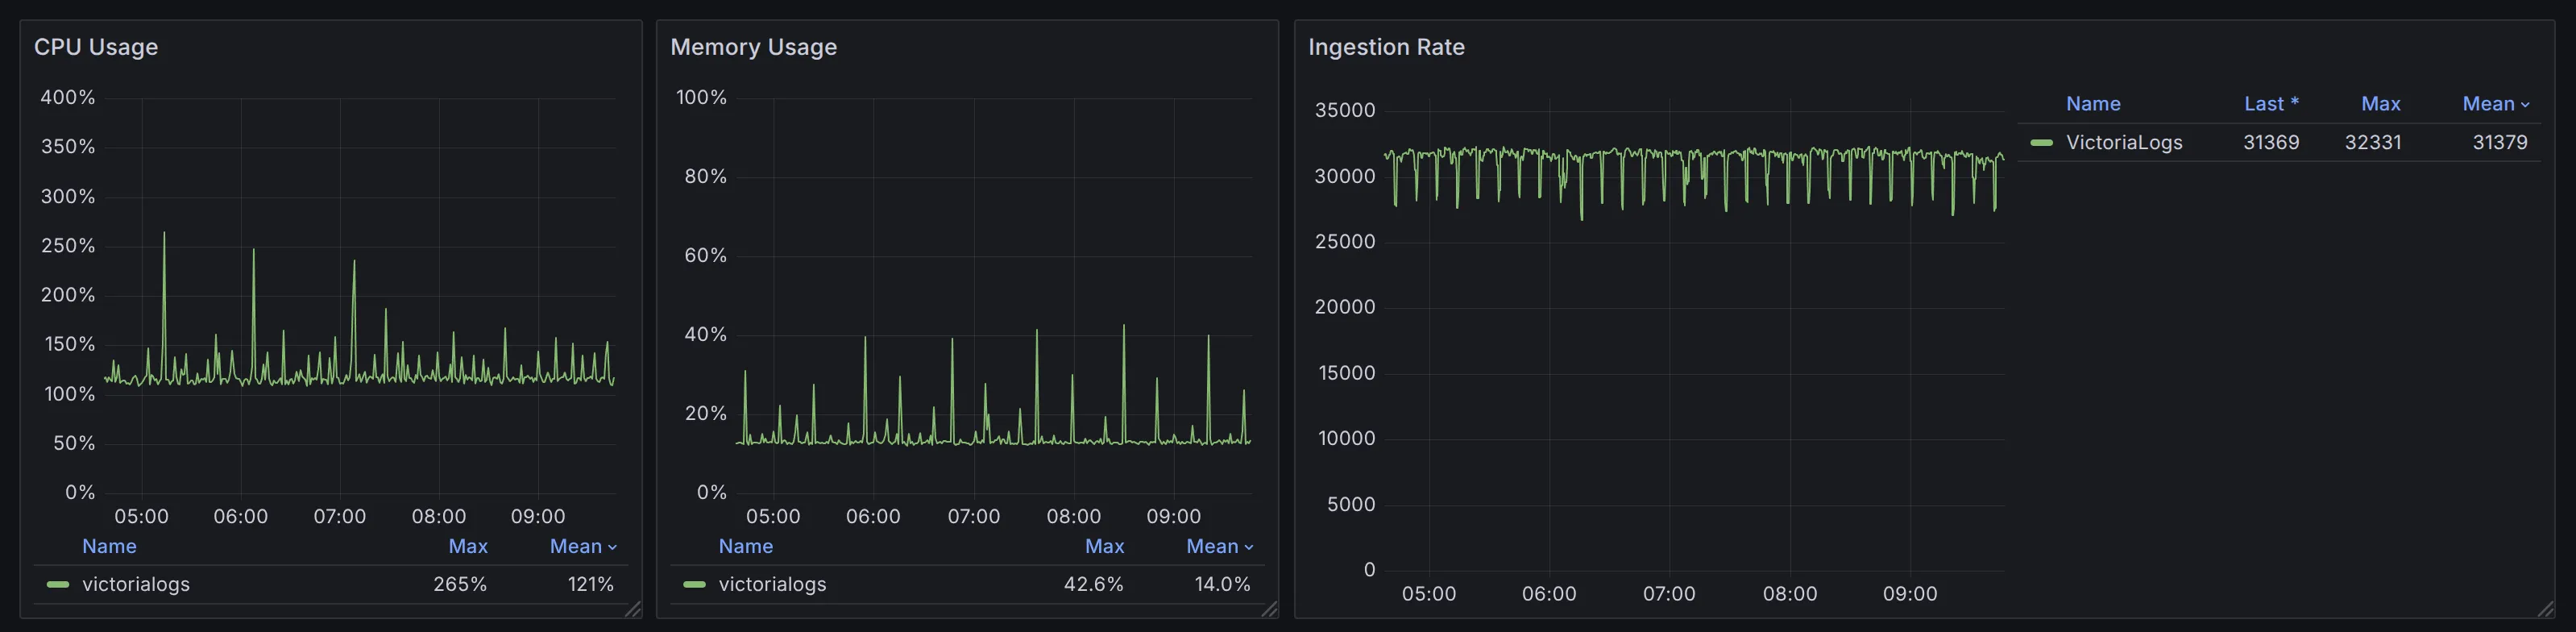 Resource usage at 30k spans/s
If you can’t wait to try out this “toy”, check out the demo here.
If you think this feature could replace your existing trace storage and want to test it immediately, or if it’s not suitable for any reason, please share your thoughts via comments, GitHub issue, or our Slack channel. The VictoriaMetrics team values your feedback!
A couple of months ago, I tried to implement VictoriaLogs as Jaeger’s gRPC remote storage. Due to various factors, the resource overhead was pretty bad (10x that of ClickHouse). At the time, I concluded that while VictoriaLogs could store and query trace spans, it was not competitive, and I planned to stop pursuing it.
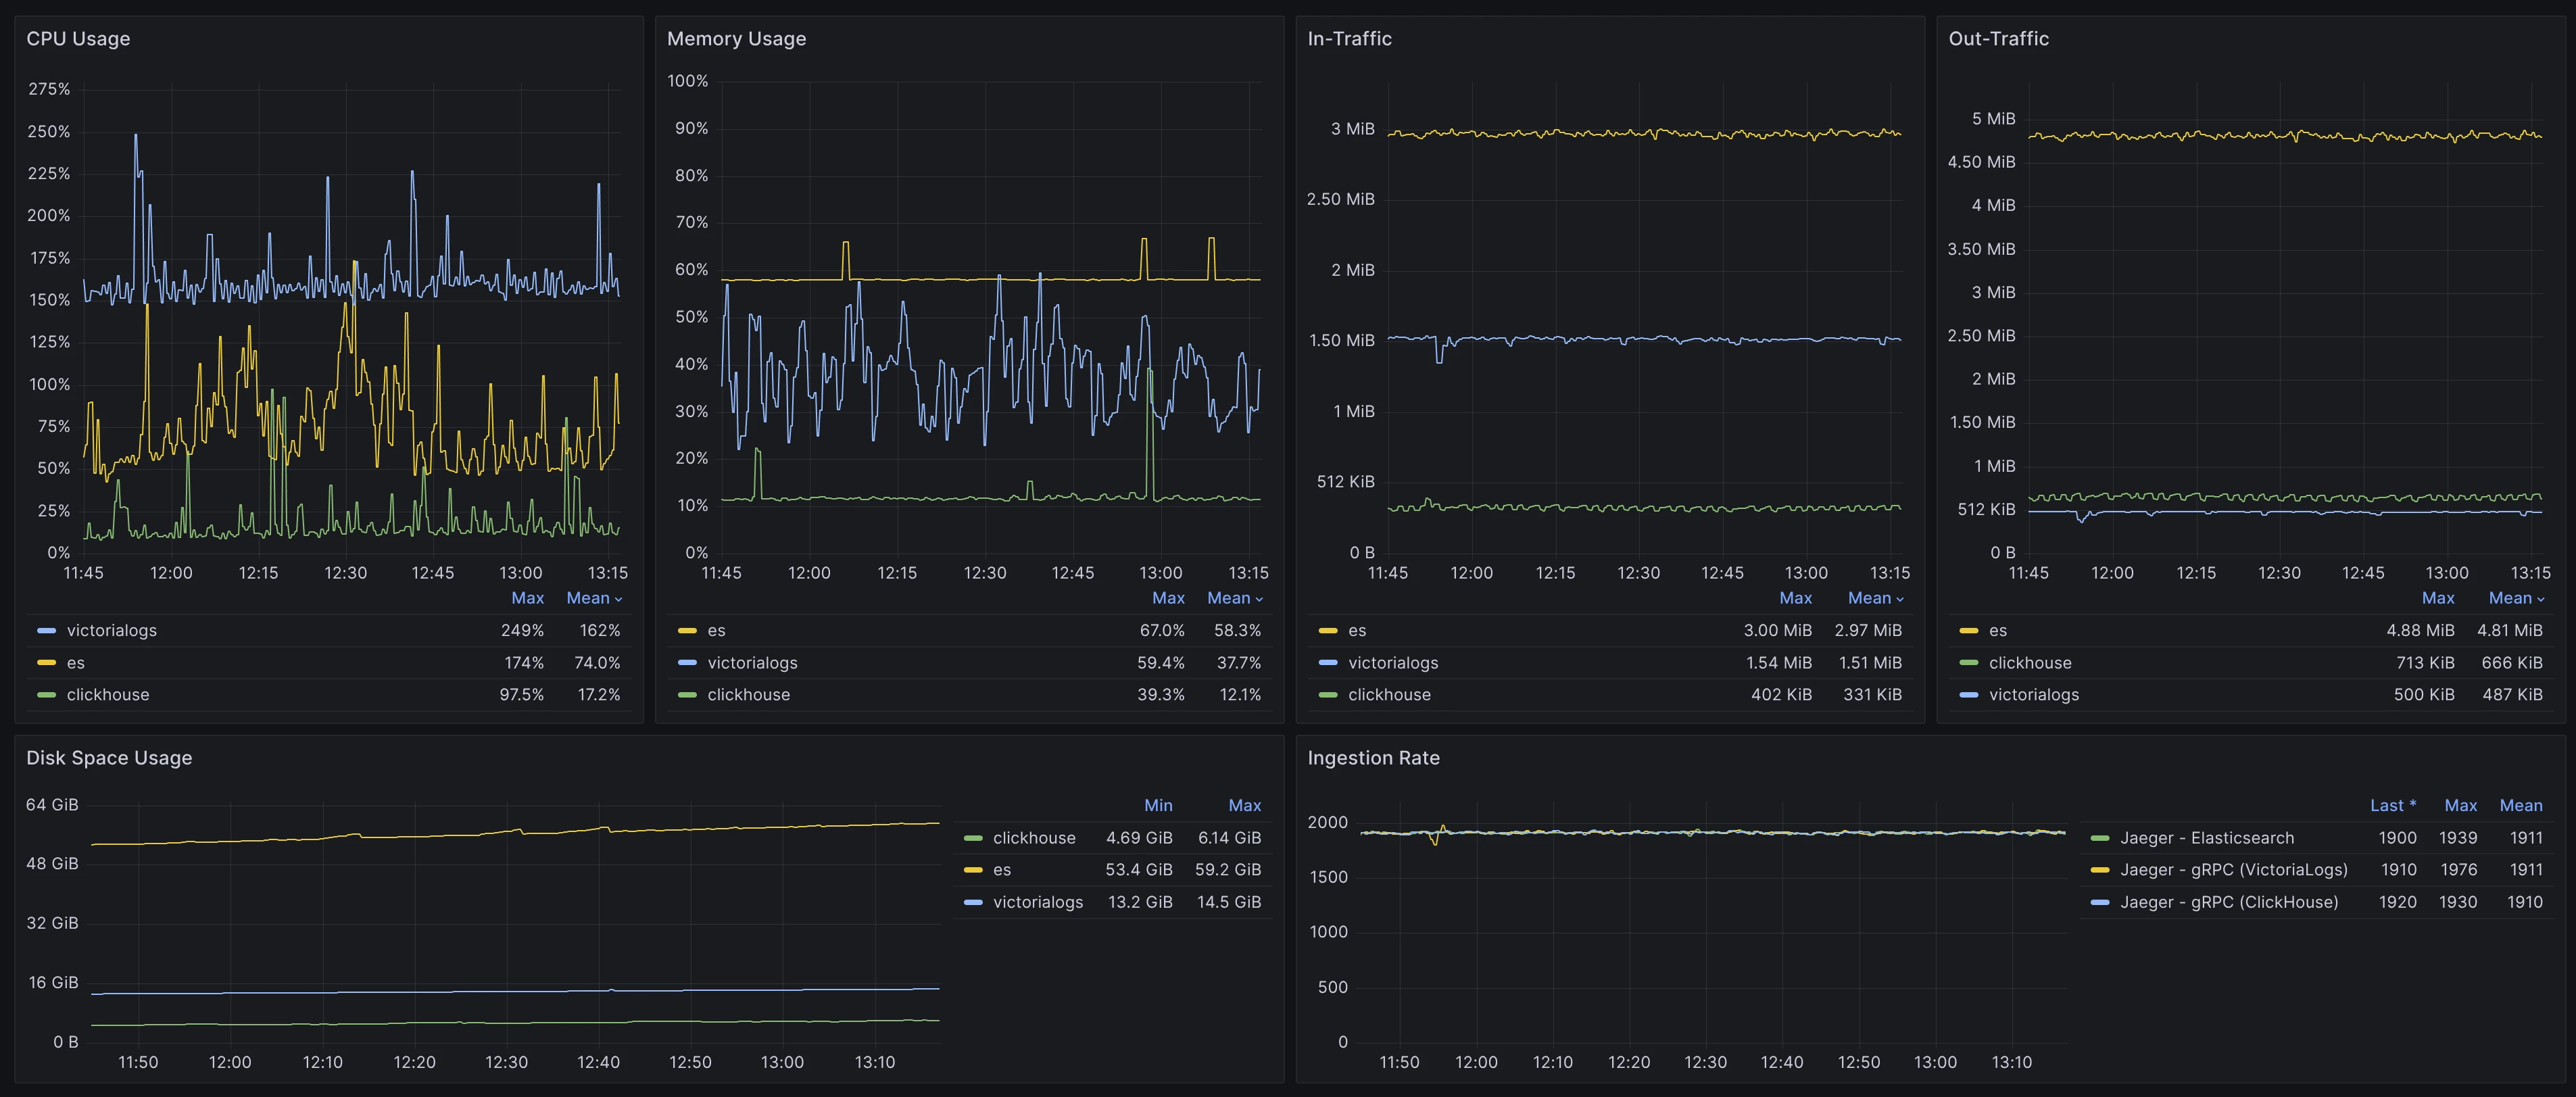 Poor resource overhead
But then @hagen1778 encouraged me not to give up too soon and offered many insightful suggestions. I also had a similar discussion with @valyala, and found helpful techniques in the code from @AndrewChubatiuk and other colleagues. Thanks to these experienced engineers, the project took a much more promising turn.
此内容由惯性聚合(RSS阅读器)自动聚合整理,仅供阅读参考。 原文来自 — 版权归原作者所有。