


惯性聚合 高效追踪和阅读你感兴趣的博客、新闻、科技资讯
阅读原文 在惯性聚合中打开

推荐订阅源

N
News and Events Feed by Topic
OSCHINA 社区最新新闻
OSCHINA 社区最新新闻
Hugging Face - Blog
Hugging Face - Blog
S
SegmentFault 最新的问题
IT之家
IT之家
M
MIT News - Artificial intelligence
博客园_首页
aimingoo的专栏
aimingoo的专栏
C
Check Point Blog
B
Blog
人人都是产品经理
人人都是产品经理
爱范儿
爱范儿
宝玉的分享
宝玉的分享
Martin Fowler
Martin Fowler
L
LangChain Blog
Last Week in AI
Last Week in AI
Engineering at Meta
Engineering at Meta
Microsoft Security Blog
cs.CV updates on arXiv.org
F
Fortinet All Blogs
罗磊的独立博客
博客园 - 叶小钗
H
Help Net Security
Google Online Security Blog
Application and Cybersecurity Blog
The Last Watchdog
The Last Watchdog
S
Security @ Cisco Blogs
Google DeepMind News
Cyberwarzone
Cyberwarzone
月光博客
月光博客
C
Cybersecurity and Infrastructure Security Agency CISA
博客园 - 司徒正美
S
Schneier on Security
V
Vulnerabilities – Threatpost
T
Troy Hunt's Blog
cs.CL updates on arXiv.org
博客园 - 【当耐特】
K
KPMG report finds enterprise disconnect between AI and its ROI | CIO
Forbes - Security
Forbes - Security
D
Darknet – Hacking Tools, Hacker News & Cyber Security
雷峰网
雷峰网
Hacker News - Newest:
Hacker News - Newest: "LLM"
S
Secure Thoughts
V
Visual Studio Blog
钛媒体:引领未来商业与生活新知
钛媒体:引领未来商业与生活新知
云风的 BLOG
云风的 BLOG
T
Tailwind CSS Blog
Security Archives - TechRepublic
Hacker News: Ask HN
Hacker News: Ask HN
The GitHub Blog
The GitHub Blog

VictoriaMetrics: Simple & Reliable Monitoring for Everyone on VictoriaMetrics

Operator now has Long-Term Support (LTS) version Multi-tiered Observability: A Practical Way to Handle Diverse Workloads VictoriaMetrics April 2026 Ecosystem Updates Not All Telemetry Requires Premium Pricing VictoriaMetrics at KubeCon Amsterdam: Community Highlights What's new in VictoriaMetrics Anomaly Detection (Q1 2026) What's New in VictoriaMetrics Cloud Q1 2026? Logs, MCP Server, Better Alerting, and... a Secret Project VictoriaMetrics at KubeCon: Optimizing Tail Sampling in OpenTelemetry with Retroactive Sampling VictoriaMetrics March 2026 Ecosystem Updates Observability Lessons From OpenAI Benchmarking Kubernetes Log Collectors: vlagent, Vector, Fluent Bit, OpenTelemetry Collector, and more VictoriaMetrics February 2026 Ecosystem Updates VictoriaMetrics at FOSDEM, Cloud Native Days France, and CfgMgmtCamp Ghent VictoriaLogs in VictoriaMetrics Cloud: Fast, Cost-Effective Log Management is Here What’s new in VictoriaMetrics Anomaly Detection (2025) VictoriaMetrics January 2026 Ecosystem Updates VictoriaLogs Basics: What You Need to Know, with Examples & Visuals What's New in VictoriaMetrics Cloud Q4 2025? New tiers, more deployment options, IaC and alerting rules. Vibe coding tools observability with VictoriaMetrics Stack and OpenTelemetry How a US Software Provider Improved Traffic Alerting with VictoriaMetrics Anomaly Detection VictoriaMetrics 2025 Developer Experience: A Year in Review Spotify’s performance & control across large monitoring environments with VictoriaMetrics VictoriaMetrics Achieves Red Hat OpenShift Operator Certification Our latest updates across the VictoriaMetrics Observability ecosystem New Capacity Tiers in VictoriaMetrics Cloud Announcing 1B+ Downloads & Product Development With Logs, Traces, Metrics AI Agents Observability with OpenTelemetry and the VictoriaMetrics Stack Discarding gRPC-Go: The Story Behind OTLP/gRPC Support in VictoriaTraces How DreamHost Slashed Memory Usage by 80% and Scaled to 76 Million Time Series Upcoming Conferences & Meetups: Where to Meet Our Team VictoriaMetrics Long-Term Support (LTS): H2 2025 Update Creating a Sustainable Open Source Business Model - Introduction Full-Stack Observability with VictoriaMetrics in the OTel Demo Alerting Best Practices vmanomaly Deep Dive: Smarter Alerting with AI (Tech Talk Companion) VictoriaLogs Practical Ingestion Guide for Message, Time and Streams Monotonic and Wall Clock Time in the Go time package Hello Singapore! VictoriaMetrics Cloud Expands to Asia Pacific MCP Server Integration & Much More: What's New in VictoriaMetrics Cloud Q2 2025 FIPS 140-3 Compatible Builds for VictoriaMetrics Enterprise Components VictoriaLogs Unleashed: Cluster Version Now Available for Exceptional, Linear Scaling Integrations made easy with VictoriaMetrics Cloud Developer's Note: Research on Distributed Tracing, Comparing With Tempo and ClickHouse vmagent: Key Features Explained in Under 15 Minutes Go synctest: Solving Flaky Tests vmalert: Maximize Your Monitoring (Tech Talk Companion) Celebrating 14K Stars on GitHub: Spring Update vmalert: Maximize Your Monitoring VictoriaMetrics Connects with the Open Source Community at LinuxFest Northwest 2025 Graceful Shutdown in Go: Practical Patterns VictoriaLogs: Gaps, Gains & Growth Prometheus Monitoring: Functions, Subqueries, Operators, and Modifiers VictoriaMetrics Cloud: What's New in Q1 2025? Don’t default to microservices: You’ll thank us later! Container CPU Requests & Limits Explained with GOMAXPROCS Tuning gRPC in Go: Streaming RPCs, Interceptors, and Metadata From Chaos to Clarity with VictoriaLogs Prometheus Alerting 101: Rules, Recording Rules, and Alertmanager Heading to London: Meet Our Team at KubeCon Europe 2025 Inside vmselect: The Query Processing Engine of VictoriaMetrics Meet Our Team at Scale 22x Practical Protobuf - From Basic to Best Practices VictoriaLogs Status Update: Heading Towards the Cluster Version 24th of February 2025 Statement: VictoriaMetrics Stands with Ukraine! Prometheus Metrics Explained: Counters, Gauges, Histograms & Summaries Prometheus Monitoring: Instant Queries and Range Queries Explained 300%+ Growth in 2024: Join Our Team in 2025! FOSDEM 2025 recap How Protobuf Works—The Art of Data Encoding OpenTelemetry, Prometheus, and More: Which Is Better for Metrics Collection and Propagation? How vmstorage Handles Query Requests From vmselect How vmstorage's IndexDB Works VictoriaMetrics Tech Talk Stream: A Deep Dive into Blackbox Monitoring How HTTP/2 Works and How to Enable It in Go VictoriaMetrics Cloud: What's New in Q4 2024? How vmstorage Processes Data: Retention, Merging, Deduplication,... How vmstorage Handles Data Ingestion From vminsert When Metrics Meet vminsert: A Data-Delivery Story From net/rpc to gRPC in Go Applications VictoriaMetrics helps IHI Terrasun Win Big in Vegas on $1.2B Clean Energy Project Piros | VictoriaMetrics Partner Allenta | VictoriaMetrics Partner CloudRaft | VictoriaMetrics Partner Sensedia & VictoriaMetrics: API-compatible Efficient Storage Scalable Prometheus: Why DSV Chose VictoriaMetrics Sensor Factory | VictoriaMetrics Partner Erythix | VictoriaMetrics Partner Groove X & VictoriaMetrics: Faster Device Health Monitoring Scaled & Performant Monitoring at Spotify with VictoriaMetrics Grammarly & VictoriaMetrics: 10× Lower Costs & Direct Access Zelarsoft | VictoriaMetrics Partner DFKI & VictoriaMetrics: Efficient Long-Term Metric Storage Niubits | VictoriaMetrics Partner Megazone Cloud | VictoriaMetrics Partner Cogito Software | VictoriaMetrics Partner Bajau | VictoriaMetrics Partner Find Out Why Dig Security Chose VictoriaMetrics! Ness | VictoriaMetrics Partner Alpha Data | VictoriaMetrics Partner SIOS Technology | VictoriaMetrics Partner
What's New in VictoriaMetrics Cloud Q3 2025? From new region in Asia to proactive alerts
Jose Gomez-Selles · 2025-10-07 · via VictoriaMetrics: Simple & Reliable Monitoring for Everyone on VictoriaMetrics

The third quarter of 2025 has been a busy one for VictoriaMetrics Cloud! We expanded globally, polished the user experience, introduced new enterprise debugging tools, and delivered smarter alerts to help users make the most of their observability data.

If you missed our Quarterly Live Update, don’t worry! You can watch the full recording here:

Let’s recap what’s new in VictoriaMetrics Cloud this quarter.

VictoriaMetrics Cloud Expands to Asia!

#

As recently announced, VictoriaMetrics Cloud is now available in Asia-Pacific (ap-southeast-1). This means faster performance and lower latency for users in the region, with the same reliability and scalability you already know from VictoriaMetrics Cloud.

Read the full announcement in our dedicated blog post or directly launch your VictoriaMetrics Cloud deployment:
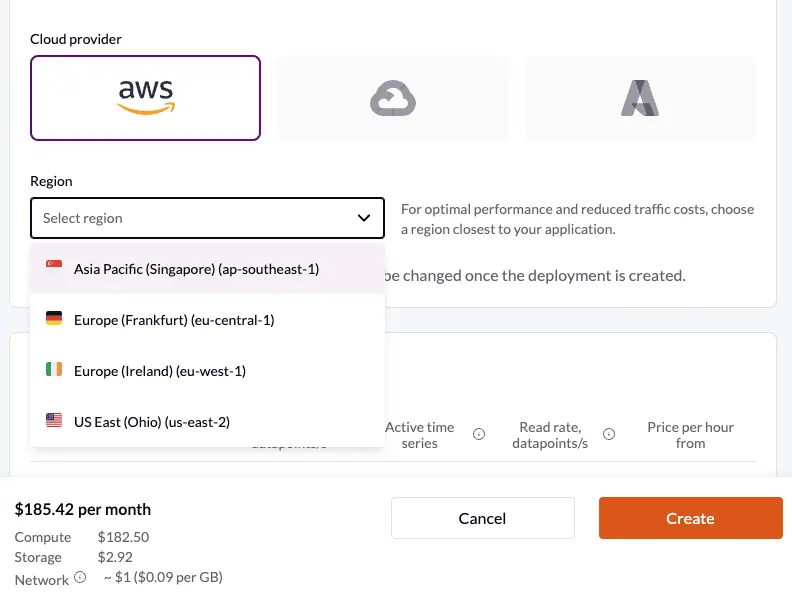
This is important for our users that have infrastructure, applications, (or even their own users!) in Asia. We’ve just removed unnecessary network round-trips and data transit overheads, helping:

  • Metrics ingestion and query responsiveness
  • Users with regulatory or compliance constraints over where data must be stored

If you’re already a VictoriaMetrics Cloud user, you can now launch new deployments in ap-southeast-1 (Singapore) via the console (region selector). If you’re evaluating VictoriaMetrics Cloud, you can just Sign Up and test our performance during a month free of charges.

Of course, if you’d like us to expand into additional regions, contact us and let us know! Your request helps guide our roadmap.

“Deployed on AWS”: Helping You Maximize Cloud Commitments

#

Since May 1st, AWS customers can only retire Private Pricing spend commitments with software validated as “100% built on AWS”. VictoriaMetrics Cloud now proudly carries the “Deployed on AWS” badge.
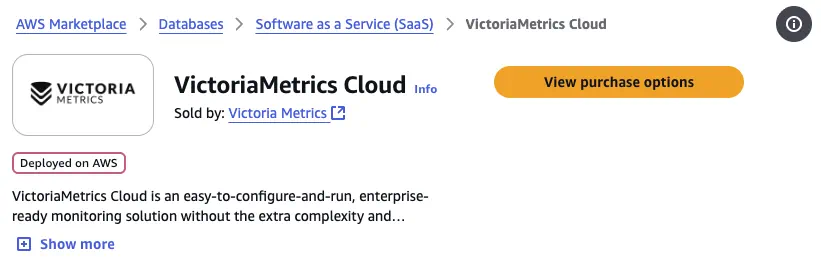
This means you can now use your AWS spend commitments on VictoriaMetrics Cloud. We totally sympathize with the need to wisely use expenses at the end of the year, and we’ll be happy to help in this tedious task.

Read more on AWS’s official announcement.

#

We’ve rolled out a completely new left navigation menu designed to make everything just a click away. Now you can easily jump between all VictoriaMetrics Cloud functionality: from monitoring your deployments usage, change their settings, or manage access tokens.
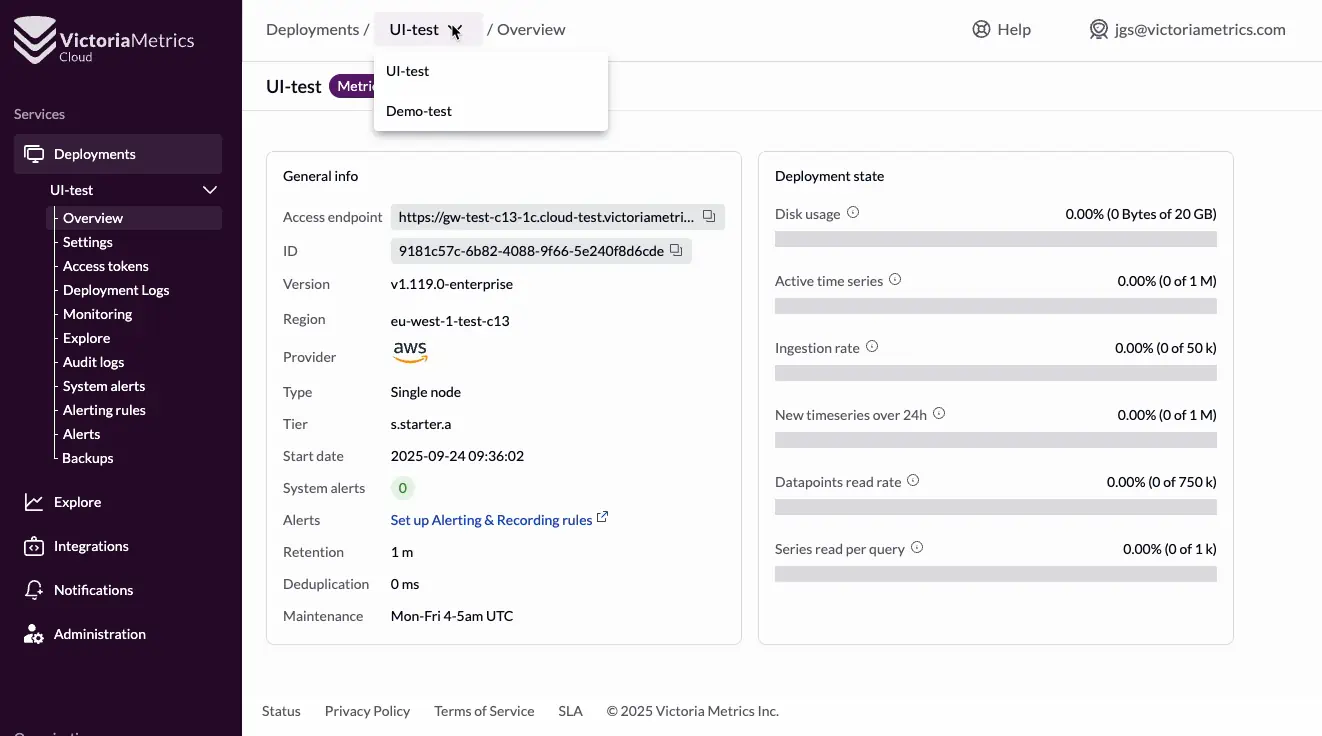
We’ve also added breadcrumbs so you can quickly navigate between deployments without going back and forth.

This results in a further step towards a more modern observability experience, as we evolve the VictoriaStack into the Cloud, especially with Logs coming soon.

Improved Deployment Logs Navigation

#

We know logs can be… a lot. That’s why we’ve improved the deployment logs view to make it easier to read and search through.

Deployment logs are now more responsive and accessible, color-coded and structured by columns, while they can still be filtered by date, service, or even regex (if that’s your coup of tea!).
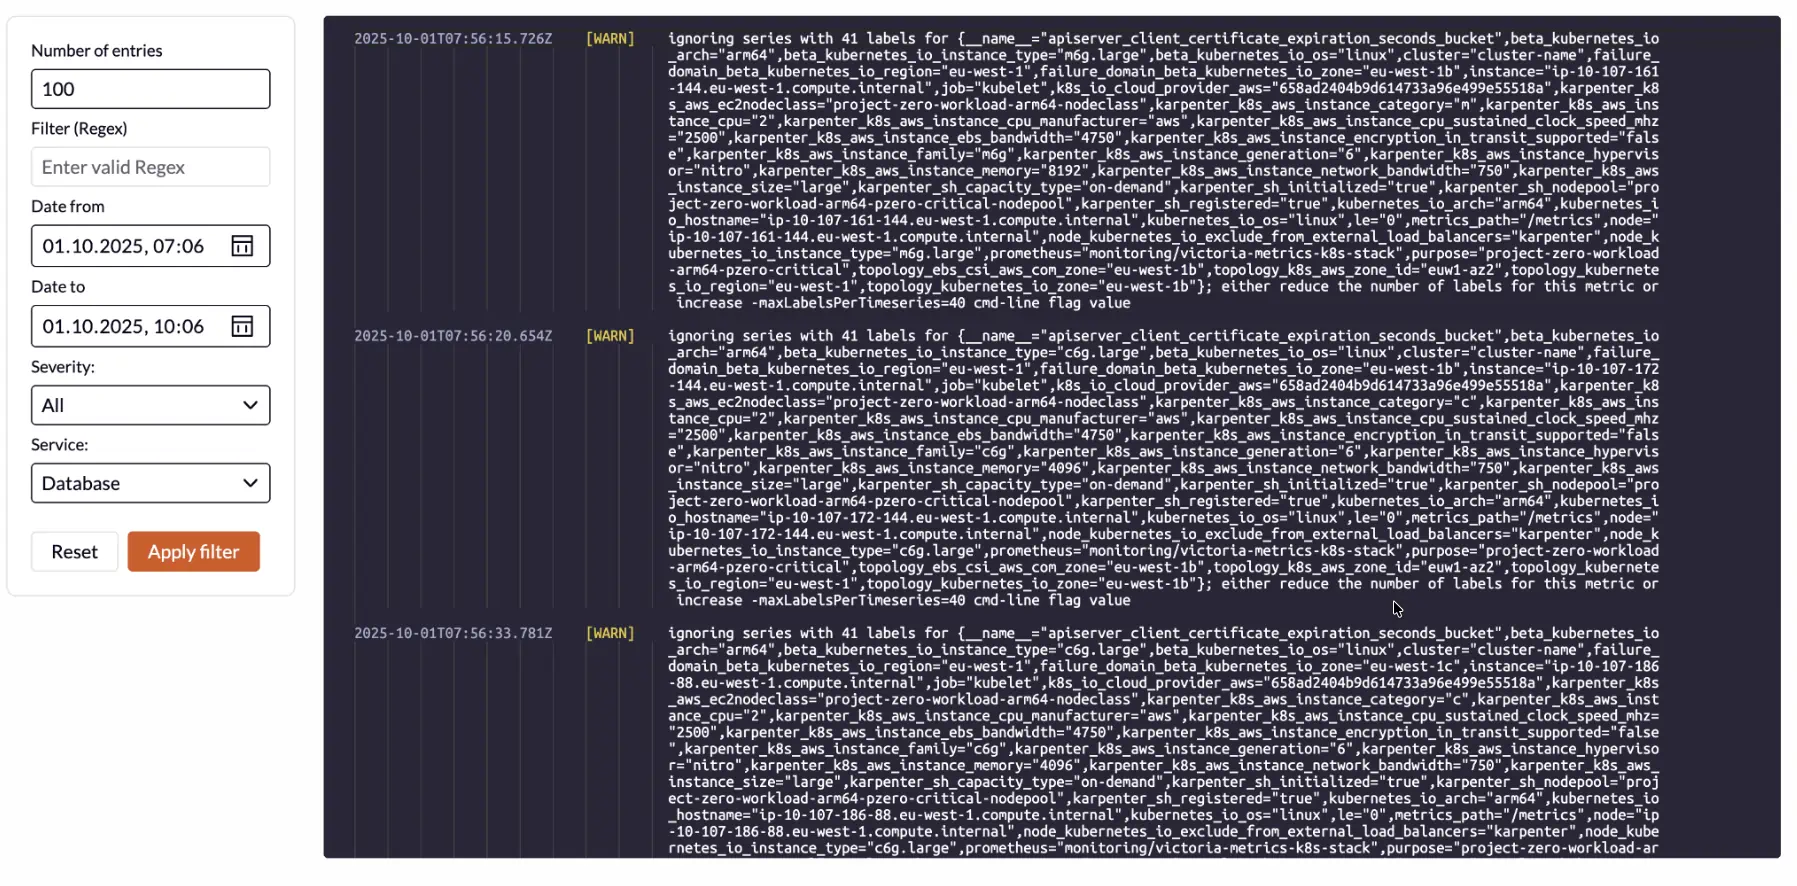
In brief: finding what you need in long lines is now much simpler (and your eyes will thank you).

#

We’ve added two powerful features from VictoriaMetrics UI directly into VictoriaMetrics Cloud: the debugging tool for both Downsampling and Retention Filters.

These tools are now available in the Explore section, and you can now use them to easily understand or validate how these configurations affect your metrics before applying them to production.

But what is Downsampling?

#

In a nutshell, downsampling is the process of reducing data resolution over time into broader intervals. This helps in many ways:

  • Saving storage
  • Improving query performance without losing visibility for longer retention times
  • Reduce overall load in your deployments

For example, if you want to keep raw data at one-second resolution for the past few days, while storing one-minute granularity for data older than a month, you just need to add downsampling configuration flags for the desired time intervals and metrics.

What about Retention Filters?

#

In general, we use retention configuration to determine how long time series data is kept before it’s deleted. But reality tells us that not all metrics are that relevant as the time passes. With retention filters, you can specify different policies per metric, label, or pattern: for example, keeping infrastructure metrics for 30 days and business KPIs for 180 days. This level of granularity allows you to fine-tune your storage.

So what’s this tool about?

#

In theory this is great, but in reality it can be scary. That’s where this Debugging Tool shines: it gives you an interactive way to simulate how downsampling and retention rules work. By playing around, you can check how these rules and filters will impact your metrics without changing your live setup. It works in 3 steps:
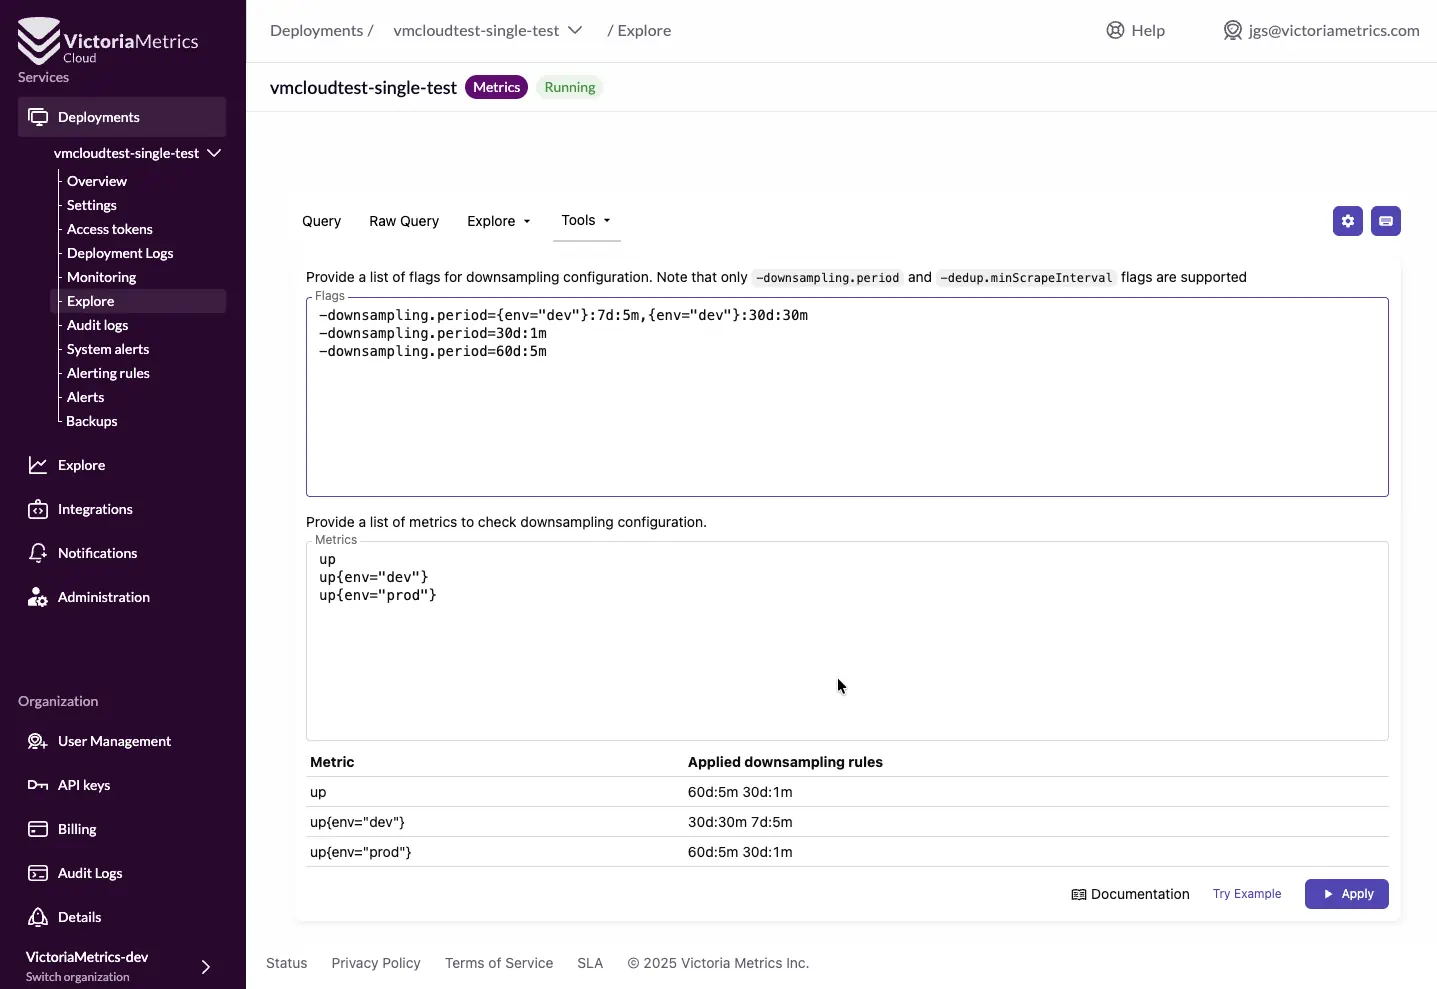
  1. Enter a list of flags
  2. Select one or more metrics to which the configuration should apply
  3. And click “Apply” to generate a detailed preview

The result displays a comprehensive list of how each metric is affected.

If this is still a bit overwhelming for you, don’t forget that you can just click on the “Try Example” button to load sample configurations and metrics to see how the system behaves, as you learn without risks.

Alerts and Limits: Better together

#

VictoriaMetrics Cloud automatically manages your deployment, but staying within your chosen tier is important to maintain stability and avoid throttling.

Now, you’ll receive notifications when you’re approaching or exceeding:

  • Ingestion rate
  • Active time series
  • New series over 24h (churn rate)
  • Datapoint read speed
  • Series read per query

These alerts include actionable recommendations, helping you decide whether to scale up or optimize your workload.

Other Improvements

#

Apart from all of these improvements, the new VictoriaMetrics Cloud version includes:

  • Prometheus 3.0 MetricsQL support – including quoted label names
  • New styles for compact screen resolutions
  • API for VM Single: enabled log_new_series to track new series and identify churn sources
  • Regular security updates including TLS 1.0 and 1.1 deprecation for improved security, as previously announced.

What’s Next?

#

We’re not slowing down! Here’s what’s coming soon:

  • New capacity tiers Stay tuned, because we are revamping our tiers. Based on real-world usage, new benchmarks and feedback, we’re providing a new list of VictoriaMetrics Cloud tiers to ensure smoother scalability and clearer progression between deployments.

  • Logs are coming to VictoriaMetrics Cloud! As we advance in our path to deliver VictoriaLogs in VictoriaMetrics Cloud, we can announce that the integration with initial support for OpenTelemetry, Vector, and FluentBit is done (and Perses warming up on the bench). The new UI already includes selectors and integrations by type, and early PoCs are looking great. I want to personally take this opportunity to thank our great community of users and customers for their feedback (still open!).

As always, thanks for spending this time with us and for being part of the VictoriaMetrics community ❤️. Your feedback keeps shaping the future of VictoriaMetrics Cloud.

Ready to try the latest features? Sign up for VictoriaMetrics Cloud and get started today!