KubeCon + CloudNativeCon Europe in Amsterdam brought together about 13,500 attendees this year, the largest turnout yet. The size of the event showed just how much the cloud-native space has grown, and how central observability, platform engineering, and cost control have become.
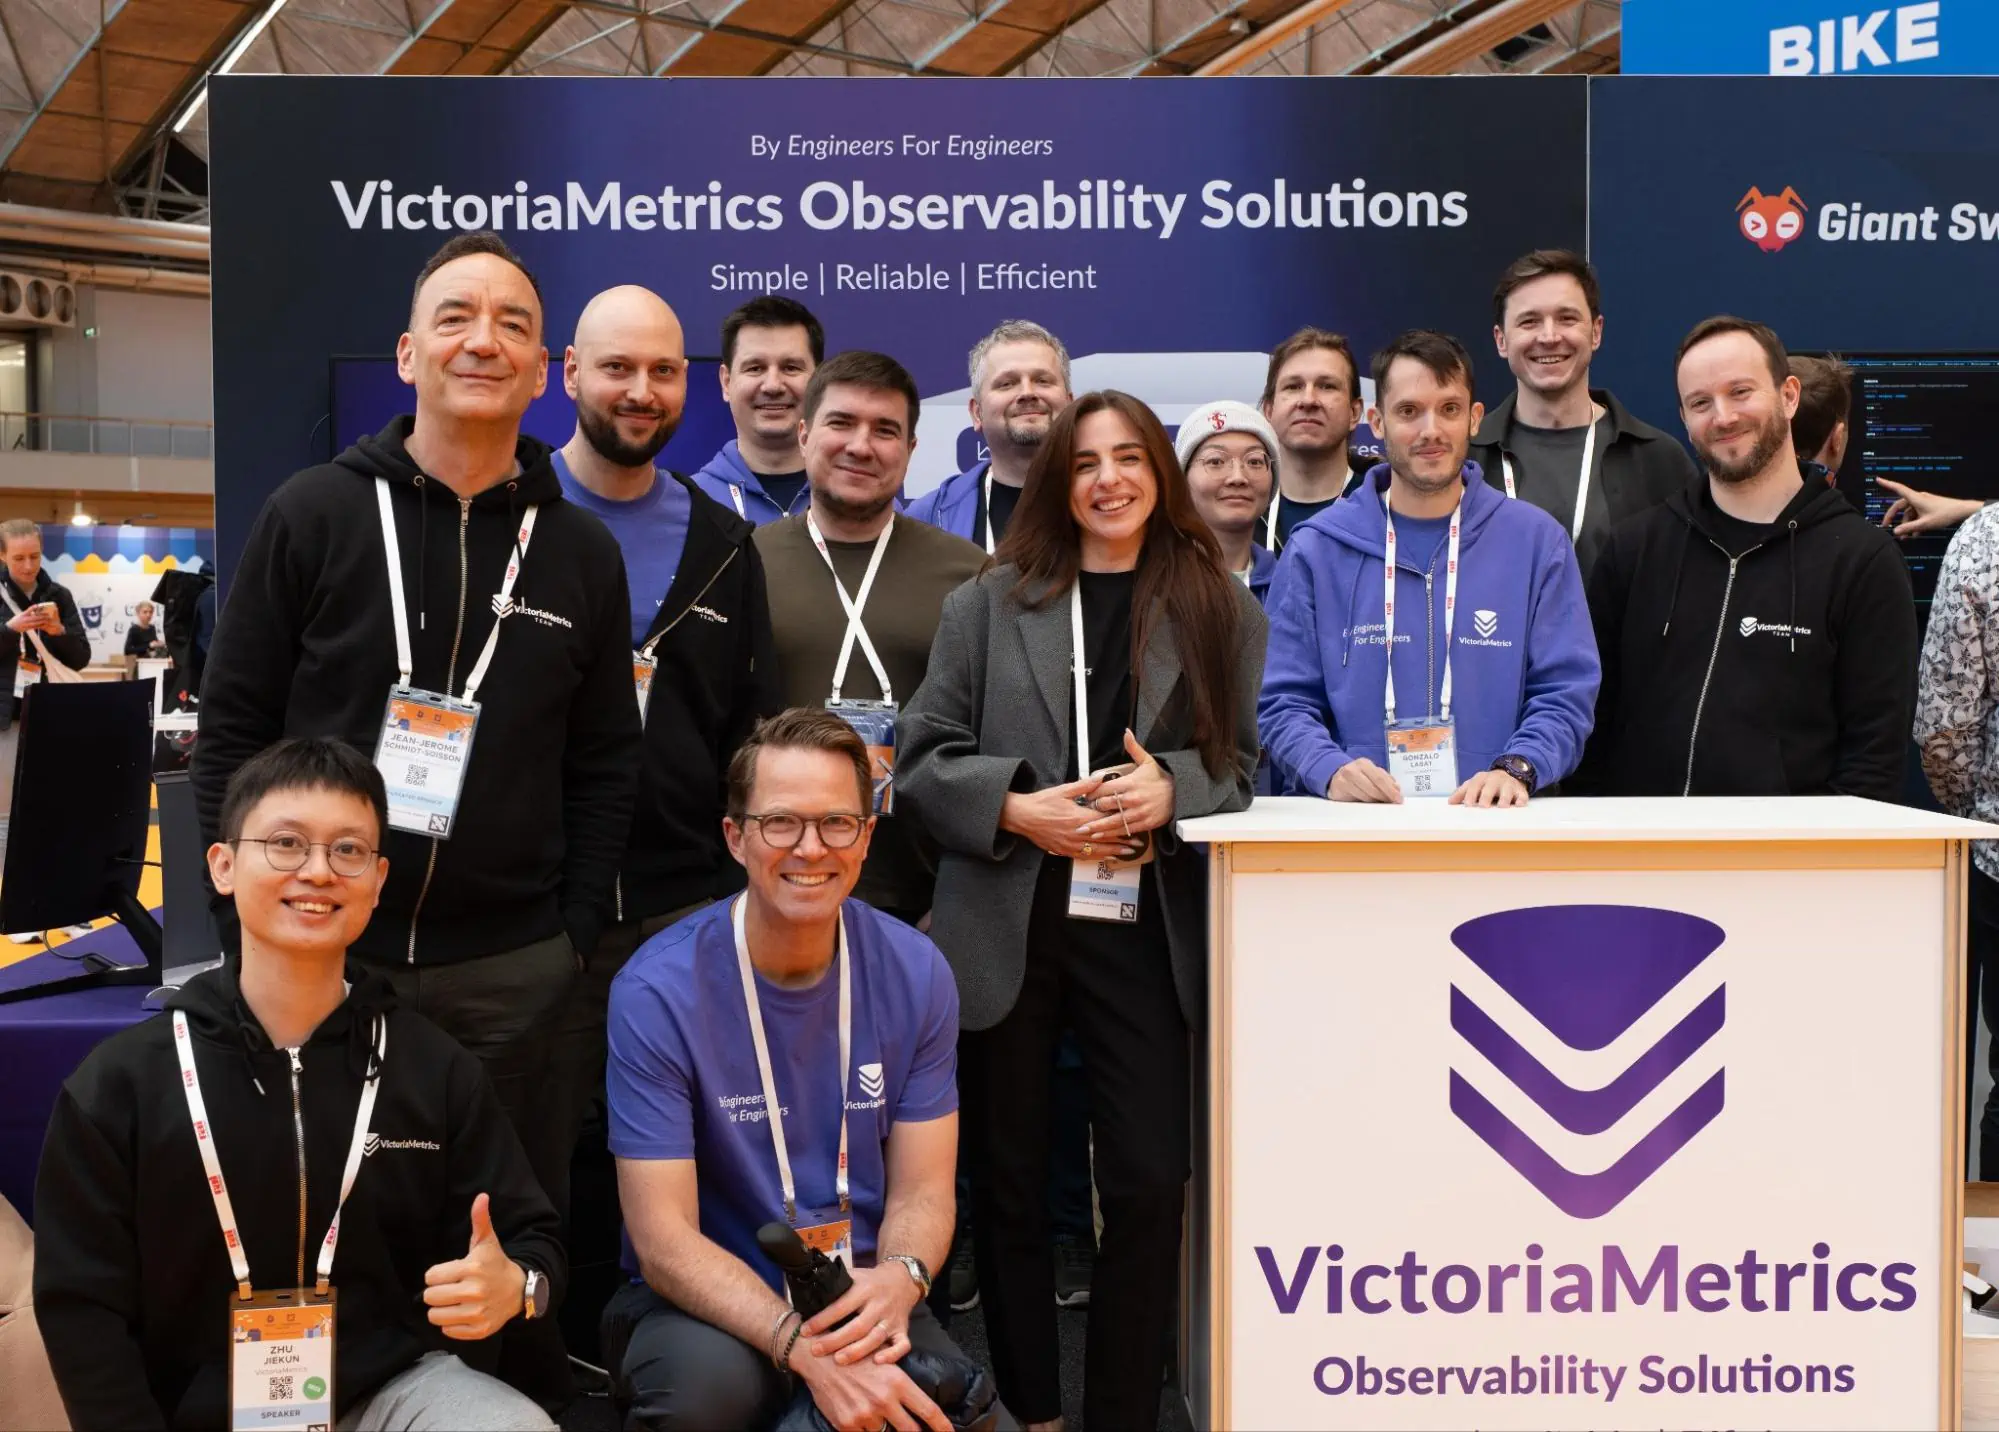
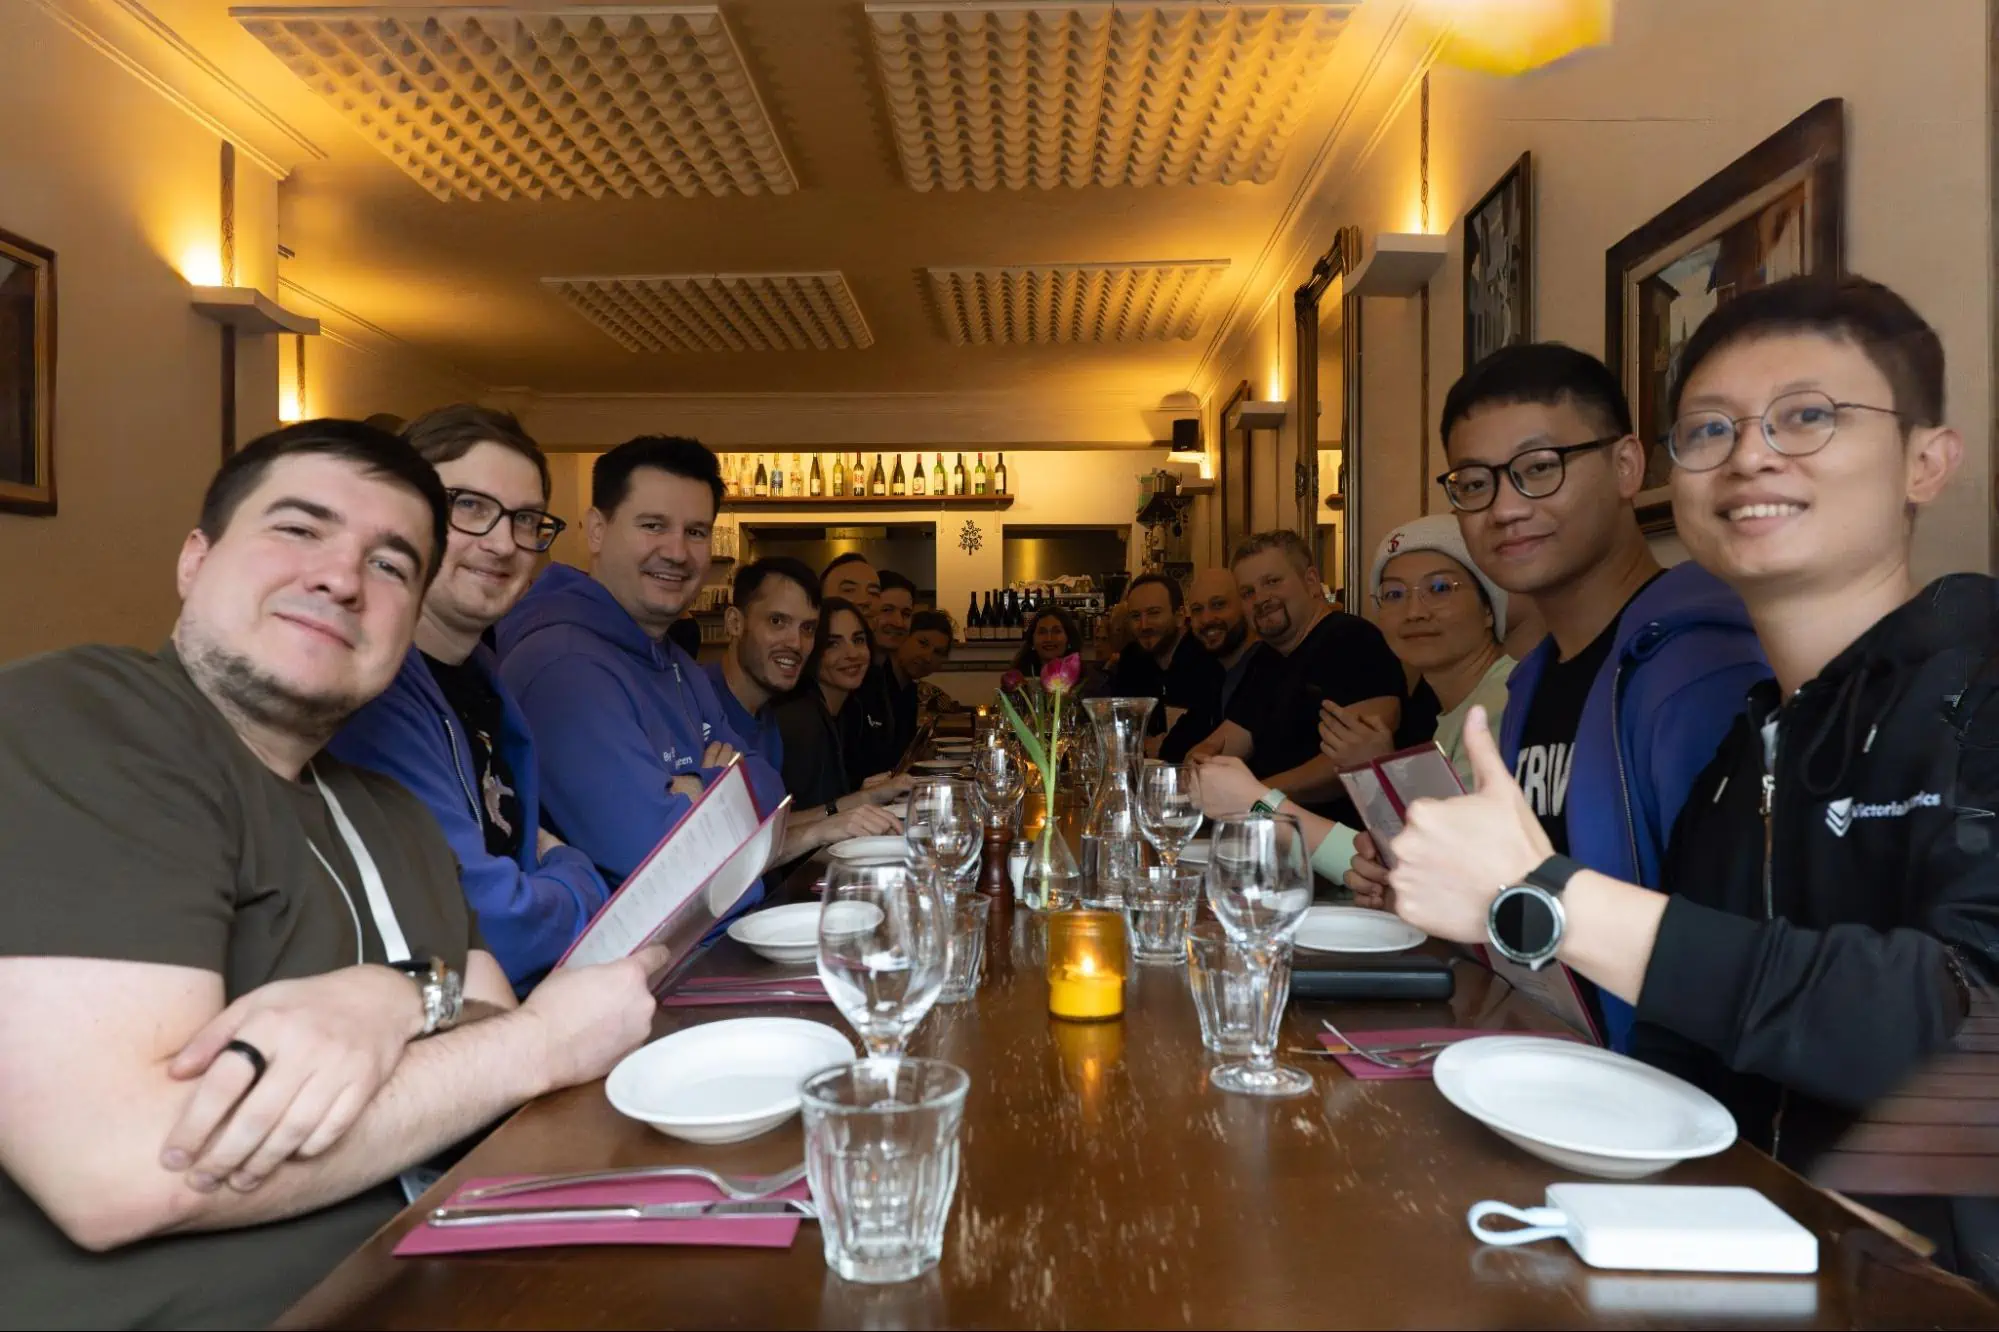
For VictoriaMetrics, this year’s event was a mix of talks, booth conversations, and a lot of direct feedback from users. We sent a team of 15, which allowed us to have in-depth conversations with people working through very different scaling and observability problems.
We gave several talks, each approaching the platform and observability problems from a different angle.
“Retroactive Sampling with OpenTelemetry: Cut 90% Distributed Tracing Bandwidth Usage”
Later on Tuesday, Roman Khavronenko and Zhu Jiekun presented a more technical deep dive into distributed tracing. The session introduced retroactive sampling techniques using OpenTelemetry, showing how teams can significantly reduce tracing bandwidth without losing useful data.
The talk reflected a broader trend seen across the event: teams are not only collecting more telemetry, but also becoming more selective and intentional about how they store and process it.
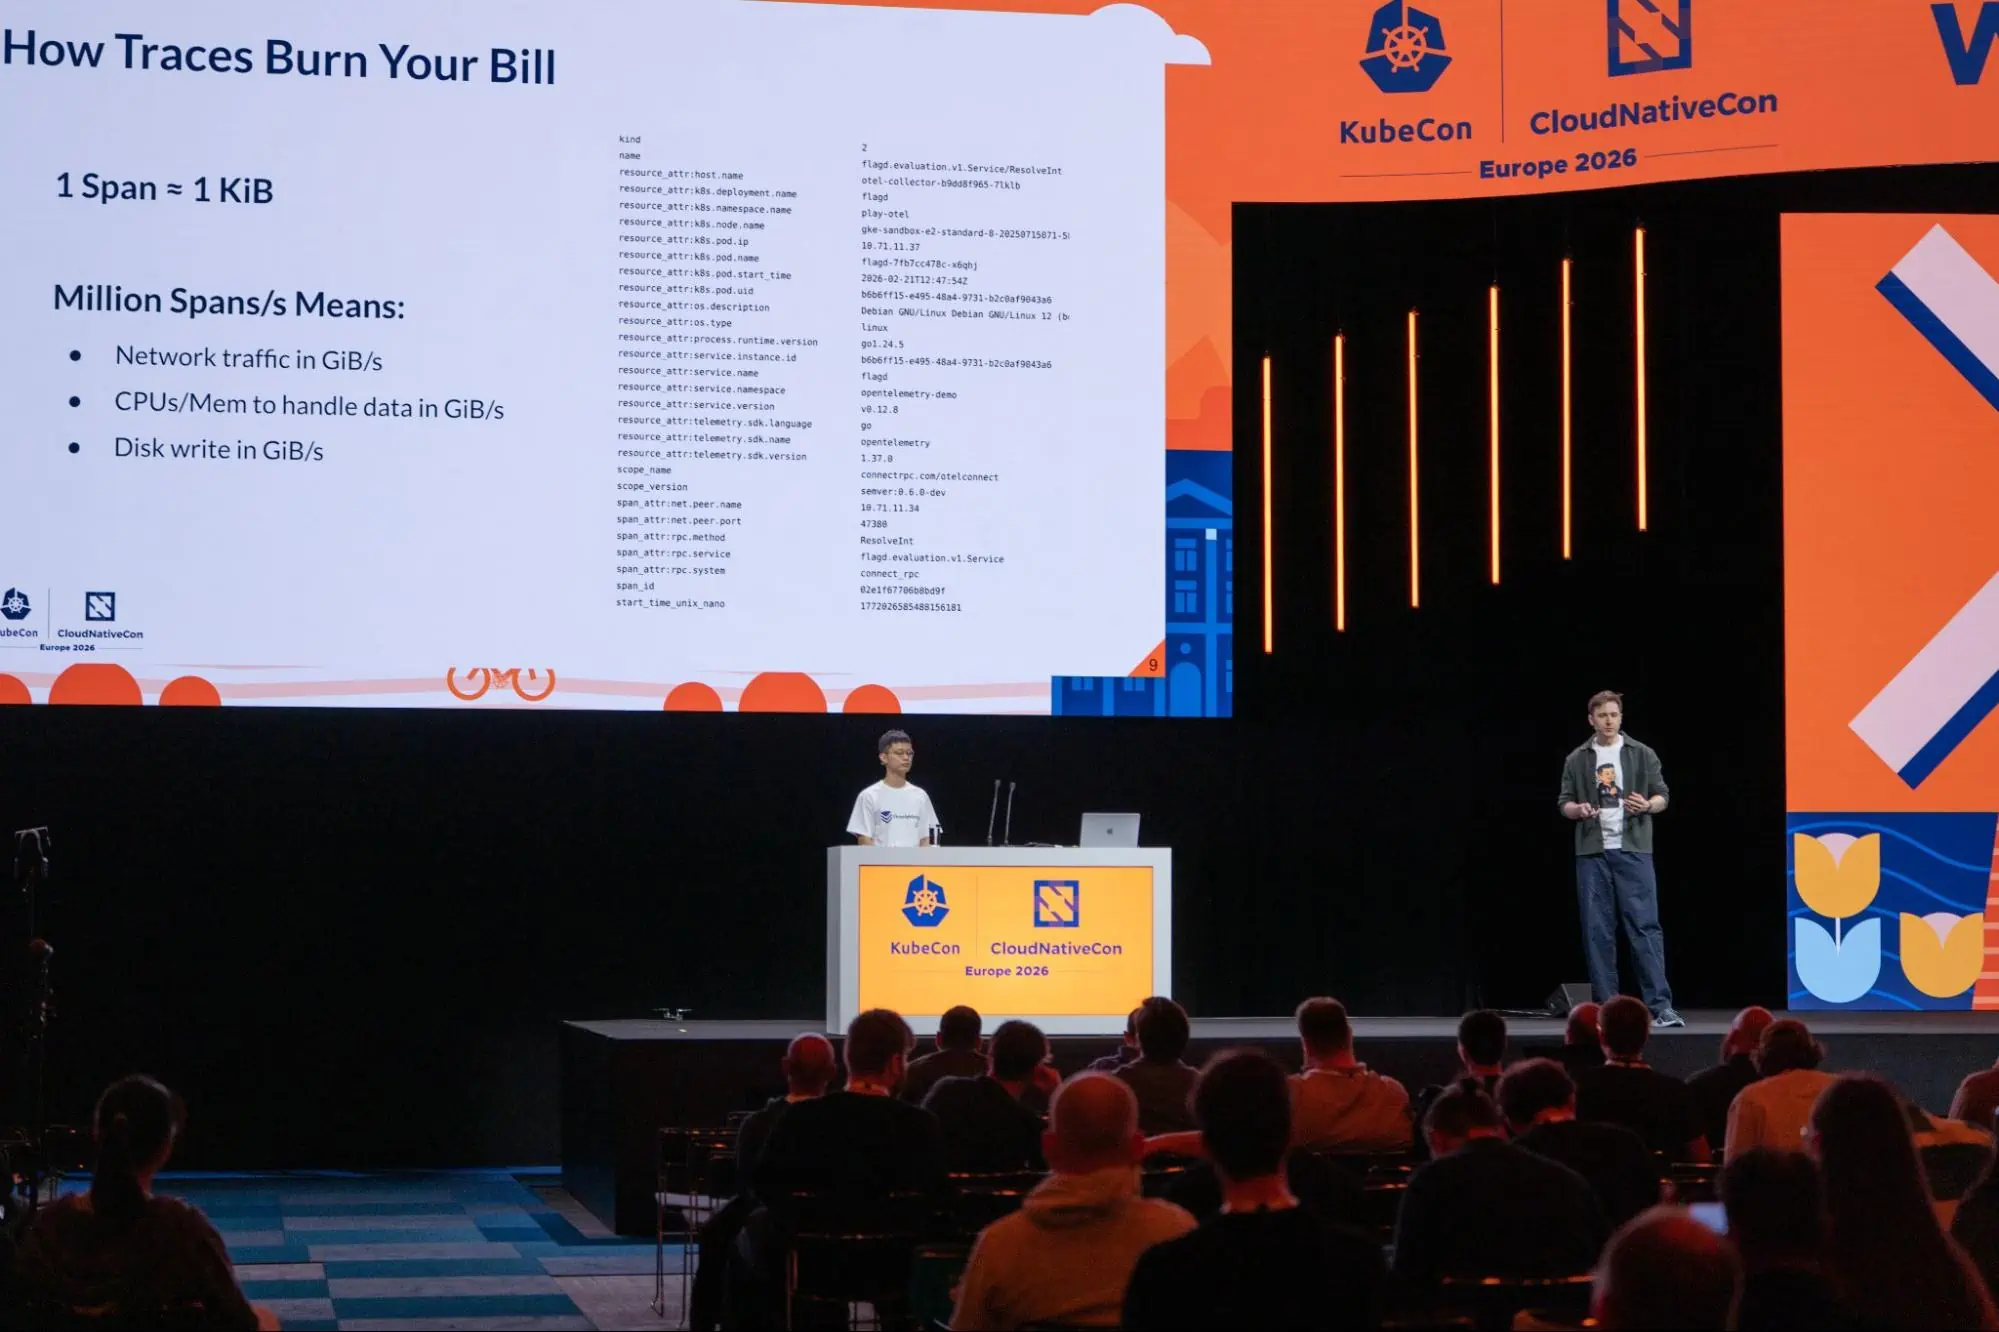
This talk drew strong interest from the audience, reflecting a broader industry focus on controlling telemetry costs and the growing need for practical strategies to reduce the overhead of distributed tracing. The official video of this talk can be watched on the CNCF YouTube channel, here. Read all about the technical aspects of this talk in our blog article.
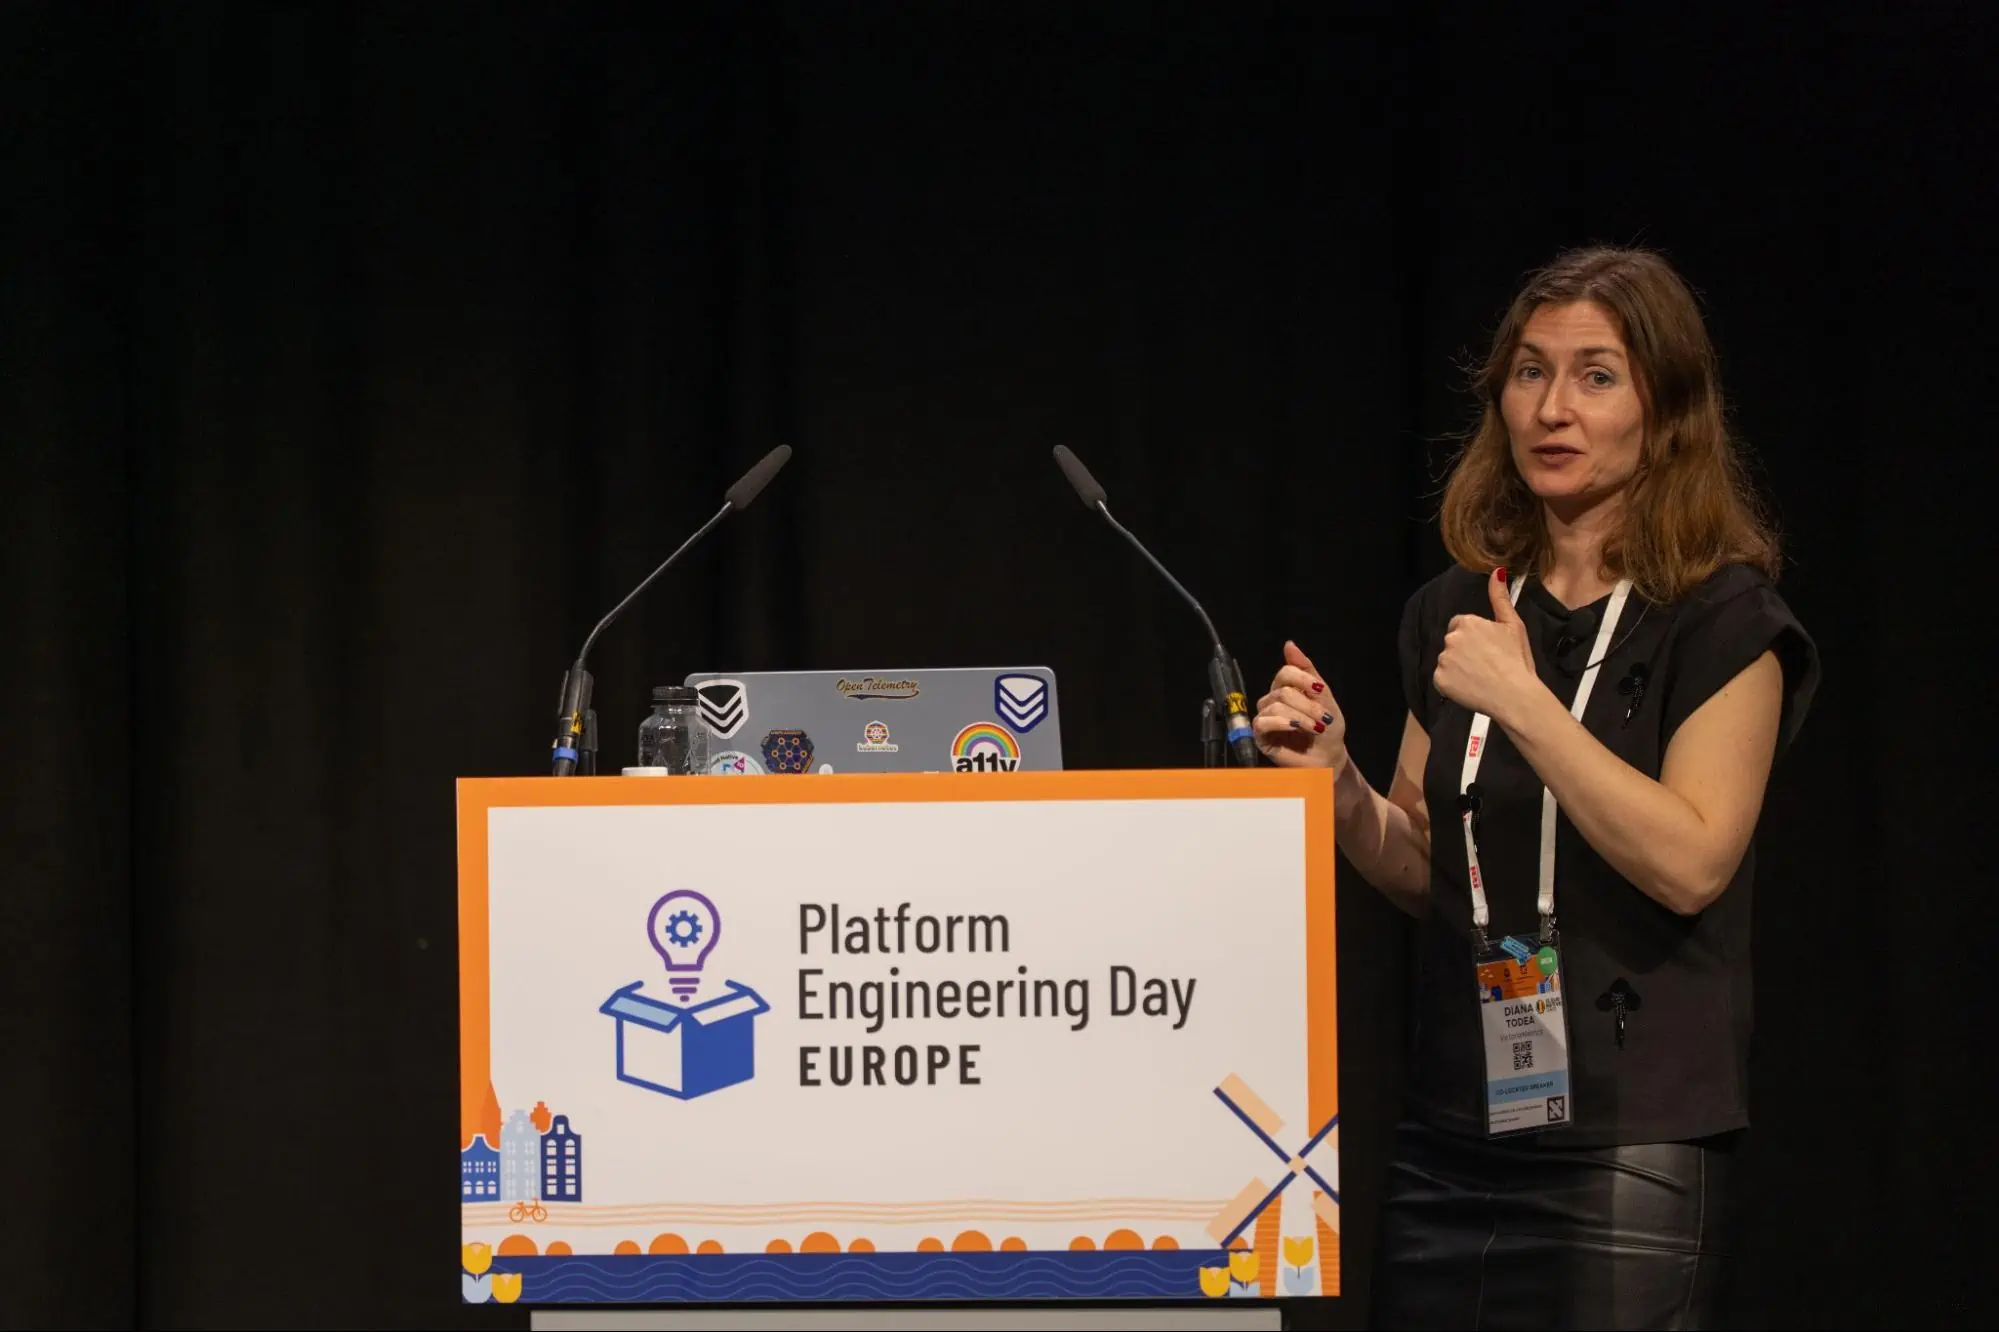
“Who Built This Platform? Alternative Viewpoints on Platform Design”
Presented by Diana Todea (VictoriaMetrics) and Elif Samedin, this session opened the conference on Monday morning during Platform Engineering Day. It focused on how different roles within an organization shape platform design decisions, and how those perspectives can sometimes conflict.
The talk explored the tension between developer experience, operational constraints, and business priorities, offering a more nuanced view of how platforms evolve in practice rather than in diagrams. The official video has been released and you can watch it here.
“Panel: Platform Resilience, Built on Belonging”
Later that day, Diana Todea joined a panel discussion with the Merge-Forward members examining resilience beyond technical systems. The conversation connected platform reliability to team dynamics, arguing that sustainable systems often reflect the inclusivity and supportiveness of the teams behind them.
The panel brought together multiple viewpoints, highlighting that resilience is not only about architecture, but also about collaboration and culture. The official video has been released and you can watch it here.
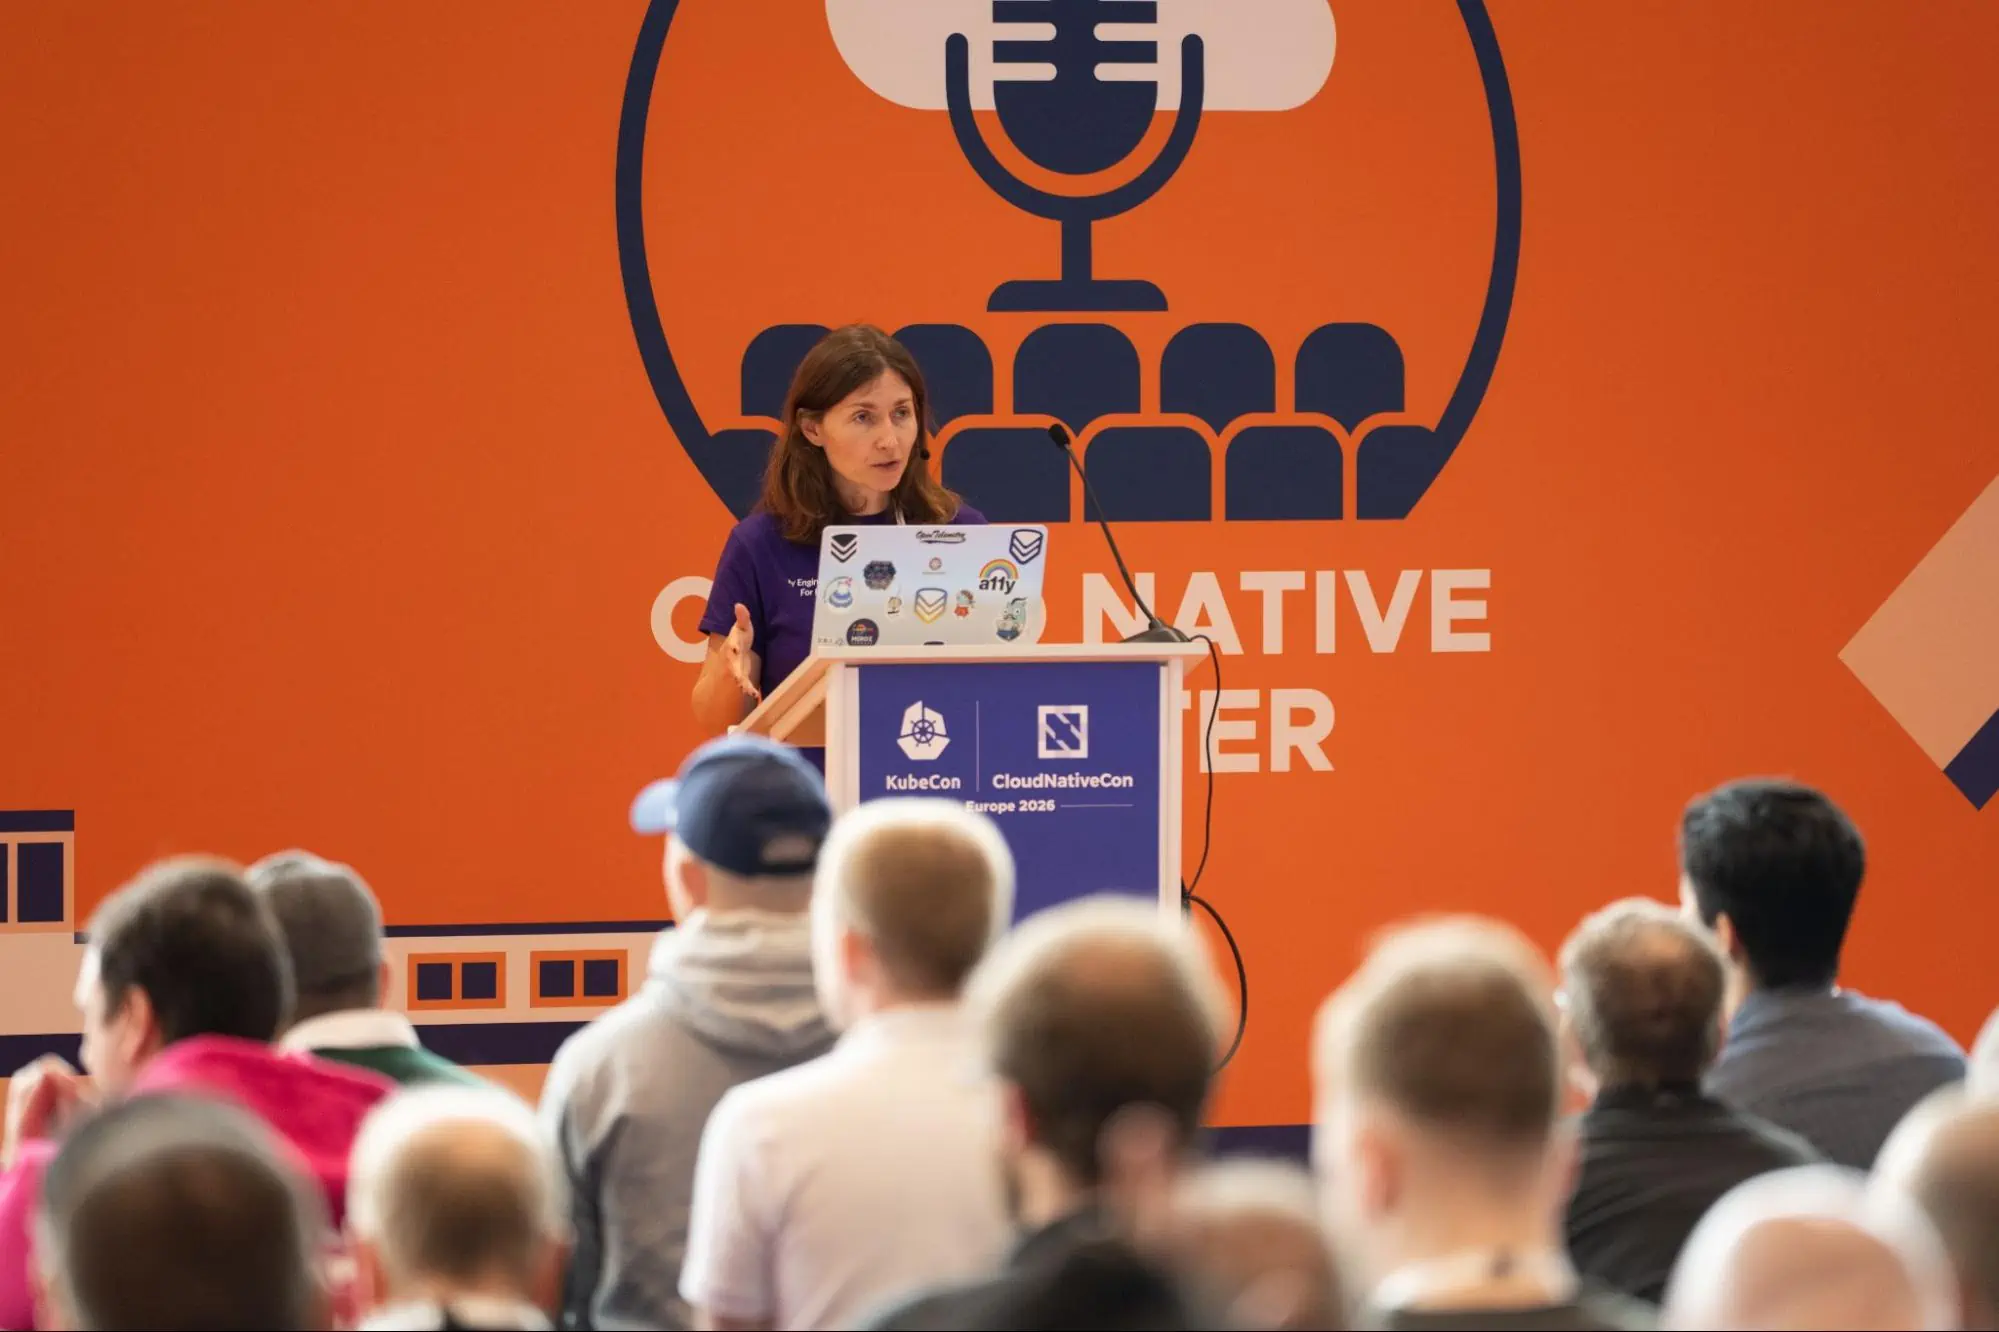
“A Simple and Practical Guide to Observability in Kubernetes”
Delivered as part of the Cloud Native Theater, this session focused on making observability in Kubernetes more approachable. Instead of introducing new abstractions, it walked through practical ways teams can get started and improve incrementally. The emphasis was on clarity - what to measure, how to structure metrics, and how to avoid unnecessary complexity early on, with examples from VictoriaLogs and Kubernetes observability. The official video has been released and can be watched here.
Beyond the VictoriaMetrics-led sessions, it was equally valuable to see how the system is used in production environments by end users.
“Cutting Metrics Traffic, Cutting Costs: The AZ-Aware Observability Blueprint”
In this session, Iris Dyrmishi and Rodrigo Fior Kuntzer from Miro presented a detailed look at their observability architecture built with VictoriaMetrics. The talk focused on a cost dimension that is often underestimated: inter-availability zone traffic.
Rather than optimizing only for storage or compute, the approach introduced an AZ-aware sharding strategy that minimizes cross-zone metrics transfer. By configuring agents to scrape targets within the same availability zone and applying standard relabeling across Prometheus, OpenTelemetry, and VictoriaMetrics, they significantly reduced network costs. You can watch the full recording here.
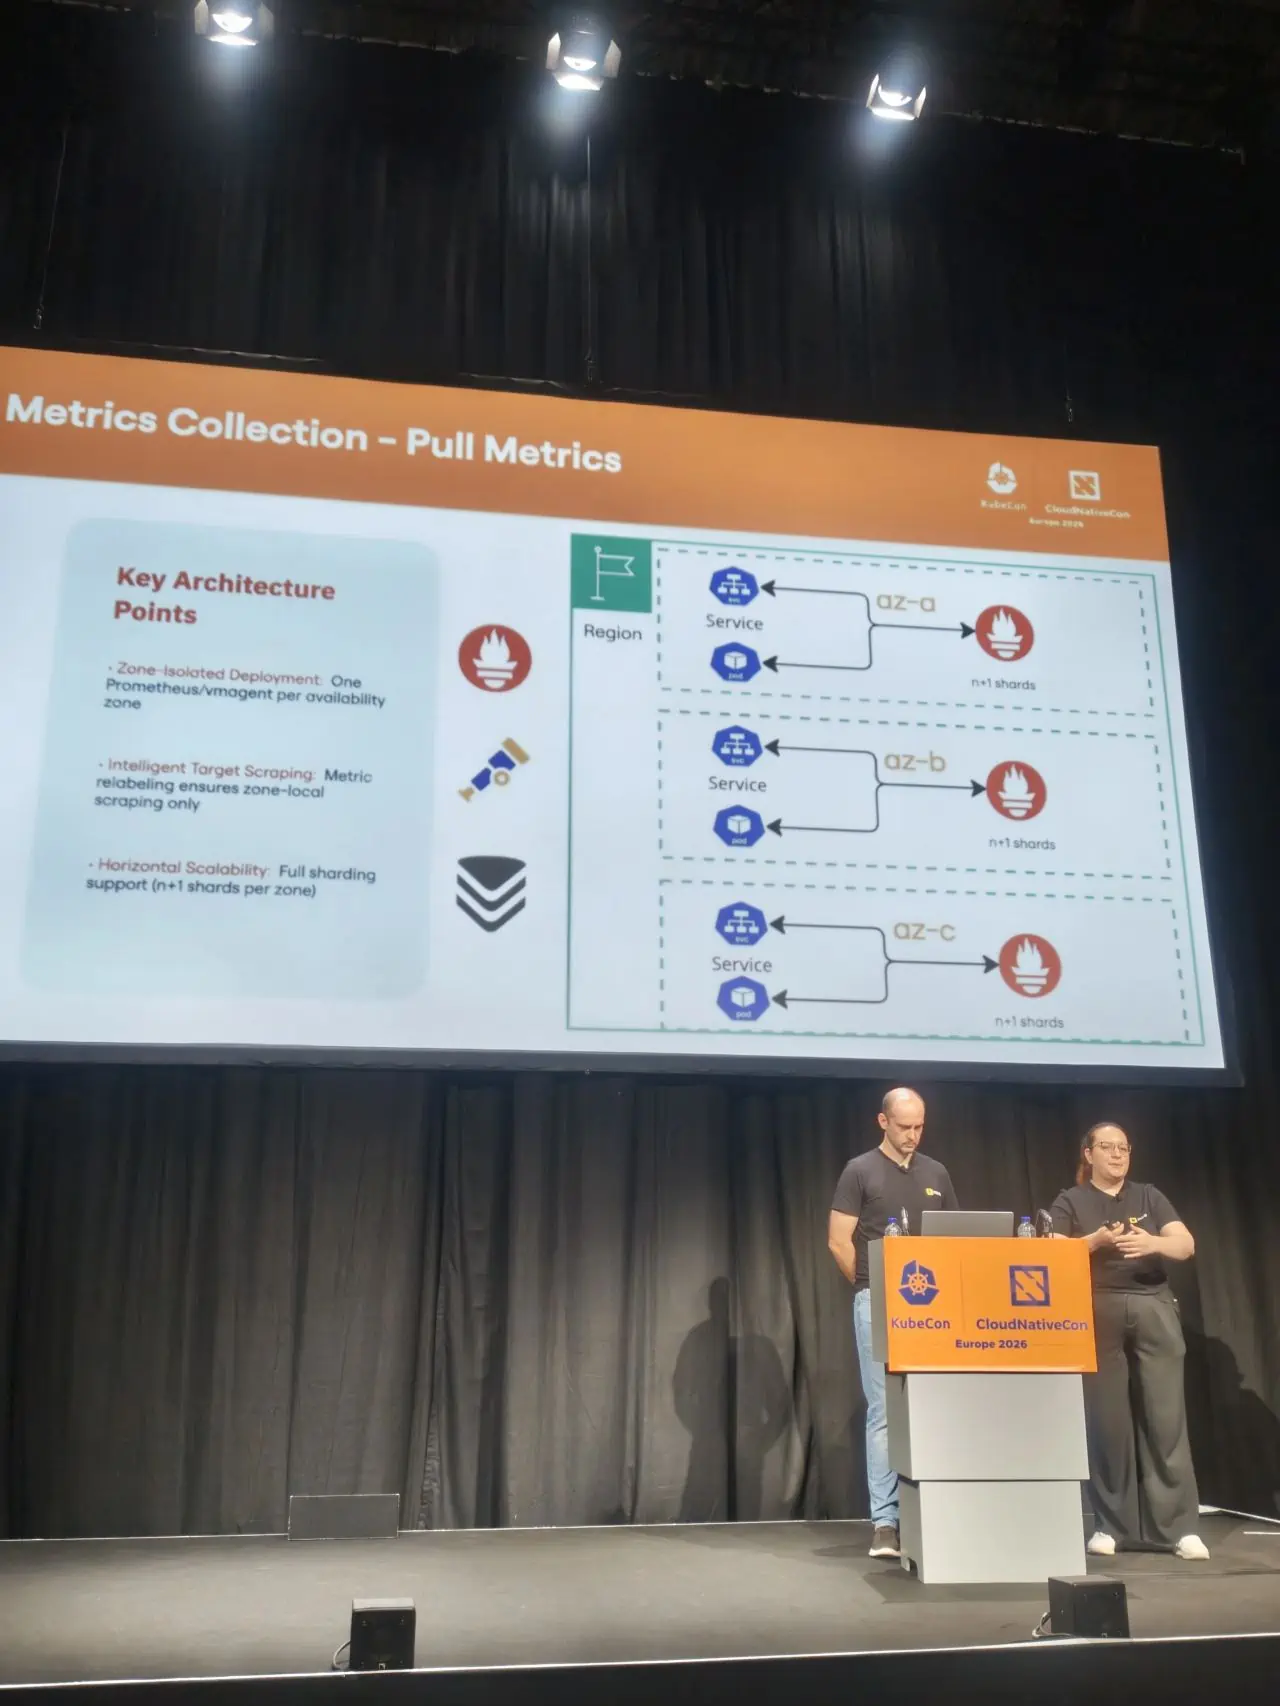
What made this session particularly relevant was its practicality. The architecture did not rely on proprietary components or complex abstractions, but instead used existing mechanisms in a disciplined way. The result was not only lower cloud spend, but also a more predictable, resilient metrics pipeline, forging an observability blueprint.
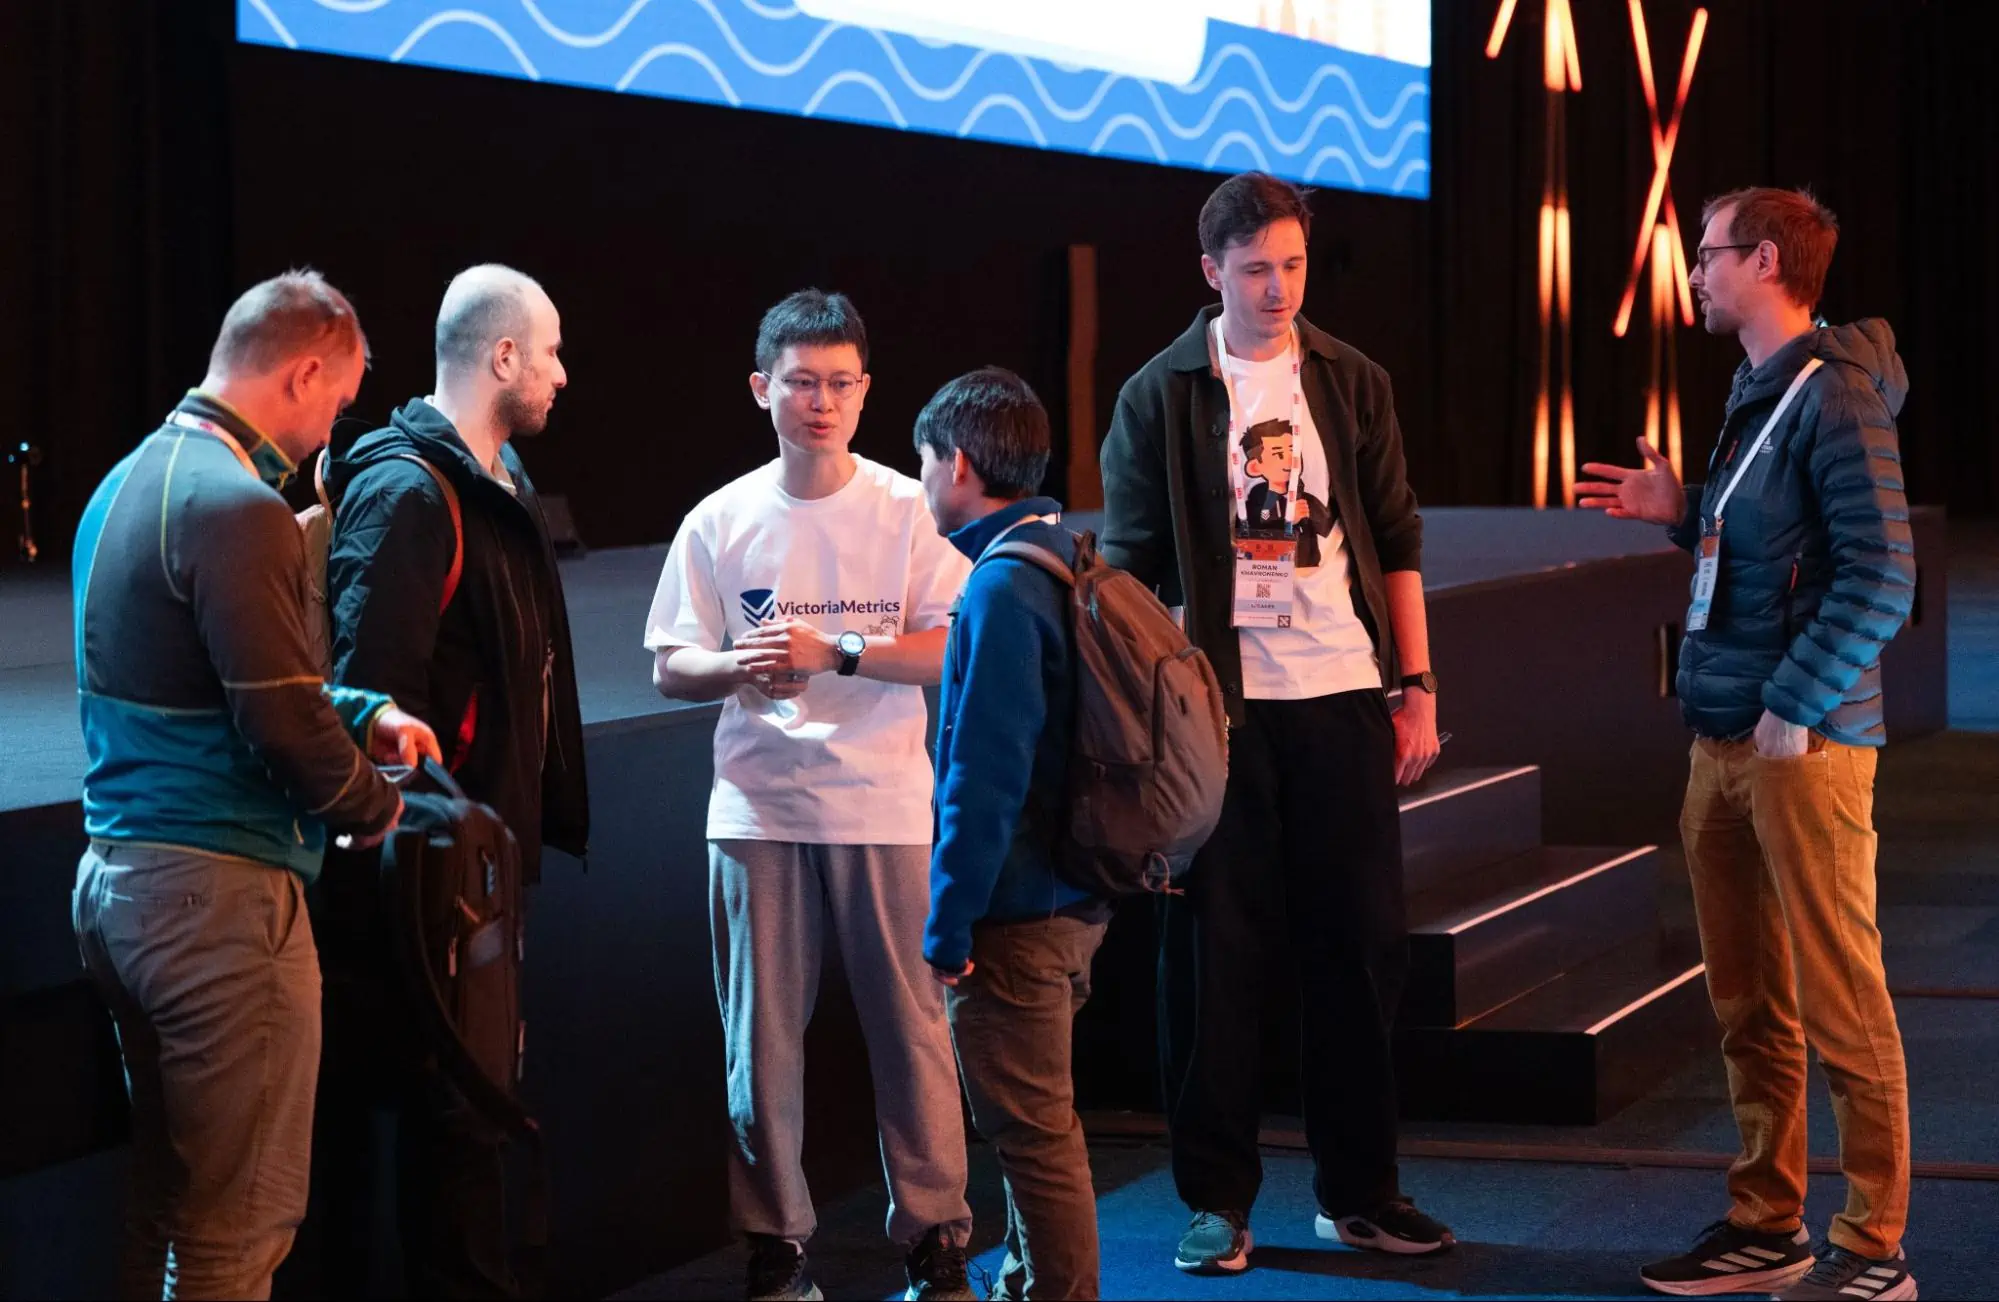
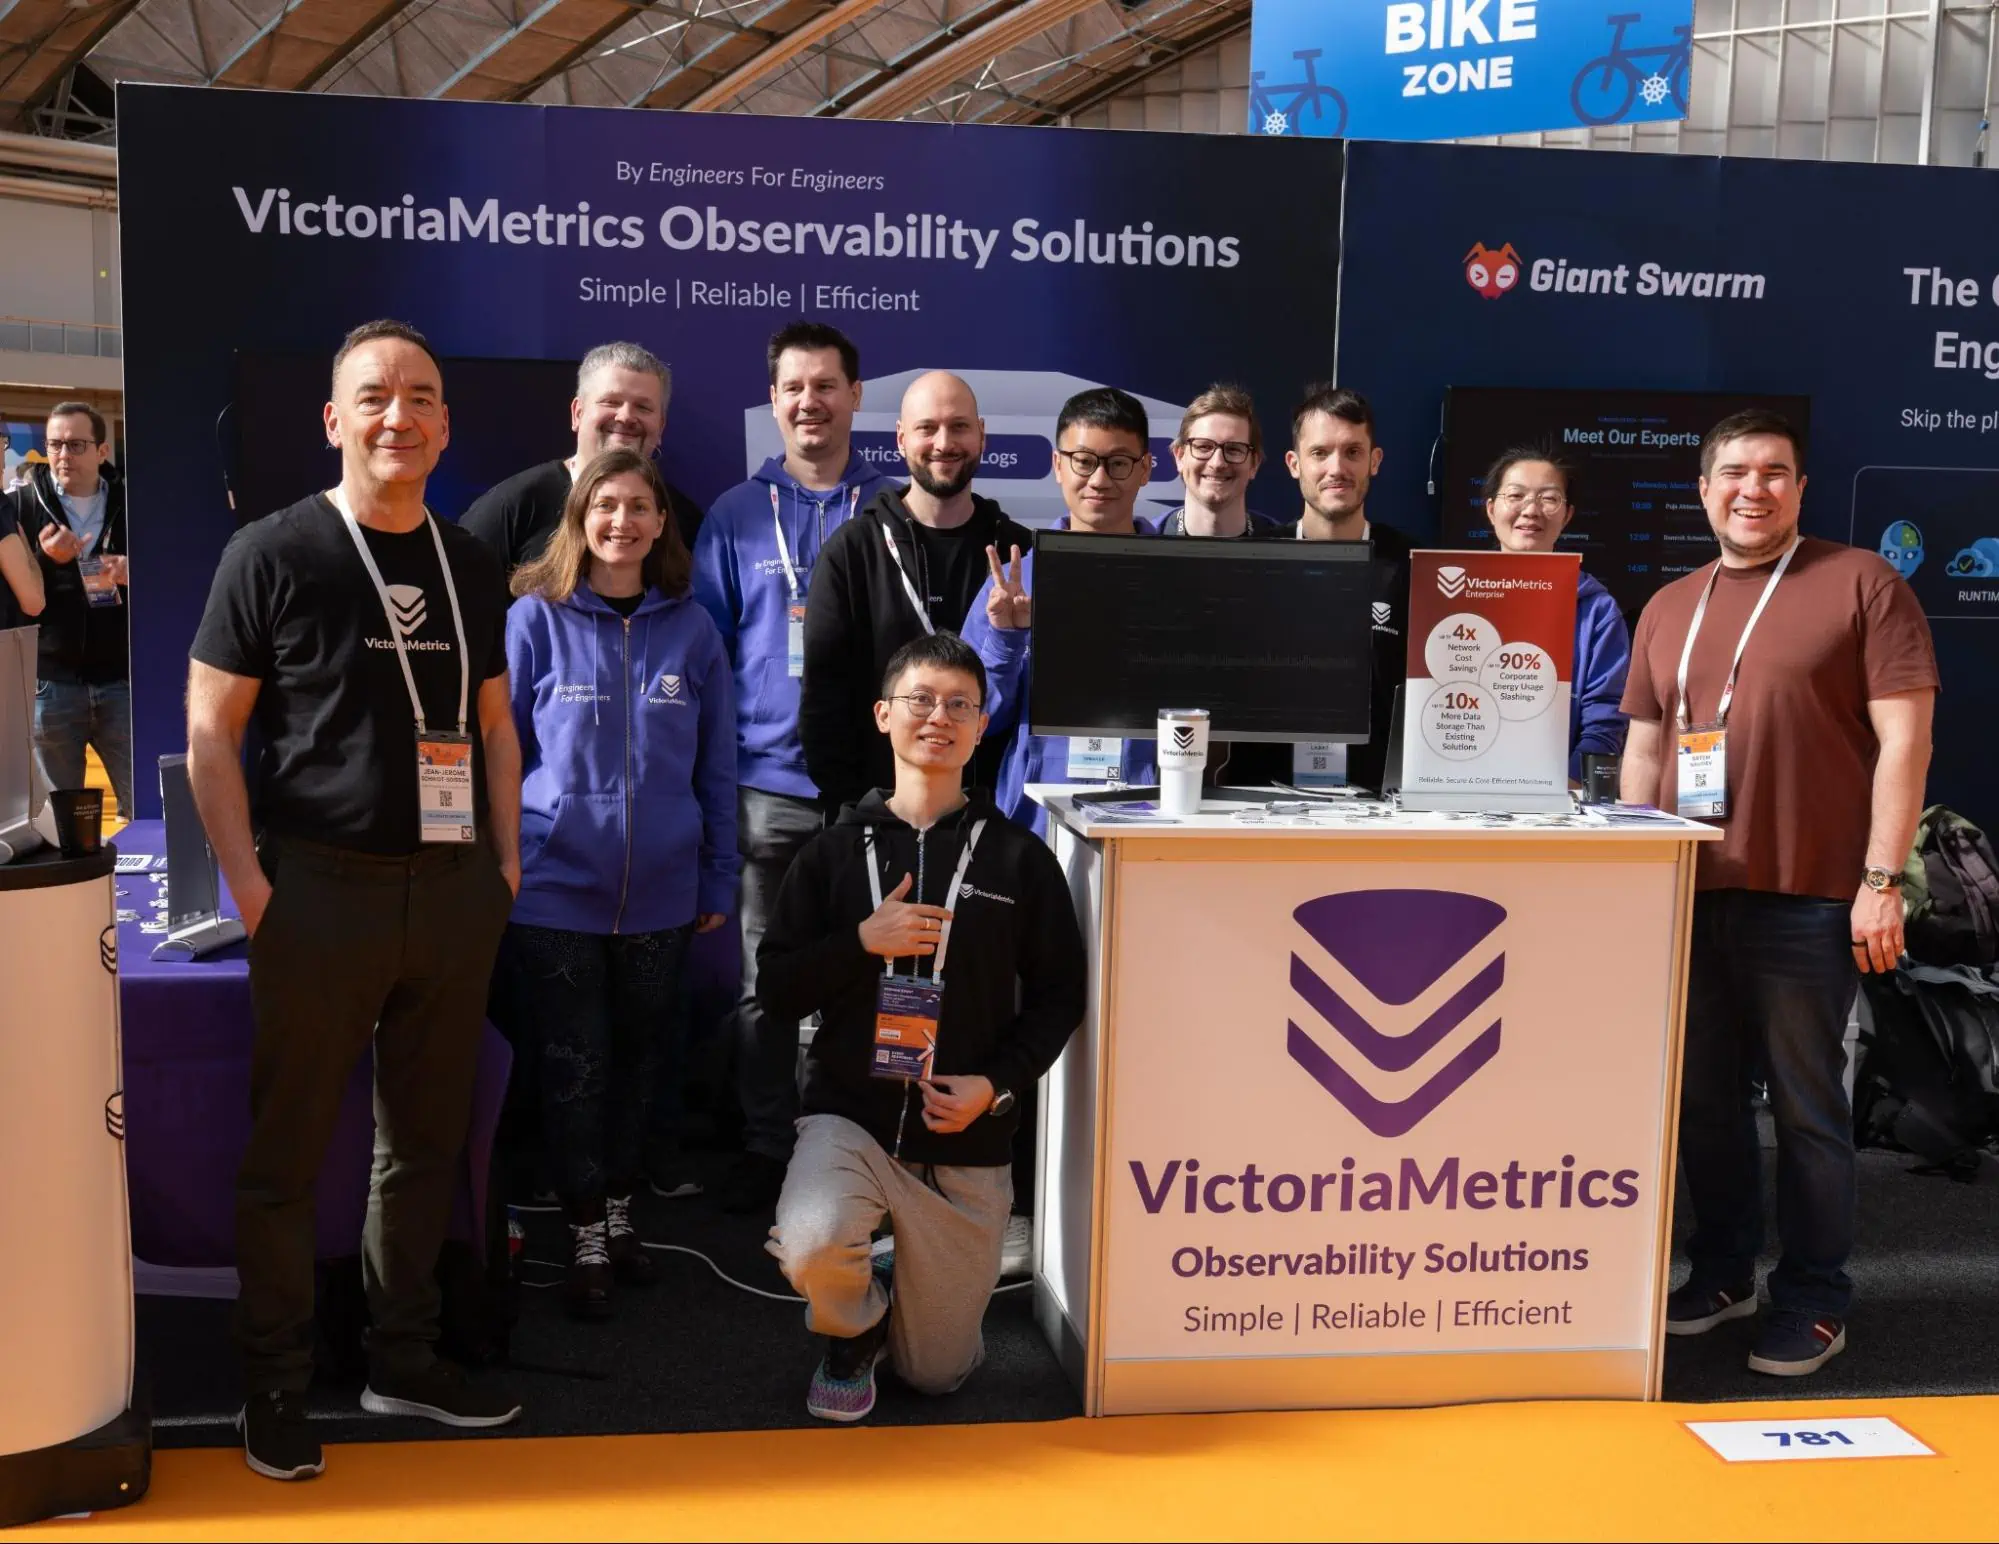
Outside the scheduled talks, most interactions happened at the booth. The steady flow of visitors included both existing users and teams evaluating changes to their observability stack, with strong interest in VictoriaMetrics technologies throughout the event.
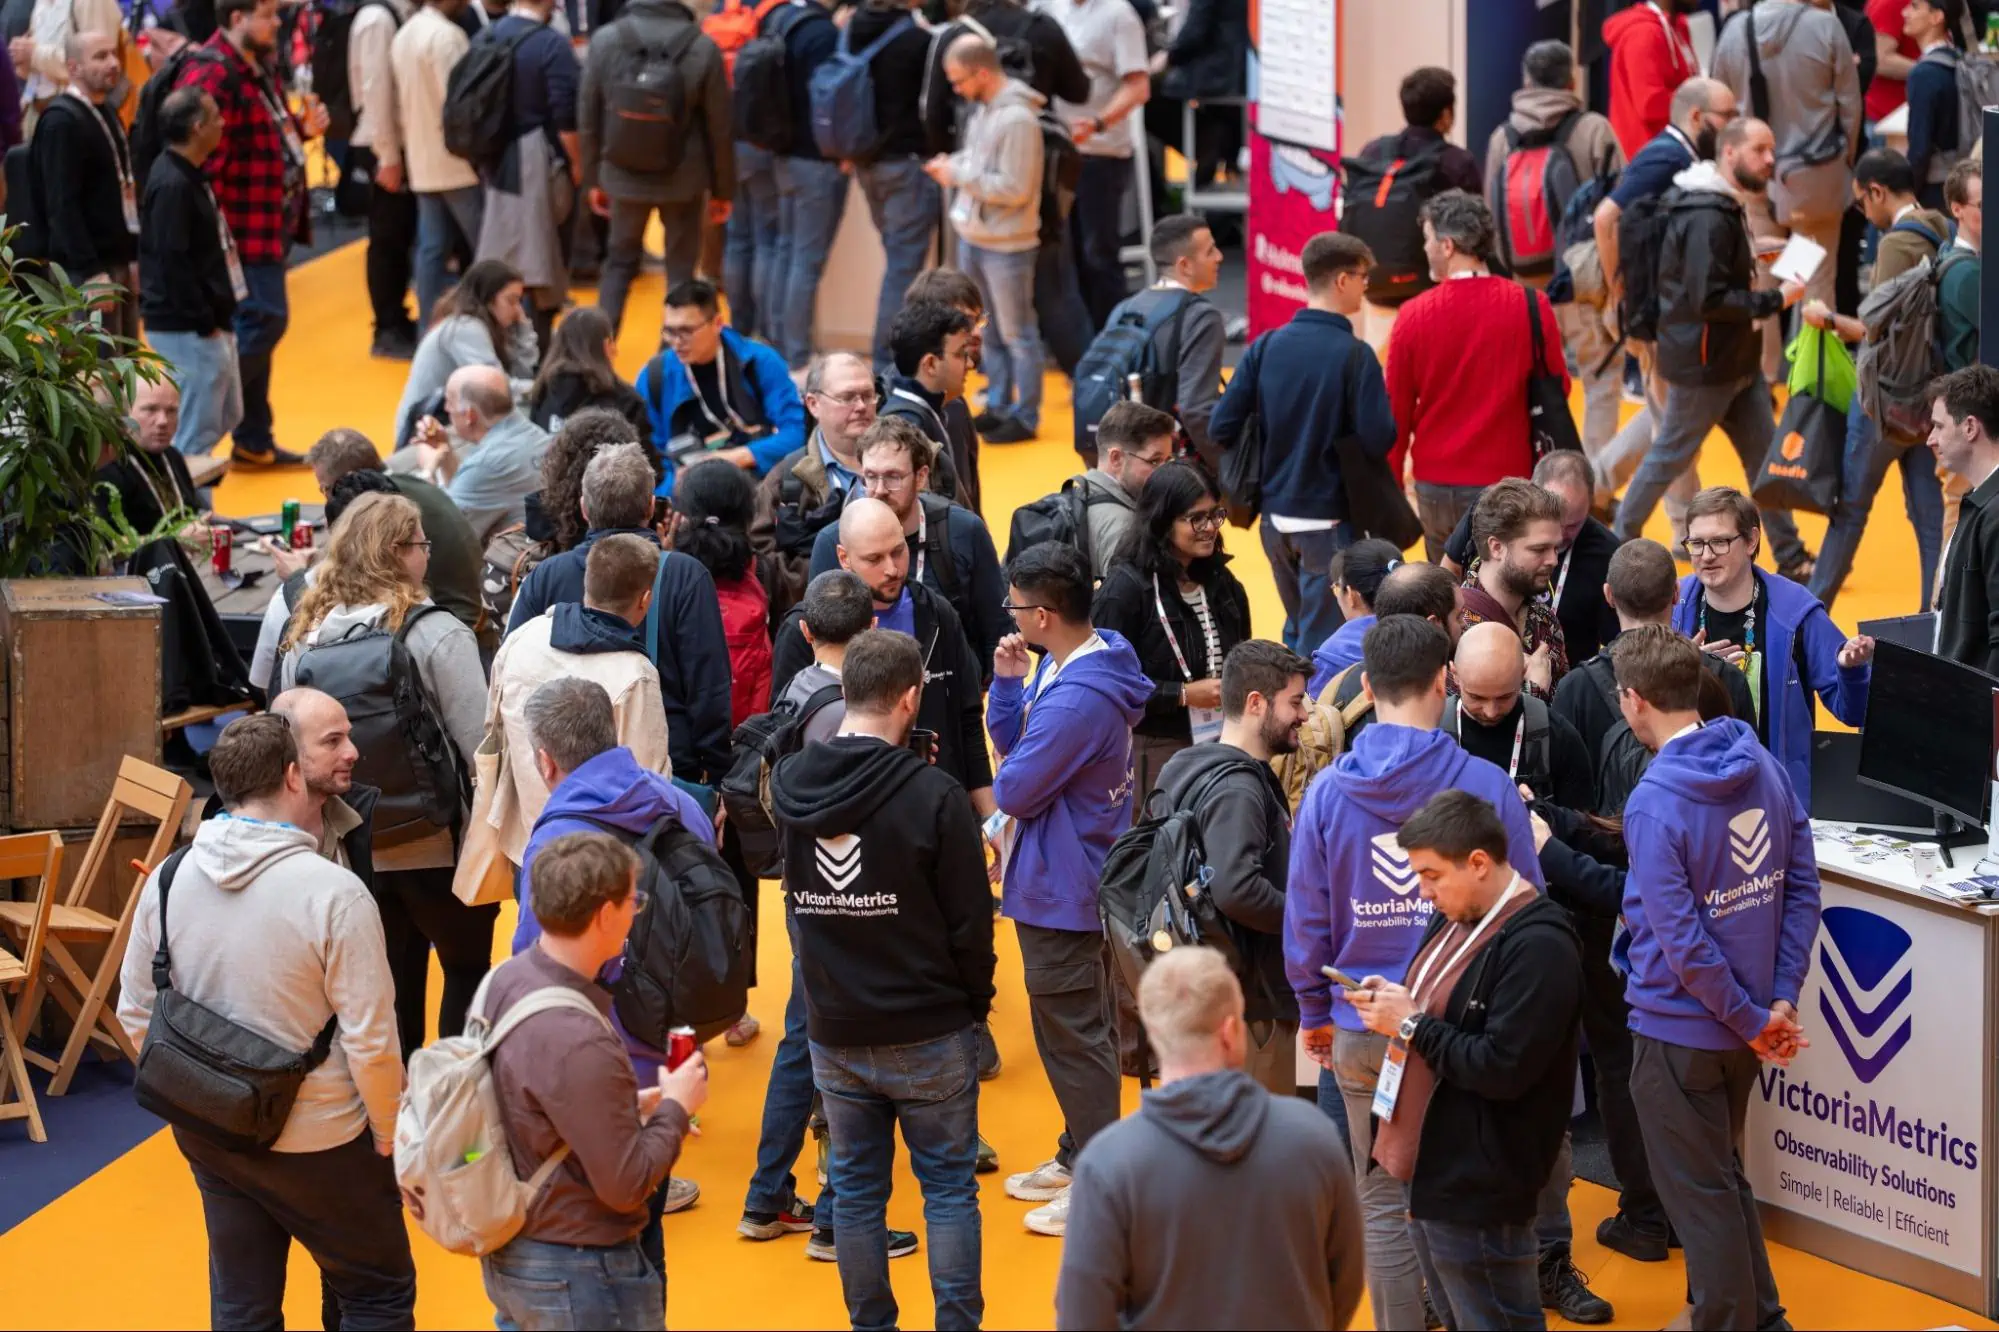
Most of the most useful conversations happened at the booth. People came with practical questions about cardinality, retention, infrastructure cost, and query performance, and those topics came up again and again across teams of very different sizes.
These conversations also made one thing clear: many teams are trying to simplify, not add more. They are rethinking old assumptions about telemetry volume and retention, and looking for ways to make observability cheaper and easier to operate. What made this session especially useful was its practicality. The team didn’t rely on custom tools or clever abstractions; they used standard mechanisms carefully and got a setup that reduced cloud spend and made their metrics pipeline more predictable. Beyond the classic observability signals, teams are increasingly looking into anomaly detection, AI tools, OpenTelemetry integrations, and FinOps.
Alongside the conference, we hosted our first after-party, “After Deploy,” co-organized with Varnish and Shipfox. The event brought together attendees in a more informal setting and extended many of the conversations started during the day.
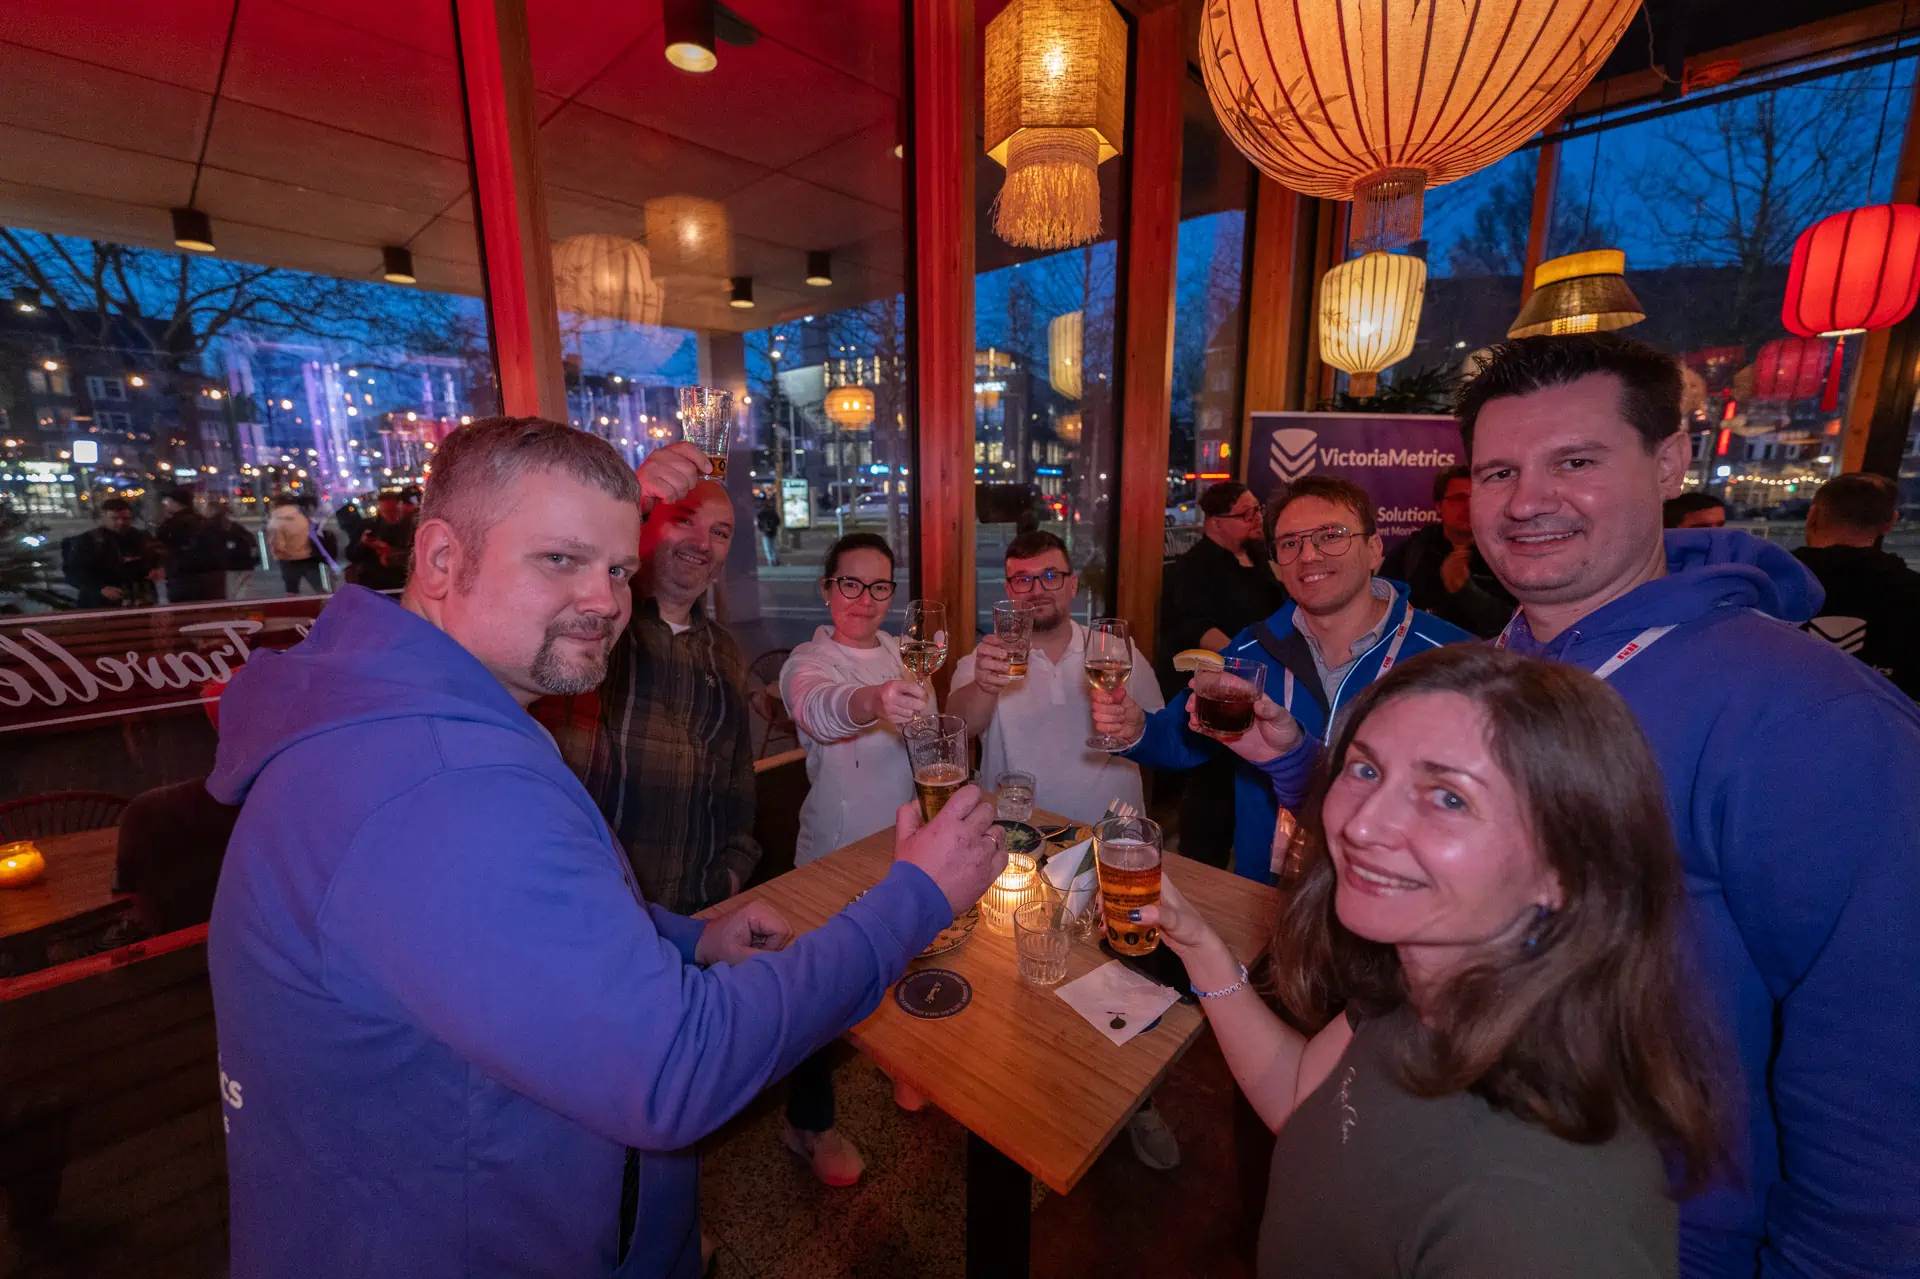
The turnout and engagement made it clear there is a strong interest in creating more community-driven spaces around observability and platform engineering. It was a successful first edition, and we plan to continue building on it in future events.
KubeCon also highlighted the importance of community beyond the technical sessions. Personally, my ongoing connection with Cloud Native Days Romania and initiatives like CNCF Merge Forward, which support underrepresented groups in tech, reinforced how critical it is to nurture these spaces. Encouraging diverse participation strengthens the ecosystem, creates more perspectives on problem-solving, and ensures that open-source and cloud-native technologies benefit from broader collaboration. Supporting these communities is as essential as building the tools themselves.
KubeCon Amsterdam made it clear that observability is no longer treated as a secondary concern. It is now part of how teams reason about system design from the beginning.
For VictoriaMetrics, the value of the event came less from visibility and more from direct feedback. The combination of talks and in-person discussions helped surface both recurring problems and emerging patterns across the community.
As a remote-first company, events like KubeCon give the team a chance to connect in person. They create space for better conversations, stronger collaboration, and a clearer view of what the community actually needs.
The team’s efforts stood out during Observability Day and KubeCon Amsterdam, from delivering hands-on demos to engaging in meaningful, in-depth conversations with users about their real-world observability challenges.
We will be present at KubeCon Salt Lake City. Until then, we look forward to continuing the conversations, learning from the community, and helping teams build more efficient and sustainable observability practices.
You can explore our observability stack through our open source projects - VictoriaMetrics, VictoriaLogs, and VictoriaTraces - as well as our enterprise offerings, VictoriaMetrics Enterprise, anomaly detection, and VictoriaMetrics Cloud.

此内容由惯性聚合(RSS阅读器)自动聚合整理,仅供阅读参考。 原文来自 — 版权归原作者所有。