



Last month, the VictoriaMetrics team gave a talk on retroactive sampling at KubeCon Europe 2026.
By writing this blog post, as a transcript of the session, we want to explain how retroactive sampling reduces outbound traffic, CPU, and memory usage in the data collection pipeline significantly compared to tail sampling in OpenTelemetry.
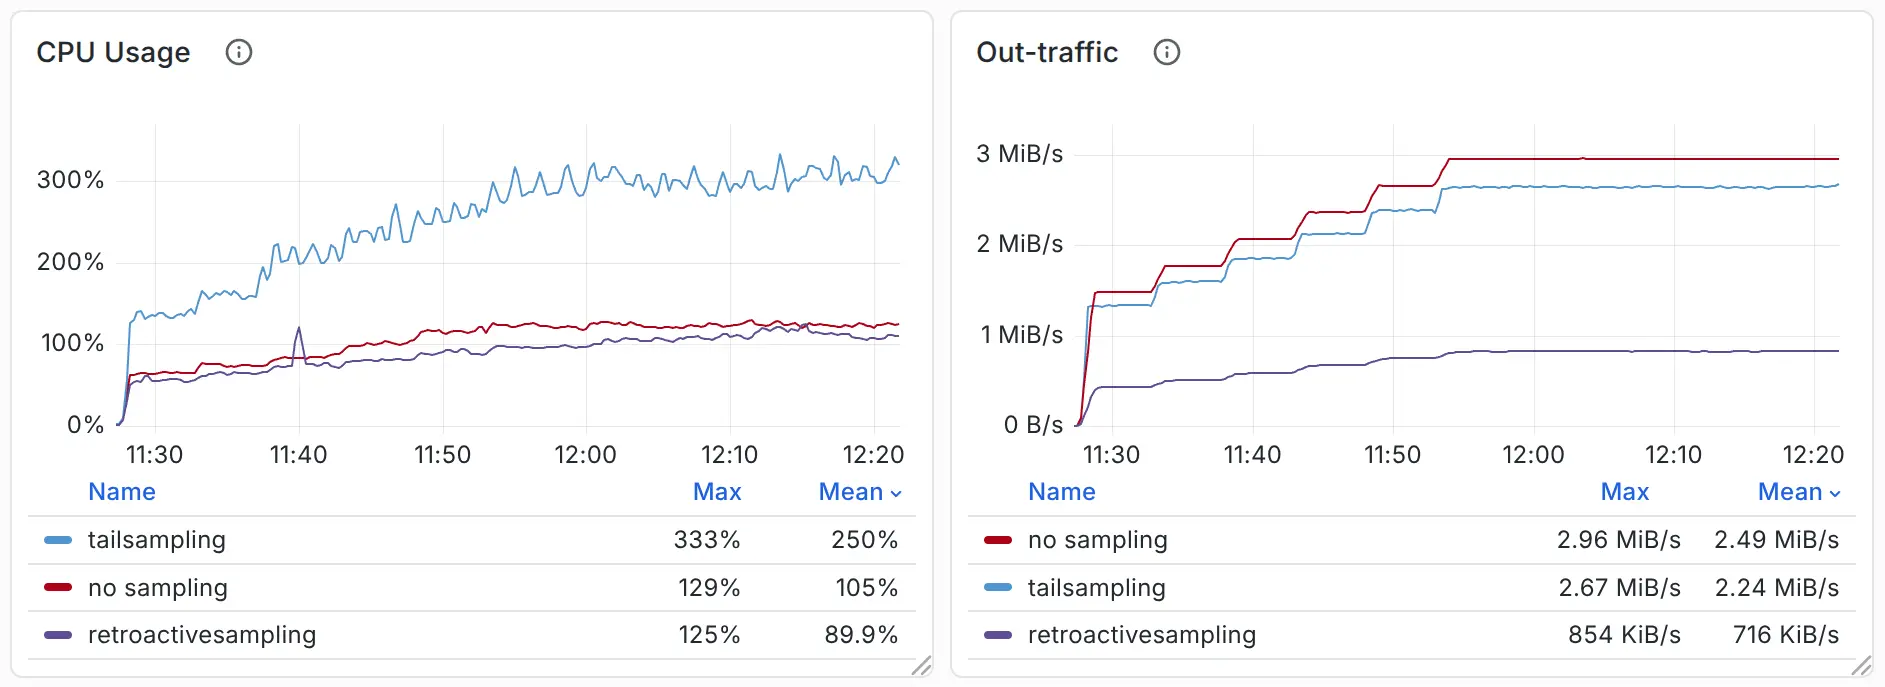 Benchmark Comparison (Lower is better. Details in section 3)
We’ll start with concepts for the beginners, but feel free to skip ahead to section 2 if you’re already familiar with these concepts - you won’t miss anything important.
 A Trace
The diagram above shows how a trace is visualized. The concept of distributed tracing is straightforward: you have a distributed system with dozens of microservices that call each other as they process a single request. Each microservice records its work as a span, and spans are organized into a trace by the parent-child relationships.
Traces could be expensive. One trace can contain hundreds or thousands of spans, with each span ranging from hundreds of bytes to multiple kilobytes. If your gateway serves millions of incoming requests every second, your microservices can easily generate traces at GB/s. Collecting, transporting, and processing this volume will stress your bandwidth, CPU, memory, and storage.
Sampling is the most common way to reduce trace volume. Based on when sampling happens, it falls into two categories:
You may be aware that other sampling approaches exist, but they are out of scope here:
This post focuses only on tail-based sampling, but comments about other sampling approaches are welcome.
Head sampling makes decisions at the entry point to your distributed services, typically at the gateway. The gateway - or let’s call it “the root service” - decides whether to keep or drop the trace, and propagates the decision to child services alongside the request (via headers/metadata).
Head sampling is usually random. It does not change the sampling decision even if the trace contains interesting events or exceptions. It simply discards data without being aware of what will happen.
On the other hand, tail sampling better aligns with user needs. It decides after collecting all spans of a trace so that it can take the full context of the trace into account.
In this approach, spans are generated by services and exported to a centralized collector. After waiting for a specified time interval to consider the trace complete, the collector analyzes it and makes the decision. If sampled, it forwards the trace to the next stage (such as trace storage).
The biggest problem with tail sampling is that it’s not free. In some cases, it could be even more expensive than collecting all the traces.
Tail sampling aggregates spans by trace_id and buffers them in memory. To buffer data for a few seconds or minutes, the collector running tail sampling must be provisioned with sufficient memory.
There are some techniques that can release memory earlier (such as making a decision as soon as the root span is received), but network latency and delivery unreliability in distributed systems prevent any approach from guaranteeing that all spans will arrive by a given event or time.
As a result, users often prefer longer buffering windows and aim to store more data within limited memory.
Beyond the memory cost, tail sampling imposes overhead on other resources, such as the CPU. In production, trace data cannot typically be handled by a single collector, which will hit its limits when scaling vertically. Multiple collector instances are therefore required. Since tail sampling needs to aggregate spans by trace_id, all spans of the same trace must be routed to the same collector.
This means a load balancer is mandatory: either deployed in front of the tail sampling collectors or implemented via a daemonset agent for load balancing.
Anyway, extra routing and computation overhead are unavoidable.
 Different Schema of Load Balancing
Last but not least, the network overhead.
In most scenarios, traces are forwarded across nodes. This uses the node’s bandwidth, which may be available at no extra cost.
But when it comes to cross-cluster, cross-region, and cross-cloud provider scenarios:
However, the traces that are preserved and ingested after sampling may account for only 10% - or even less, such as 1% or 0.1%.
 Junk Data
This means you pay the full cost for 100% of the traces, while most are discarded just minutes later.
The core idea behind retroactive sampling is straightforward and can be summarized in two parts.
First, it sends only the necessary attributes to the central collector for decision-making, while buffering raw data on edge agents and retrieving it only when a trace is sampled.
By reducing unnecessary data transfer, it directly lowers:
To reduce memory pressure on edge agents, we replaced the in-memory buffer with an on-disk FIFO queue, further lowering their overall memory footprint.
Now, let’s dive into more details.
If you take a close look at the attributes a span carries and compare them with the tail sampling conditions you are using, you will find that most of these attributes are irrelevant to the sampling decision.
 Key Attributes
For example, attributes such as os.version, sdk.version, request.path, and cmd provide almost no value when users want to preserve the following traces via tail sampling:
The collector only needs trace_id, the start_time and end_time of each span, and status_code to make the decision.
The retroactive sampling approach works in the following way:
At its core, this approach makes sampling decisions using only a small amount of information, then retroactively requests the full spans for the sampled traces.
 Retroactive Sampling
Specifically, the attributes sent to the collector can look like this. They are only 33 bytes long, while a full span can easily exceed 1 KB. As a result, the collector consumes far less memory buffering them compared with the traditional tail sampling approach which buffers the full span.
 +---------------------------+-----------------+-----------------+-----------------+
 |         16 bytes          |     8 bytes     |     8 bytes     |     1 byte      |
 +---------------------------+-----------------+-----------------+-----------------+
 |         trace_id          |    start_time   |     end_time    |   status_code   |
 +---------------------------+-----------------+-----------------+-----------------+
The collector in retroactive sampling operates similarly to tail sampling before the sampling decision. And once the decision is made, the collector sends the sampled trace_id back to all agents. This can be implemented in either a push-based or pull-based manner.
A key to retroactive sampling is that raw spans, instead of being buffered by the tail sampling collector, should now be buffered on the agent and retrieved only when necessary. However, if we simply use the same in-memory data structures as tail sampling does, it only shifts memory pressure from the central collector to edge agents without reducing the overall memory footprint, which is not ideal.
What we did to further improve it is use an on-disk FIFO queue instead of an in-memory buffer.
We prefer this solution for the following reasons:
In our (prototype) implementation, trace data is processed as follows:
We can use the diagram below to illustrate the workflow of the agent.
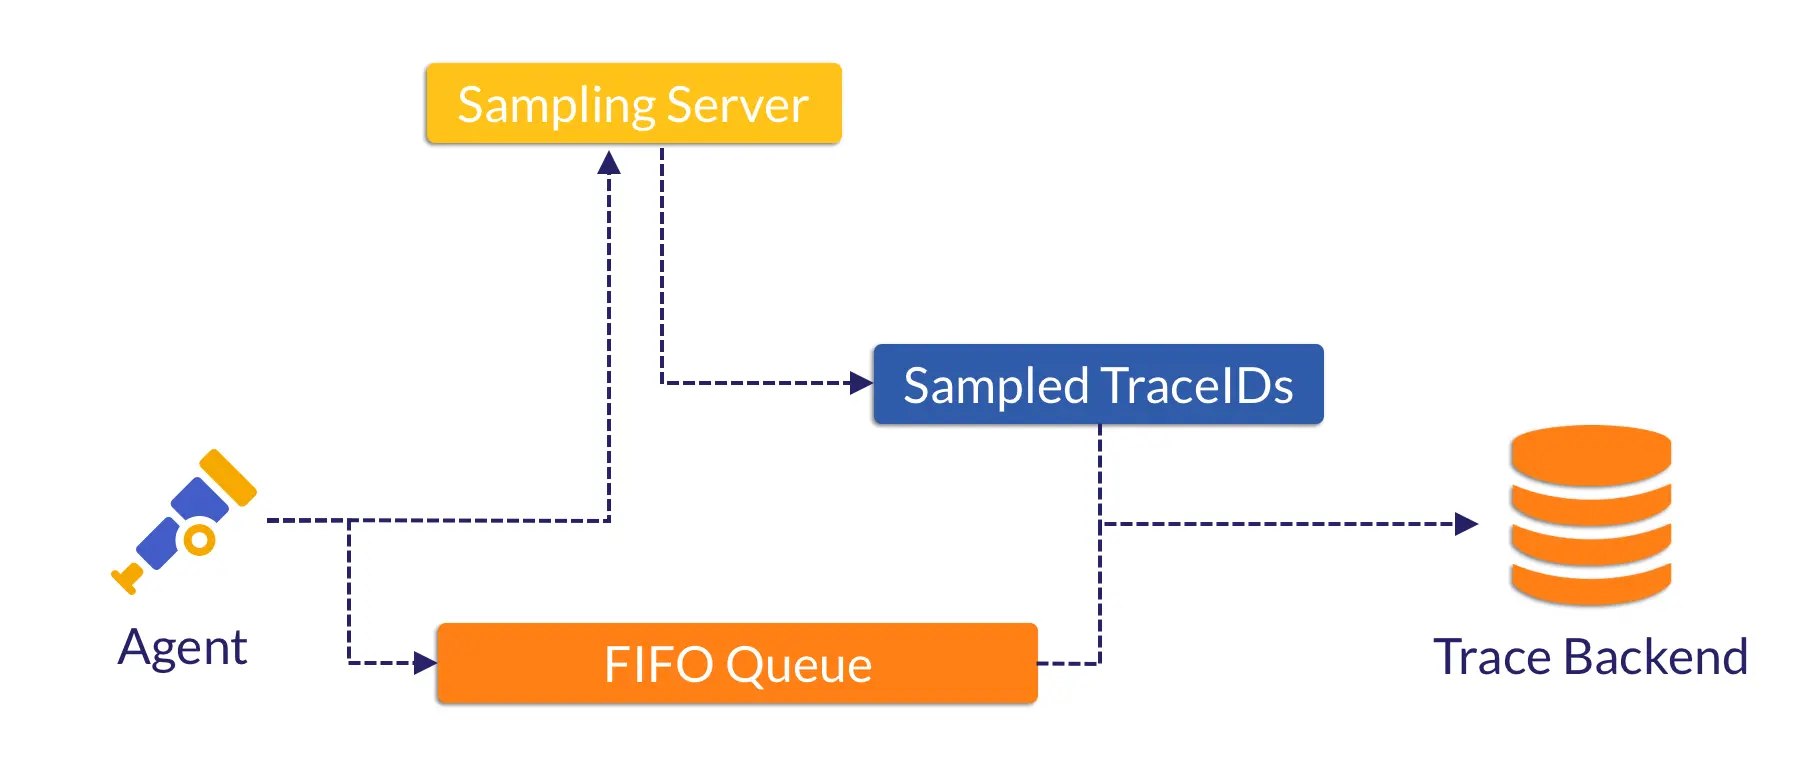 Agent in Retroactive Sampling
We built the sampling server to replace the collector, as shown in the diagram above and the benchmark in section 3, yet their roles remain similar.
We implemented it ourselves since no such implementation exists in the OpenTelemetry collector. But once the idea is accepted by the community, we can use a standard OpenTelemetry collector to handle such task.
That’s enough theory for now.
We ran a benchmark using the OpenTelemetry Demo combined with traffic replay to verify whether the retroactive sampling is truly useful.
In this benchmark, we wanted to compare retroactive sampling, no sampling, and tail sampling. We deployed:
 Benchmark Design
By generating a load of 15,000 to 30,000 spans/s, we observed CPU, memory usage, and outbound traffic as follows:
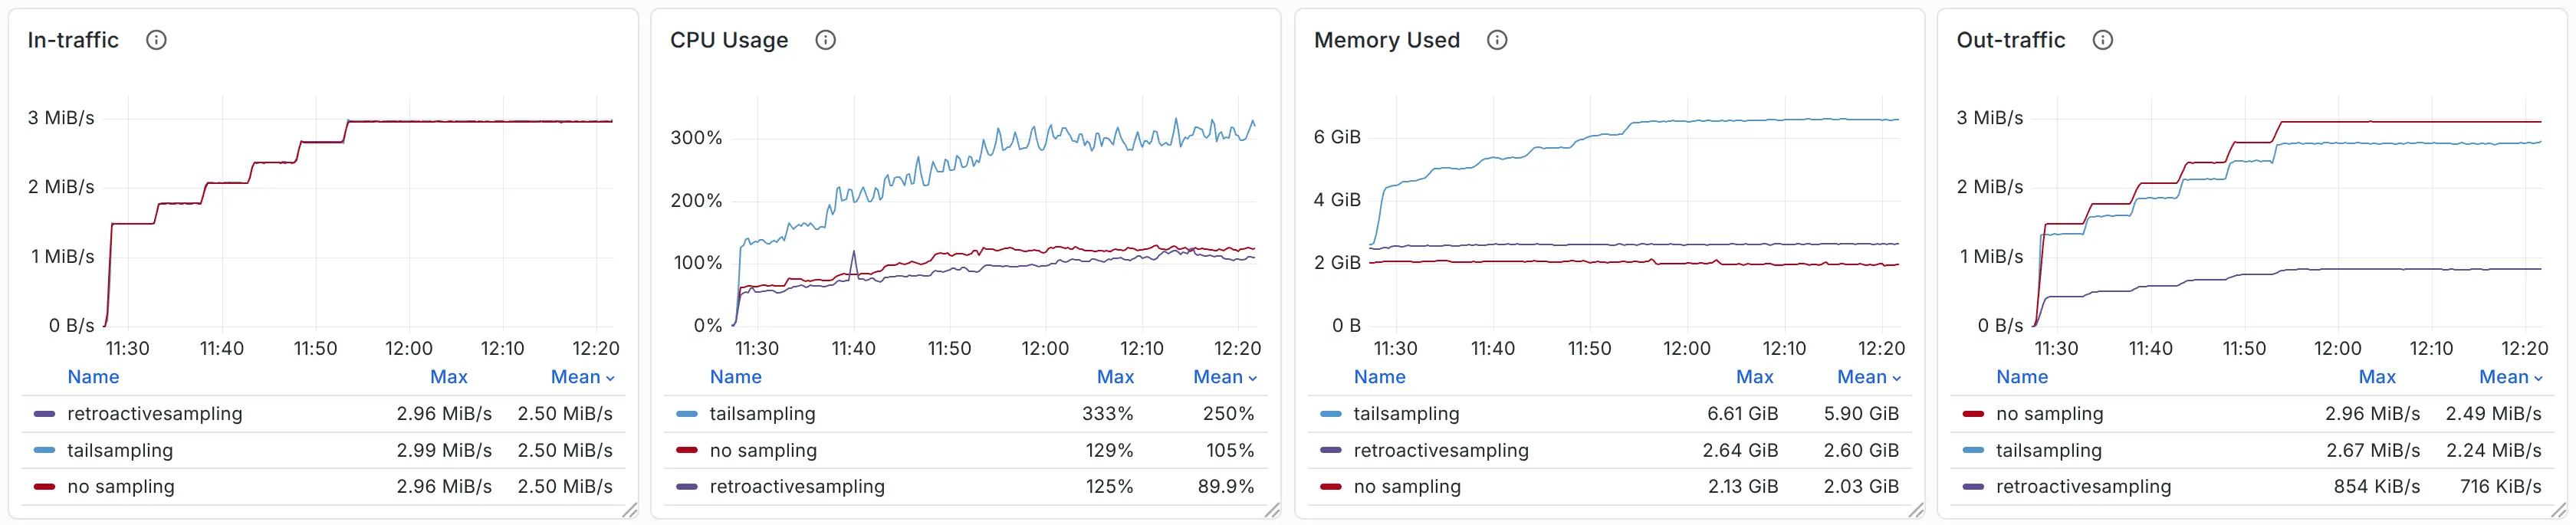 Comparison (Lower is better)
For reference, the total disk space used in retroactive sampling is shown below.
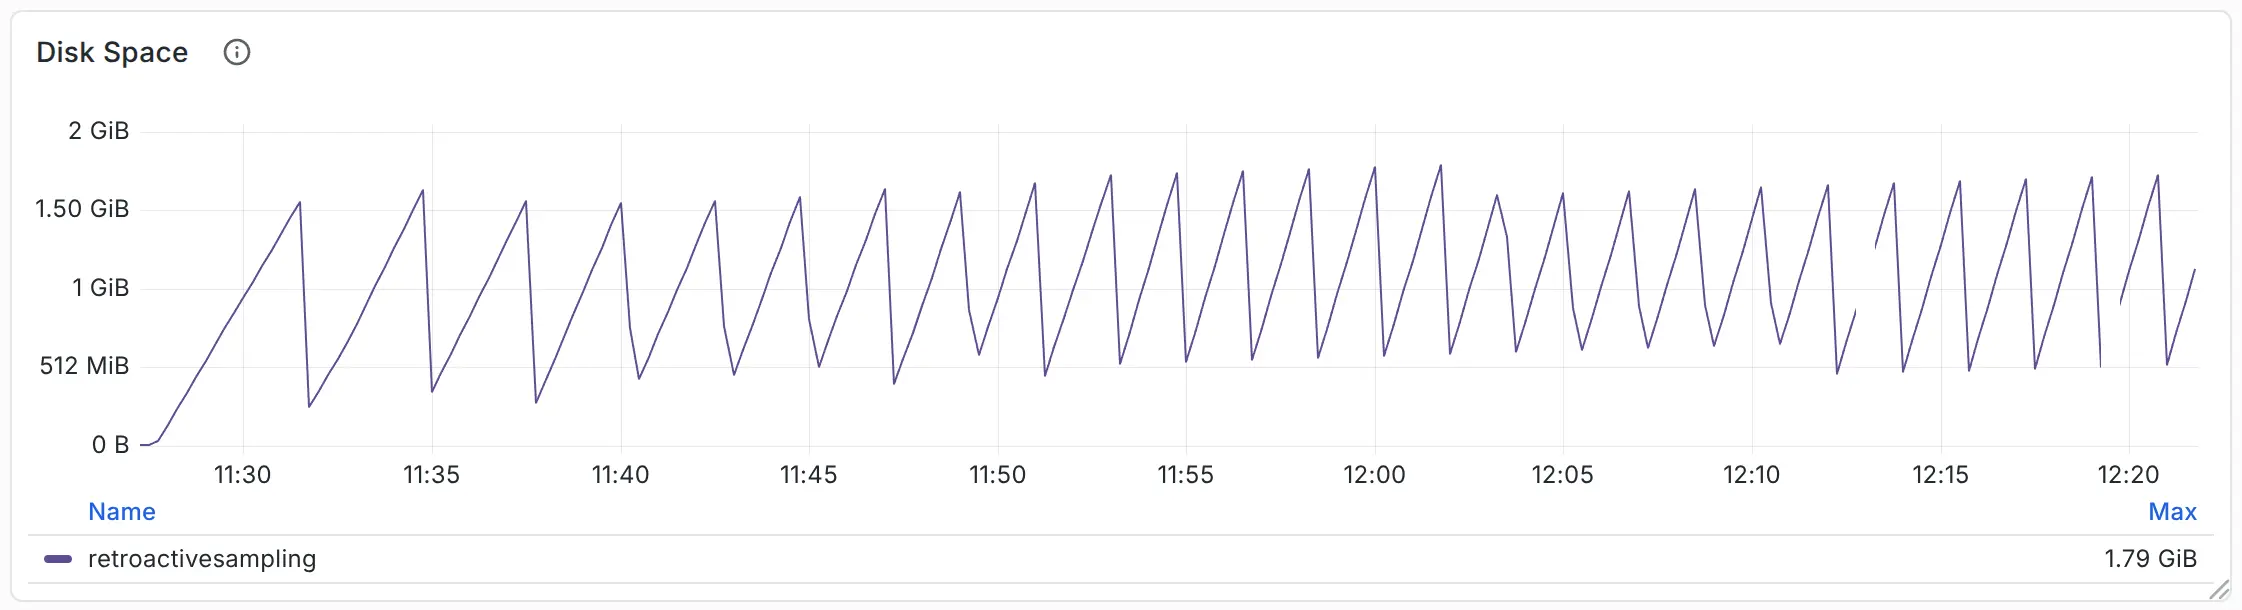 Disk Usage
Through comparison, we can see that retroactive sampling reduces compressed traffic by 70%, while saving 60–70% of CPU and memory resources. Compared with tail sampling, retroactive sampling consumes only 1.7 GB of disk space, but saves 4 GB of memory.
Every approach has its pros and cons, and retroactive sampling is no exception - it is not a silver bullet.
A drawback of retroactive sampling is that it provides little information to the collector for making sampling decisions.
What if users want to sample based on 10 attributes? Well, we can send all the required attributes to the collector, though this will consume additional memory and bandwidth. In the worst case, if users want to sample using all attributes of a span, retroactive sampling becomes a degraded version of tail sampling and loses much of its value.
+-------------+--------+------------------+---------------+---------------+----------------+
|  16 bytes   |   ...  |     128 bytes    |    64 bytes   |    8 bytes    |    64 bytes    |
+-------------+--------+------------------+---------------+---------------+----------------+
|  trace_id   |   ...  |   exception_log  |   user_agent  |  app_version  |    endpoint    |
+-------------+--------+------------------+---------------+---------------+----------------+
Are there any alternative solutions?
We don’t have to send all (sampling-related) attributes to the collector if the local agent can determine that a trace should be sampled.
Sampling-related attributes and conditions can be divided into two categories:
start_time / end_time from all spans.endpoint value.For the first category of attributes, we have no choice - they must be sent to the central collector for decision-making.
But for the second category of attributes, the agent can make the sampling decision. All that remains is to propagate the decision (trace_id) to other agents, so they also send the corresponding spans to the trace storage.
So, returning to the question: what if users want to sample based on 10 attributes? We only need to transmit data for a small number of (category-1) attributes, plus the sampled trace_id determined by the remaining (category-2) attributes.
This means bandwidth usage remains constrained and does not necessarily increase as more sampling-related attributes or conditions are added.
From a data structure perspective, attributes like the examples above (128-byte exception_log, 64-byte user_agent) can be effectively replaced by a single 1-byte sampled flag.
+-------------+-------------------+-------------------------+-------------------------+
|   1 byte    |     16 bytes      |        8 bytes          |        8 bytes          |
+-------------+-------------------+-------------------------+-------------------------+
|   sampled   |     trace_id      |    start_time (opt)     |     end_time (opt)      |
+-------------+-------------------+-------------------------+-------------------------+
That’s enough discussion for the agent. But don’t forget that the collector. In this design, the collector should be responsible for two tasks instead of one:
As we mentioned earlier, the significant memory savings of retroactive sampling stem from using disk instead of memory in the OpenTelemetry agent. The same approach can also be applied to tail sampling. While it won’t help reduce network bandwidth, it still provides benefits.
The OpenTelemetry community already has a proposal to offload in-memory data to disk: #42326. Specifically, it uses Pebble, a key‑value store implemented in Go, as the on-disk storage.
![#42326 [processor/tailsampling] Offloading trace storage to disk for scalability](https://victoriametrics.com/blog/kubecon-eu-2026-sampling/disk_based_tailsampling.webp) #42326 [processor/tailsampling] Offloading trace storage to disk for scalability
#42326 [processor/tailsampling] Offloading trace storage to disk for scalability
As shown in the benchmark, this approach reduces memory usage by over 80% compared to the memory-based tail sampling, but at the cost of a 5x increase in CPU utilization.
| Metric | In-Memory | Pebble (Disk) | Relative |
|---|---|---|---|
| Peak memory (MB) | 3420.63 | 638.78 | -81.32% (0.19x) |
| Avg memory (MB) | 2646.63 | 471.15 | -82.20% (0.18x) |
| Avg CPU (%) | 12.88 | 96.59 | +649.92% (7.50x) |
| Peak CPU (%) | 42.14 | 230.67 | +447.39% (5.47x) |
Since this is not a stable implementation, these numbers are likely to improve over iterations. We wish to include them in future comparisons with retroactive sampling.
What we can compare now are the data structures:
trace_id require random disk I/O. To speed up queries, data should be sorted by trace_id - this introduces extra overhead during data persistence.trace_id lookups in memory for fast access. We consume the FIFO queue to maximize sequential read speed, and compare it with the in-memory sampling decisions.As we’ve observed in our benchmarks, the design of retroactive sampling delivers good performance.
Through our talk at KubeCon + CloudNativeCon and this blog post, we aim to share the core idea behind retroactive sampling, not just its concrete implementation. By focusing on reducing unnecessary data transmission, users can simultaneously optimize bandwidth, CPU, and memory usage.
Besides, disk-based designs are well worth exploring - for both tail sampling and retroactive sampling. We have seen many sampling solutions built on Kafka and other delayed message queues, which overlap with the idea of retroactive sampling. We believe the disk-based design holds great potential.
Speaking of implementation: the retroactive sampling setup used in our benchmark is still a prototype, but we plan to donate it as a new processor to the OpenTelemetry collector so more users can benefit.
We also plan to add the same functionality to VictoriaTraces’ own agent (vtagent), targeted for the second half of 2026 - 100% open source. Stay tuned.
The idea of retroactive sampling originates from the NSDI 2023 paper The Benefit of Hindsight: Tracing Edge-Cases in Distributed Systems, by Lei Zhang.
While its implementation differs from VictoriaMetrics’ prototype, the paper elaborates on extensive design details and potential trade-offs.
We highly recommend that everyone interested in this topic read it to understand the original design.
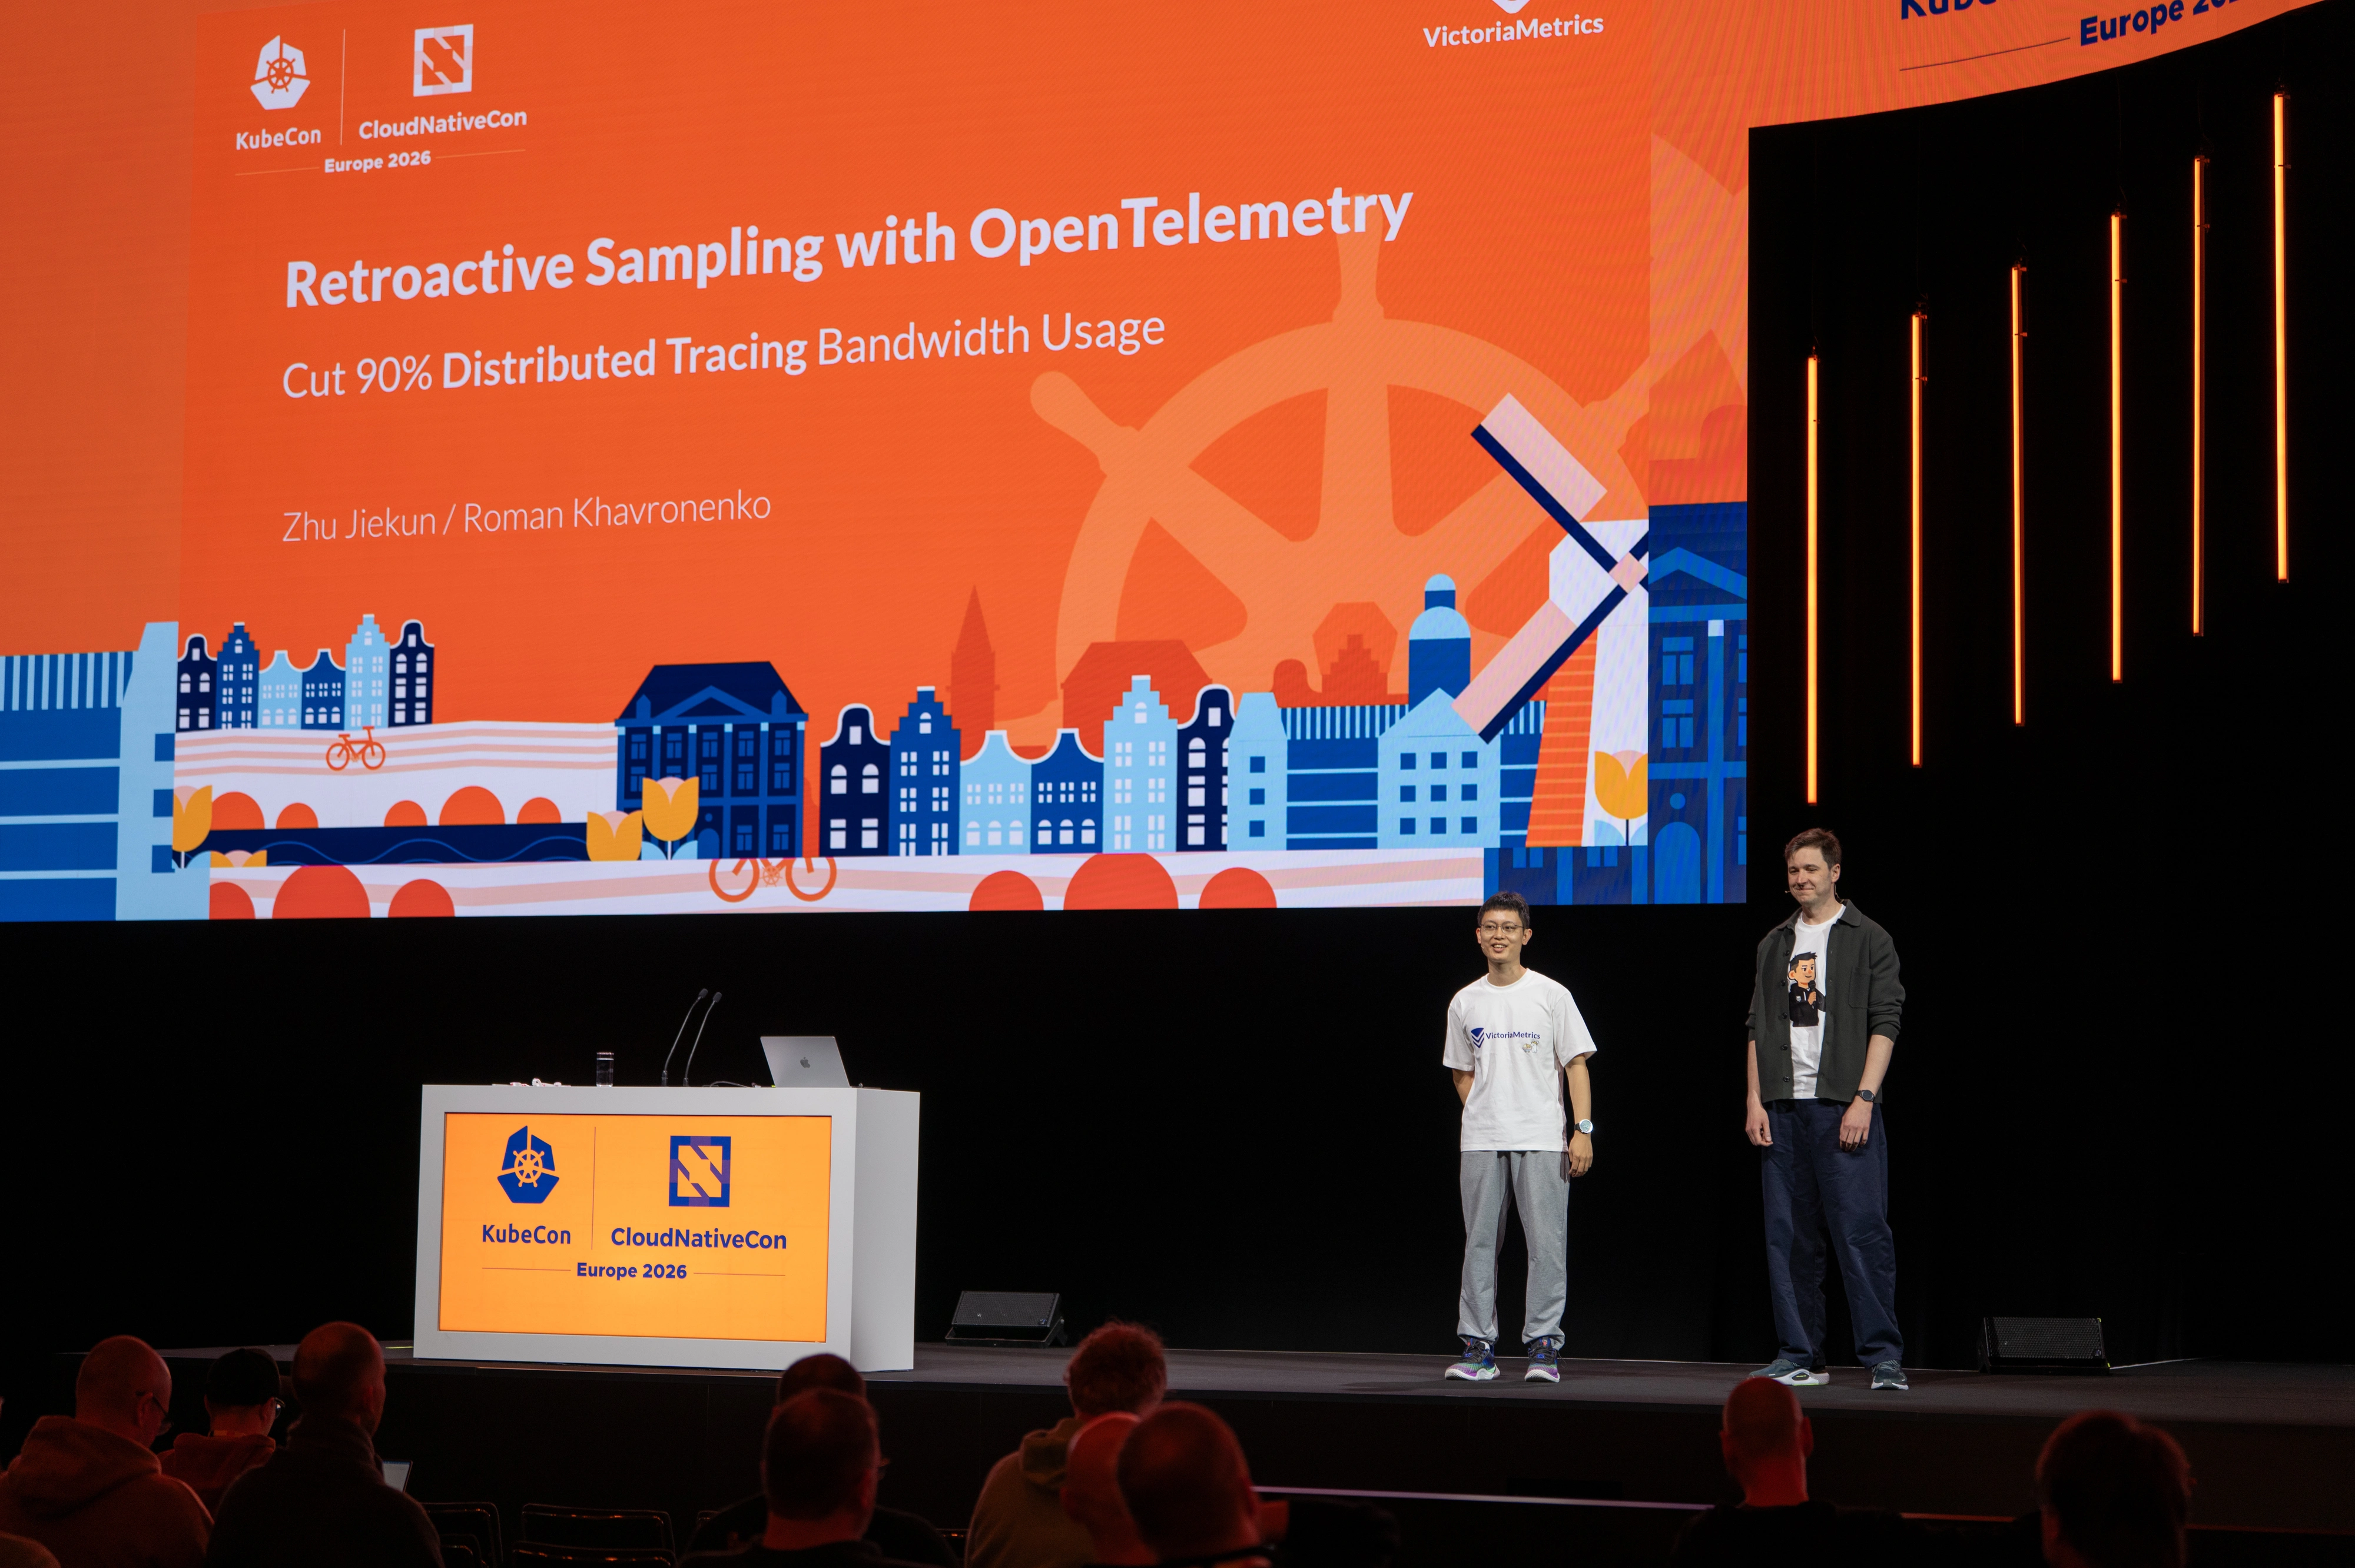 VictoriaMetrics at KubeCon #1
 VictoriaMetrics at KubeCon #2
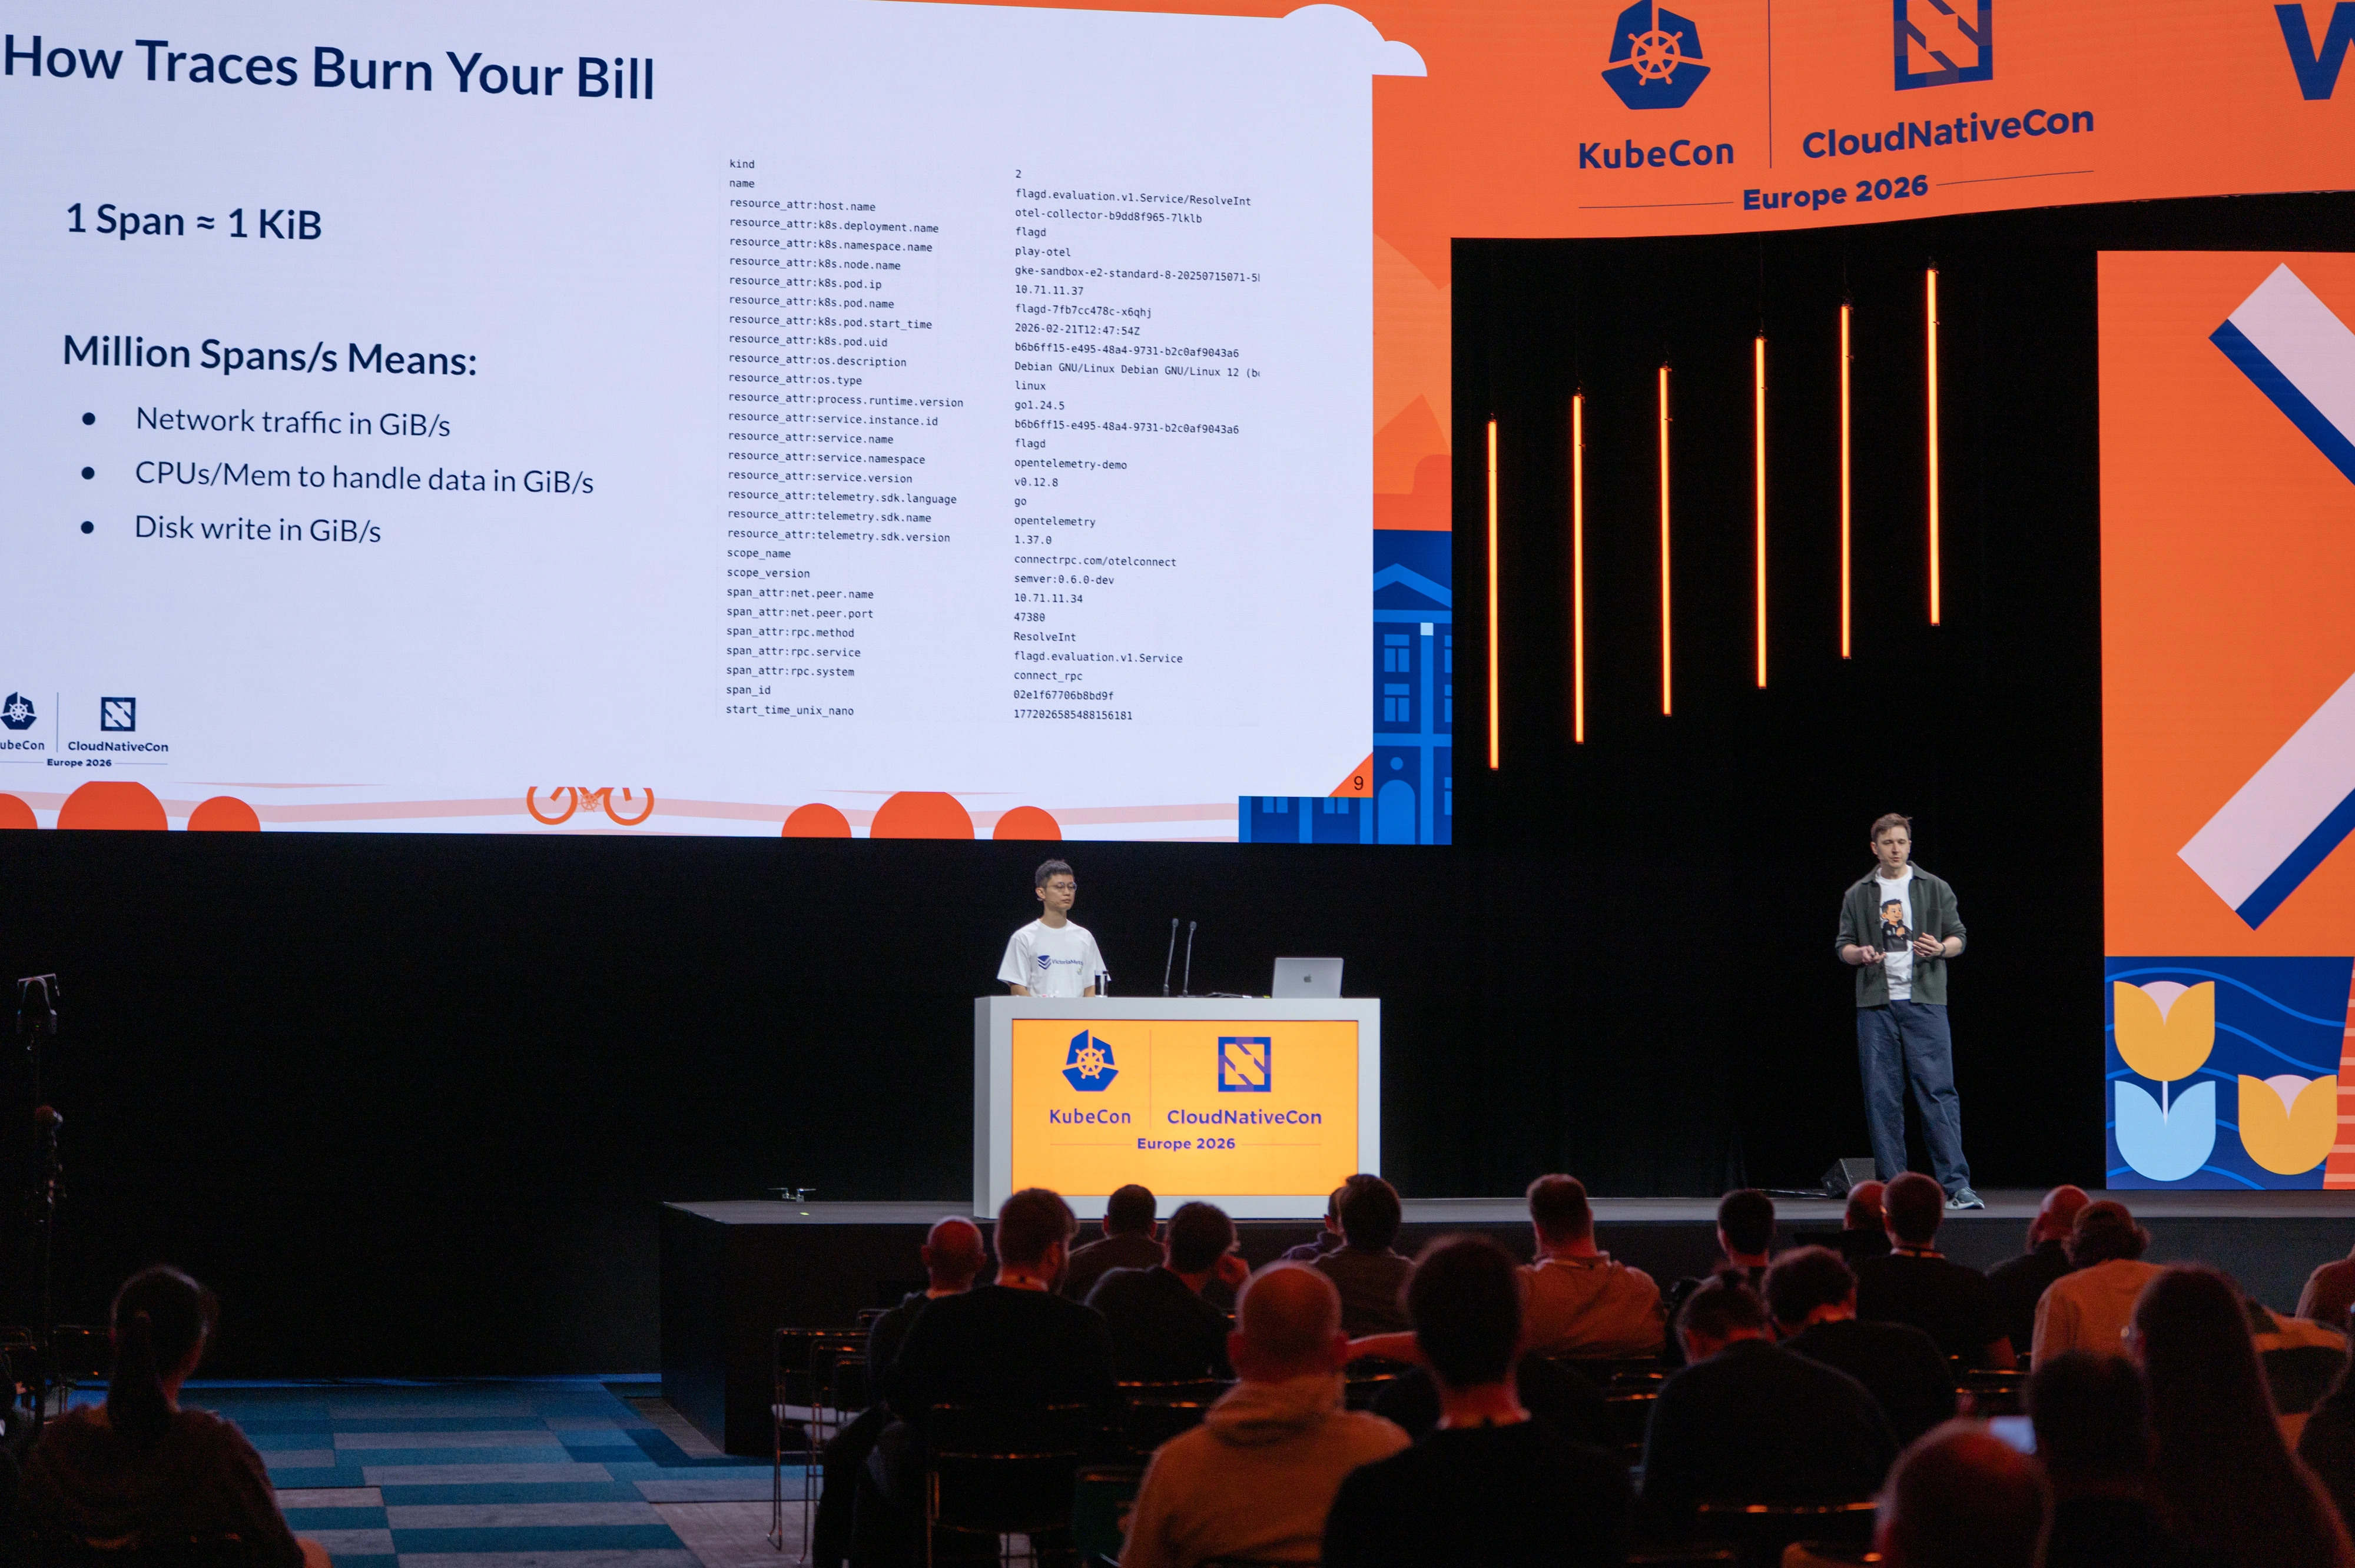 VictoriaMetrics at KubeCon #3
此内容由惯性聚合(RSS阅读器)自动聚合整理,仅供阅读参考。 原文来自 — 版权归原作者所有。